Migration networks in Senegal
Isabelle Chort∗
March 2010
Abstract
This paper investigates the importance and role of migration networks in Senegal using a new nationally representative survey conducted in 2006-2007. Basing on a sample of 1707 Senegalese households I investigate potentially differential effects of networks on interna-tional migration depending on their characteristics in terms of composition and destination. Results from logit and multinomial logit regressions show that household networks seem to be destination-specific and have a greater positive influence on migration than commu-nity networks. Moreover, counterfactuals estimates show that although women have lower probabilities to migrate, households networks effects seem to be greater for them than for men.
1
Introduction
Empirical studies on the determinants of migration generally find a large and positive influence of migration networks on location choices (Massey, 1986; Massey & Espinosa, 1997; Davis, Stecklov, & Winters, 2002). Indeed, networks enhance migration by lowering migration costs and uncertainty. First, networks help reduce migration costs by providing direct financial assis-tance to new migrants in the destination country. Second, network members supply migration candidates with useful information on the destination country, for example concerning labor market conditions.
Information conveyed by networks reduce uncertainty and rise expected gains from migra-tion. Consequently, migrant networks do not only increase the probability that individuals or households participate in migration, they influence destination choices as well.
∗
Paris School of Economics. Address: 48, Boulevard Jourdan - 75014 - Paris (France), Phone: +33 1 43136364, E-mail: [email protected]
However, the overwhelming majority of quantitative studies on migration networks rely on data on Mexico-US migration flows, the exceptionnal quality of available Mexican data on migration permitting furthermore interesting refinements of networks decomposition and differential influences (see for example Massey, 1986 ; Massey & Espinosa, 1997; Davis, Stecklov, & Winters, 2002; Aguilera & Massey, 2003; Bauer, Epstein, & Gang, 2002; Curran & Rivero-Fuentes, 2003; McKenzie & Rapoport, 2007; Winters, de Janvry, & Sadoulet, 2001).
By contrast very few studies aim at documenting African migration networks, and the main reason for this may be lack of appropriate data. Having access to an exceptionnally rich dataset from a new nationally representative household survey conducted in Senegal in 2006-2007, I intend to provide a description of Senegalese outmigrations before investigating the influence of networks on the decision to migrate. In line with the migrant networks literature and in the specific Senegalese context, the four following hypotheses are explored: First, migrant networks do increase the probability that individuals or households participate in international migration. Second, the strength of the links between networks members matters, which means that community networks do not play the same role as household networks. Third, networks are destination-specific and fourth, networks may have heterogeneous impacts, in particular depending on gender.
This paper is divided into six sections. Section II provides a brief overview of Senegalese mi-grations whereas section III presents the main findings and challenges of the migration networks litterature. The data are presented and described in section IV. Section V uses successively a logit model to study the role of networks on the decision to migrate, and a multinomial logit model to examine the issue of destination-specific networks. Moreover the potential heterogene-ity in networks effects depending on gender is dealt with by estimating counterfactuals. The final section presents concluding remarks.
2
Overview of Senegalese International Migrations
Over a population of 12 million, the number of Senegalese living abroad is estimated to between 400,000 and 2 million1. In contrast with a widespread idea, the largest part of them is located in Africa. Long ignored, West-African migrations have been drawing much political attention in
Europe in the past few years. Migration policies became more restrictive in Europe in the 1990s (Cornelius, Martin, & Hollifield, 1994) while the media spread a representation of West-African migrants as invaders of a new kind, threatening the European “fortress” (de Haas, 2008)2. It is thus necessary to put current migratory trends back in their historical context.
Indeed, Senegalese migrations have deep historical roots and current migration flows can not be explained without evoking traditions of mobility in Western Africa. The first region of Senegal to participate in massive international migration is the Senegal river valley adjoining Mauritania and Mali. Clark (1994) shows the links between current migration flows from this region and the high mobility characterizing the inhabitants of the valley as far back as pre-colonial times. Large population movements responded to numerous reasons: environmental, colonial, religious and historical factors contributed to make the economy of the region depend on emigration flows. In 1995, according to an International Labour Organization survey (Barou, 2002), migrants’ remittances in this region represented between 30 and 80% of households needs. But nowadays outmigration concerns all Senegalese regions and ethnic groups.
Senegalese outmigrations developed under the French colonization period. After the Sec-ond World War and until the end of the 1970s migration of Western-Africans to Europe was encouraged due to the needs of unskilled workers in Europe. Family reunification policies soon introduced led to a relative feminization of Senegalese migration flows. In the 1990s, immigra-tion policies in France and in Europe became more and more restrictive. At the same time new destination countries emerged, among which Southern Europe countries such as Spain and Italy attracting mostly unskilled migrants, and Germany, the United Kingdom or even North America for skilled migrants.
As for migration within Africa, Ghana, Nigeria and Cˆote d’Ivoire successively attracted Senegalese migrants before embarking on violent anti-immigration policies. Relatively wealthy countries such as Gabon and the two Congos also became destination countries for Senegalese migrants, mostly traders. In the 1990s North-African countries experienced an increase in Sub-Saharian migration flows and became destination countries in themselves as well as transit countries for migrants en route for Europe.
To the best of our knowledge however no valuable quantitative study of migration
determi-2Indeed, the media and public opinion in Europe tend to focus on illegal migration: see for example the large
media coverage of the events of Ceuta and Melilla in 2005 and more recently the numeral stories of canoes trying to reach the Canary Islands coasts.
nants and migration networks on Senegalese data can be found. And yet, a number of historical, sociological or anthropological case studies on Senegalese migrations document the importance and functioning of a large variety of migration networks based on either ethnic or geographic characteristics, occupation, or religion. Among others, Adams (1977) and Guilmoto (1998) provide descriptions of community networks originating from the Senegal river valley, Ndione & Lalou (2005) on the other hand show evidence of networks’ impact on migration in the urban context of Dakar. Bredeloup (2007) illustrates the role of occupational networks on migration in the diamond trade sector. Murid networks are much documented (see for example Bava (2003)), whereas Elia (2006) or Mboup (2001) provide detailed analyses of Senegalese migrant networks in a destination country, namely Italy. In addition, Dia (2009) documents the specialization of households regarding the destination their migrant members choose and thus provides evidence of the destination-specific aspect of migration networks.
3
Networks in the Migration Literature
At the micro-level, in the reference neoclassical cost-benefit analysis of migration the decision to migrate occurs in response to (expected) earnings differentials net of migration costs accross regions or countries (Sjaastad, 1962; Harris & Todaro, 1970). And yet, empirical observations tend to support the view of migration as a self-sustaining networks-based process, unrelated with differences in actual or expected incomes in the sending and receiving countries (Massey, 1986; Moretti, 1999; Carrington, Detragiache, & Vishwanath, 1996). Nevertheless, considering migration costs as a decreasing function of networks’ size allows the neoclassical migration model to account for this empirical puzzle (Carrington, Detragiache, & Vishwanath, 1996).
Indeed, most studies concerned about migration networks assess their positive impact on migration through cost-decreasing effects. First, current migrants can provide direct assistance to candidates to migration. Such an assistance is not limited to financial aid and can consist in psychological support as well. Second, current and former migrants are a much valuable source of information for would-be emigrants. The issue of whether positive effects of networks on migration result in the first place from direct assistance helping reduce financial costs of migration, or from pure information transfers (Bauer, Epstein, & Gang, 2002) is not addressed here.
Definitions of migrant networks in the related literature vary from family members with a past or current migration experience to the whole group of fellow-countrymen living in a destination country or city. Most recent studies concerned with migration networks have dealt with the effects of different networks’ compositions. A first decomposition of networks, taken from social networks theory (Granovetter, 1983), has been made between “strong ties” associ-ated with family networks and “weak ties” relative to community networks (Davis, Stecklov, & Winters, 2002; Curran & Rivero-Fuentes, 2003; Grieco, 1998). Disaggregating further fam-ily networks according to kinship structure, Davis, Stecklov, & Winters (2002) show that the stronger the ties, the larger the positive impact of networks on migration. Recent empirical studies also distinguish networks made of current migrants from networks whose members have a past migration experience (Davis, Stecklov, & Winters, 2002; Winters, de Janvry, & Sadoulet, 2001). Indeed these two types of networks are expected to influence migration through dif-ferent channels since current migrants are able to provide direct assistance in the receiving country and up to date information whereas historic networks indicate a family or community tradition of mobility. Disaggregating networks according to their gender composition permits to emphasize the existence of gendered migration patterns (Curran & Rivero-Fuentes, 2003; Davis & Winters, 2001). In addition the migration decision is usually considered as a multiple-option choice between several destination places, thus leading to the obvious decomposition of networks according to their destination content(Davis, Stecklov, & Winters, 2002; Curran & Rivero-Fuentes, 2003).
Very interestingly McKenzie & Rapoport (2007) relate networks effects to self-selection is-sues. Using Mexican data, they show that the propensity to migrate is positively related to education in communities with small networks, whereas it decreases with education in commu-nities with large networks. Their results are thus consistent with both the positive self-selection of migrants driven by high migration costs and the negative self-selection of migrants due to lower returns to education in the United-States than in Mexico for highly educated Mexicans.
Methodological divergences in the empirical migration and networks literature concern the representation of the migration decision as a household or an individual decision and the choice of an appropriate model to account for the decision to migrate. In the “new economics of migration” initiated by Stark (1991) and his co-authors the migration decision is considered at
the household level (Winters, de Janvry, & Sadoulet, 2001). Such a household based approach happens to be criticized because of its implicit assumption of a unitary household (Grasmuck & Pessar,1991; Davis, Stecklov, & Winters, 2002). In the Senegalese context, household based models seem particularly suited to the migration of single young men or married men leaving their wives and children in their home country which has long predominated (Barou, 2002). In spite of the evolution of migration patterns, as shown in case studies emphasizing conflicting individual strategies within households, ties remain strong between Senegalese migrants and their home country in particular through remittances. The high costs of international migration on the one hand, the weight of traditions reinforced by Islamic religious precepts on the other hand, contribute to explaining the strength of the ties between migrants and their household of origin.
Thus numerous arguments tip the scales in favour of a household model for migrations in the context of Senegal. Nevertheless this paper does not aim at settling this theoretical issues. In section V, regressions are run at both household and individual levels in order to estimate the impact of individual characteristics such as age, sex or education on the migration decision. And since the purpose of this article is to explore the influence of different kinds of networks first on the probability to migrate and second on the destination choice, we study the migration decision using binary and multinomial logit regression models.
Beyond differences in method, most empirical studies on migration networks are prone to a number of weaknesses. First comes the difficulty to comprehend the dynamic aspect of networks. Indeed, the formation of networks is obviously totally endogenous to individual migration decisions. In addition, most empirical studies basing their results on cross-section data, their authors are faced with an unsolvable problem of unobserved heterogeneity. Different ways of dealing with it can be found. Using historic migration rates to instrument for current community networks, McKenzie & Rapoport (2007) make the questionable assumption that historic migration variables affect current migration only through networks effects. Indeed, communities that have high historic migration rates may have been and may continue to be more prone to respond positively to migration for unknown reasons. Davis, Stecklov, & Winters (2002) settle for giving warning regarding weaknesses of the use of cross-sectional data and including control variables in their regressions. Winters, de Janvry, & Sadoulet (2001) consider
that the decision whether to migrate and the optimal level of migration (the number of migrants sent by the household) are two sequential stages in the migration decision process, and thus model migration as a two-stage Heckman procedure. Lacking relevant instruments, they resort to structural properties of their model, though recognizing that “this is usually considered too weak an identification”. As regards the empirical analysis conducted in this paper, endogeneity issues and interpretation problems are further discussed in section V.
4
Data and Summary Statistics
4.1 The Survey
Data used in this paper come from the “Enquˆete sur la Pauvret´e et la Structure Familiale” (EPSF) survey 3, that were collected in Senegal in 2006-2007 (DeVreyer, Lambert, Safir, & Sylla, 2008). The data comprises 1785 households distributed among 150 clusters4. A two stage sampling procedure based on a double stratification using the 2004 census data ensures that the resulting sample is nationally representative. Survey design and sampling weights are exploited to draw inferences on the whole Senegalese population. Unless otherwise mentioned, all summary statistics and regressions results are based on weighted data.
The PSF survey includes information on socioeconomic characteristics of households as well as detailed information on their migrant members. The sample is restricted to households whose head is Senegalese in order to exclude immigrant households settled in Senegal5. The estimation sample thus comprises 1707 households whose head is Senegalese and 8645 individuals aged more than 15.
Migrants are defined as household members aged more than 15 years old, who were living abroad at the time of the survey, and who once lived in the surveyed household. Relatives of household members living in another country but who have never lived in the surveyed household are thus not counted as migrants. Actually, the design of the survey allows to identify migrants
3The EPSF survey was designed by Momar Sylla and Matar Gueye of the Agence National de la Statistique
et de la D´emographie of Senegal, on the one hand and Philippe De Vreyer (EQUIPPE, University of Lille 2 and IRD-DIAL), Sylvie Lambert (LEA-INRA and PSE) and Abla Safir (CREST-INSEE and LEA-INRA) on the other. The data collection was conducted by the ANSD thanks to the funding of the IRDC (International Development Research Center.)
4Clusters are drawn among census districts which are small demographic units of about one hundred households
: they amount to one village in rural areas to a few blocks in Dakar.
5Including these non-Senegalese households would lead to an overevaluation of the size and influence of
only if they are close relatives to a household member present in the household at the time of the survey, unless they left less than five years before the time of the survey. Hence, the population of migrants built from PSF survey data is made of a representative subsample of migrants who left after 2001 added to with a subsample of individuals who migrated before 2001 and left behind them at least a spouse, a parent or a child. Data allow to differentiate migrants depending on the broad destination they chose. It is known whether the migrant was living in an African country or in a non African country at the time of the survey. This feature is exploited to decompose the influence of networks on migration choice depending on their destination content. Migrant households are defined as households with at least one adult member currently living abroad. Overall 255 adults in the estimation sample are international migrants, among which 105 were living in another African country at the time of the survey, and 150 in a non-African country. Using sampling weights, this population of adult migrants represents more than 160,000 individuals, that is 2.5% of the total adult population of Senegal6. Summary statistics on the characteristics of migrants and migrant households are presented in table 1 and 2.
The 255 international migrants are distributed among 186 households (10.3 % of our sample). 81 households (4.8 %) have a migrant in an African country whereas 108 (5.8 %) have a migrant out of Africa. It is noteworthy that only four households actually have migrants both in Africa and out of Africa7. Migrant households have between one and six international migrants with an average of 1.36. As can be seen in table 2 the average number of migrants per household is slightly higher for households participating in migration out of Africa (1.41) than for households with migrants in an African country (1.34). However, a huge majority of migrant households (74.3 %) only have one migrant.
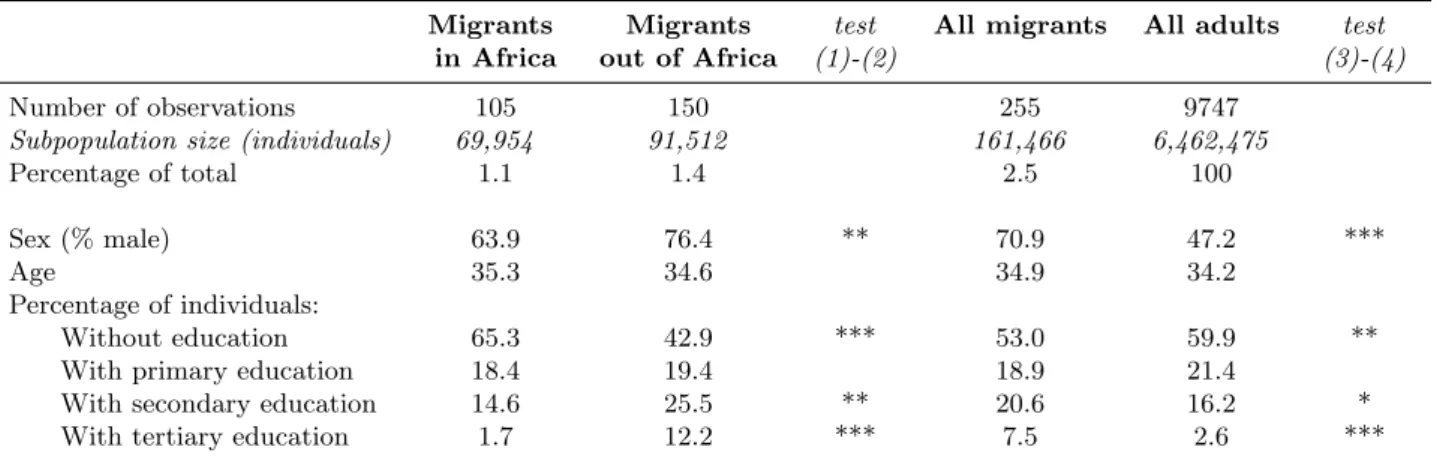
As can be seen in table 1, more than two thirds of the migrants are men. This is all the more true for migrants out of Africa (76.4 % are men). As for education, migrants greatly differ depending on their destination: the percentage of migrants to an African country with-out education is 65.3 %, even larger than the percentage of non educated non-migrant adults (59.9 %) whereas only 42.9 % of migrants out of Africa never went to school. The difference in the education profiles of within-Africa migrants and migrants out of Africa is even more striking
6Note that this figure is obtained from data on migration outflows and is thus not comparable to estimates of
the stock of Senegalese living abroad.
Table 1: Individual characteristics of migrants and non migrants
Migrants Migrants test All migrants All adults test in Africa out of Africa (1)-(2) (3)-(4) Number of observations 105 150 255 9747
Subpopulation size (individuals) 69,954 91,512 161,466 6,462,475
Percentage of total 1.1 1.4 2.5 100
Sex (% male) 63.9 76.4 ** 70.9 47.2 ***
Age 35.3 34.6 34.9 34.2
Percentage of individuals:
Without education 65.3 42.9 *** 53.0 59.9 ** With primary education 18.4 19.4 18.9 21.4
With secondary education 14.6 25.5 ** 20.6 16.2 * With tertiary education 1.7 12.2 *** 7.5 2.6 *** Source: PSF Data collected in 2006.
Tests of equality of the means between migrants in Africa and migrants out of Africa on the one hand, and between migrants and non-migrants on the other hand are obtained from an adjusted Wald test.
when comparing the percentages of individuals with tertiary education (1.7 % for migrants in Africa, 12.2 % for migrants out of Africa)8.
Additional information about the reason for leaving and the exact destination place is avail-able for two different subsets of 154 and 168 migrants. Though not exploited in the remainder of this article these additional data provide an insight about the migration process. Job-related reasons come first (more than 70%) for male migrants whatever their destination whereas it is only second for women with 23%, far below marriage which is put forward by 42% of female migrants. This feature suggests that migration patterns probably differ for men and women. Second, as concerns migrants’ destination, 22 countries are mentionned. Most frequently cited are France (43 individuals), The Gambia and Mauritania (21 and 23 migrants), followed by Italy and Spain (17 and 11 migrants). All other destination countries are chosen by less than seven migrants. Note that among African countries, those adjoining Senegal are the top destinations, whereas among non African countries France comes first, in spite of the growing attractiveness of new destinations of Southern Europe.
8Note that it is not known whether they reached their education level before leaving the country or whether
T able 2: Characteristics of migran t and non migran t household s (1) (2) (3) (4) (5) Households Ho useholds Households Ho useholds All with Migran ts with Migran ts test with Migran ts without test Households Units in Africa out of Af ric a (1)-(2) Migran ts (3)-(4) Num b er of observ ations (households) 81 108 186 1530 1716 P ercen tage of total 4.8 5.8 10.3 89.7 100 Household Size 10.1 11.2 10.7 7.9 *** 8.2 Dep end ency ratio 0.48 0.45 0.46 0.43 ** 0.43 Gender c omp osition ratio 0.4 5 0.40 ** 0.43 0.47 *** 0.47 Age of the household head y ears 51.8 53.4 52.5 49.7 ** 50.0 Sex of the household head % male 61.5 49.3 ** 55.0 81.9 *** 79.1 Murid % 14. 7 33.7 *** 24.1 34.1 *** 33.0 Educ. of the head, no education % 64.7 62.0 63.0 66.4 66.1 Educ. of the head, primary % 18.5 10.8 14.6 19.2 * 18.7 Educ. of the head, secondary and higher % 16.8 27.3 *** 22.5 14.4 ** 15.2 W ealth indicators Land % 46.9 25.2 *** 34.7 41.9 * 41.2 Net p er capita total exp enditures 10 6 X OF 0.4 01 0.792 ** 0.626 0.542 0.551 Lo cat ion Rural % 55.1 38.2 ** 43.7 53.7 * 52. 9 Dak ar % 24.9 42.5 *** 35.4 27.5 ** 28.3 North-W est % 6.8 15.3 ** 11.1 15.5 15.1 North-East % 7.1 7.3 6.7 19.7 *** 18.3 South % 18.3 12.3 14.3 10.4 10. 8 Cen ter % 42.9 22.6 *** 32.5 26.9 27.5 Dep end ency ratio is the share of households residen t mem b ers aged 0-15 and aged 65 and o v er; gender comp osition is the prop ortion of male household mem b ers Dak ar is the administrativ e Dak a r region ; North-W est represen ts the regions of Lo uga and Sain t-Louis; North-East, the regions of Mat am and T am bacounda; South, th e regions of Kolda and Ziguinc hor; and Cen ter, the four regions of Thi `es, F atic k, Diourb el and Kao lac k. T ests of e q ua lit y of the means b et w een households wi th migran ts in Africa and households with migran ts out of Africa on the one hand, and b et w een households with and with out migran ts on the other hand are obtained from an adjusted W ald test. Means are found to b e differen t at the follo wing significance lev els ∗ p < 0 .10, ∗∗ p < 0 .05, ∗∗∗ p < 0 .01 Sour ce : PSF Data collected in 2006.
Characteristics of households depending on their migration status are presented in table 2. Variables used are described in table footnotes wherever needed. Households with migrants in Africa appear to be much more similar to non-migrant households than to households with migrants out of Africa. The latter have a biaised gender composition with more adult females relative to males, are even more often headed by a woman and/or an individual with at least some secondary education, are wealthier in terms of land owned and per capita expenditures, and are more often located in urban areas, especially in Dakar.
4.2 Migration Networks
The networks approach chosen in this paper follows a methodology applied to Mexican data by Davis, Stecklov, & Winters (2002) and Winters, de Janvry, & Sadoulet (2001) . Not only does this approach seem to be generally approved but it also fits particularly well the nature of information collected by the PSF survey. We first define two types of networks: family networks and community networks. Subsequently both kind of networks are disaggregated further by their destination content (Africa versus out of Africa), and community networks are decomposed into historic and current migration networks.
Household networks variables account for the migration history of the household. They are based on the presence of return migrants in the surveyed households. Two household networks dummy variables are created to account for the two broad destinations migrants can choose: the first dummy variable equals one when at least one member of the household returned from an African country and the second dummy variable equals one when at least one member of the household returned from a non-African country.
At the community level, the construction of networks variables exploits the design of the survey as follows: Remember that the sampling process led to the drawing of 150 clusters in each of which 12 households were randomly drawn to be interviewed. For each household, community networks variables thus summarize information on migrants in the 11 other surveyed households from the same cluster. Two strong assumptions are needed: First it is assumed that surveyed households can be considered representative of their census districts, in spite of a serious concern about the small number of surveyed households in each census district. Indeed, a measurement error depending on the size of clusters (which varies from 25 to 400 households with an average
of 100) arise from the use of survey data to construct community networks variables. Though the bias generated is well known as attenuation bias, in a non-linear regression framework with multiple covariate we have a priori no clue about the magnitude and direction of the bias (Bound et al., 2007; Stefanski, Buzas, & Tosteson, 2005). The second assumption is that census districts do correspond to actual communities, implying for example that social relationships exist between individuals and households living in the same census districts. For lack of migration data at the community level, above discussed community networks variables are nevertheless considered acceptable proxies for community networks.
Two sets of networks variables are thus defined at the community level to take into account both past and current migration facts9. For a given household the historic community networks variable is defined as the sum of the number of return international migrants over the 11 other households from the same cluster. Similarly current migration networks variables at the community level are defined as the total number of current migrants to Africa on the one hand, and out of Africa on the other hand, in other surveyed households from the same census district.
9
After testing for different specification the decomposition according to destination (within Africa or out of Africa) was not retained for historic community networks, since it did not seem to supply enough information to make up for the cost of adding one more variable in the model
T able 3: F amily and comm unit y net w orks at the household lev el (1) (2) (3) (4) (5) Households H ouseholds Households Ho useholds All with Migran t s with Migran ts test with Migran ts without test Households Units in Africa out of Africa (1)-(2) Migran ts (3)-(4) Num b er of observ ations (households) 81 108 186 1530 1716 P ercen tage of total 4.8 5.8 10.3 89.7 1 00 Migration and net w orks Curren t migran ts Num b er of migran ts 1.34 1.41 1.36 0 -0.16 Historic mi gran ts (net w orks) F ormer migran ts, Africa % 27.4 11.1 *** 17.8 7.0 *** 8.1 F ormer migran ts, out of Africa % 3.4 12.5 *** 8.6 1.9 *** 2.6 Comm unit y net w orks Num b er of curren t migran ts, Africa 1.6 1.0 ** 1.3 0.7 *** 0.7 Curren t migran ts, Africa % 60.9 38.7 *** 48.6 34.2 *** 35.7 Num b er of curren t migran ts, out of Africa 1.1 1.3 1.2 0.8 *** 0.8 Curren t migran ts, out of Africa % 48.9 55.1 53.0 41.6 ** 42.8 Historic m igran ts % 82.4 71.0 * 75.6 60.2 *** 61.8 Num b er of former migran ts 2.9 2.5 2.6 2.1 *** 2.1 T ests of e q ua lit y of the means b et w een households wi th migran ts in Africa and households with migran ts out of Africa on the one hand, and b et w een households with and with out migran ts on the other hand are obtained from an adjusted W ald test. Means are found to b e differen t at the follo wing significance lev els : ∗ p < 0 .10, ∗∗ p < 0 .05, ∗∗∗ p < 0 .01 Sour ce : PSF Data collected in 2006.
Descriptive statistics for household and community migration networks are presented in table 3. Community networks can take different values for households living in the same com-munity since they are based on the total number of migrants in all surveyed households in the community minus their own contribution. Not suprisingly households migration networks in Africa are significantly higher for households with migrants in Africa and households with migrants out of Africa have larger networks out of Africa. But distribution of networks accord-ing to the destination of migrants is not perfectly symmetrical: the proportions of households with former migrants returned from a non-African country and from Africa are very close for households currently participating in migration out of Africa (11.1 and 12.5%), whereas more than a quarter of households with current migrants in Africa have historic networks in Africa and only 3.4% of them have historic networks out of Africa. Historic connections with Africa are thus more evenly distributed than historic networks out of Africa.
5
Multivariate Analysis and Discussion
5.1 Regression Results
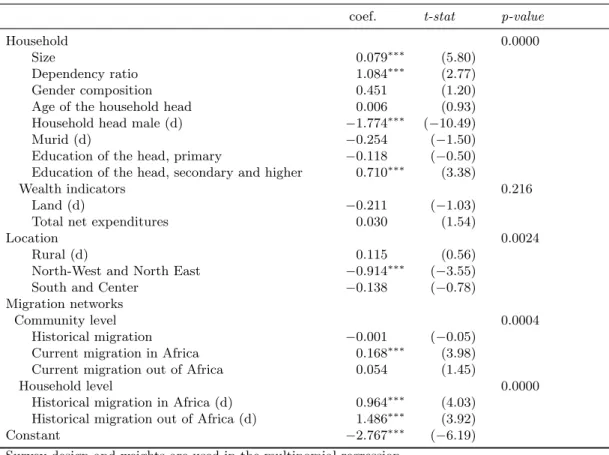
At first, households and individuals are considered to be faced with the choice of whether to participate in international migration or not. The migration decision is thus modelled as a binary output using a logistic regression model. Results of the household level regression are presented in table 410.
10Binary logit results at the individual level are very similar to results shown in table 4, and are therefore not
Table 4: Migration decision : household logistic regression model
Logistic regression
Number of observations=1707 Participate versus non participate in migration coef. t-stat p-value
Household 0.0000
Size 0.079∗∗∗ (5.80)
Dependency ratio 1.084∗∗∗ (2.77) Gender composition 0.451 (1.20) Age of the household head 0.006 (0.93) Household head male (d) −1.774∗∗∗
(−10.49)
Murid (d) −0.254 (−1.50)
Education of the head, primary −0.118 (−0.50) Education of the head, secondary and higher 0.710∗∗∗ (3.38)
Wealth indicators 0.216
Land (d) −0.211 (−1.03)
Total net expenditures 0.030 (1.54)
Location 0.0024
Rural (d) 0.115 (0.56)
North-West and North East −0.914∗∗∗
(−3.55) South and Center −0.138 (−0.78) Migration networks
Community level 0.0004
Historical migration −0.001 (−0.05) Current migration in Africa 0.168∗∗∗ (3.98) Current migration out of Africa 0.054 (1.45)
Household level 0.0000
Historical migration in Africa (d) 0.964∗∗∗ (4.03) Historical migration out of Africa (d) 1.486∗∗∗ (3.92)
Constant −2.767∗∗∗ (−6.19)
Survey design and weights are used in the multinomial regression (d) indicates dummy variables
p-value for groups of variables are obtained from an adjusted Wald test
∗
p < 0.10,∗∗ p < 0.05,∗∗∗ p < 0.01 Source: PSF Data collected in 2006.
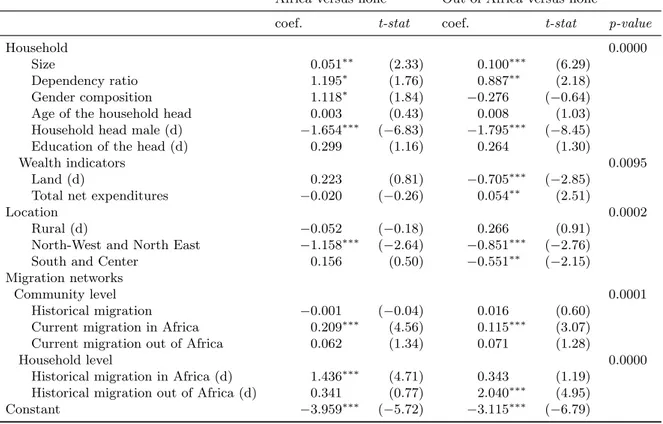
Subsequently, following Davis et al. (2002), a multinomial logit regression model is used to represent the migration decision taking into account the two broad destinations migrants can choose. Migrants or migrant households are considered to take the decision whether to participate in migration to Africa, to participate in migration out of Africa, or not participate in international migration at all. The three options being unordered, the multinomial logit regression model is best suited. A Hausman test has been conducted and does not lead to reject the assumption of independence of irrelevant alternatives (IIA)11. Results of the estimation
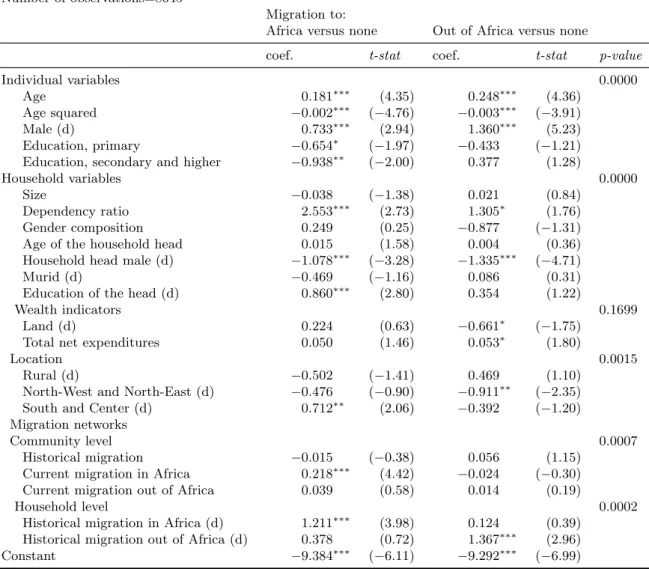
of this model (at both individual and household level) are shown in table 5 and 612. In both tables, the two columns show results for the alternatives “participate in migration in Africa” and “participate in migration out of Africa”, relative to the third option, that is, not to participate in international migration. Table 5 presents a regression model adapted to the individual dataset and incremented with individual variables.
Household composition, wealth, human capital and location variables
The main findings for the non-networks variables are first discussed here. Results mostly con-firm what summary statistics suggested as regards household composition, physical capital and location variables. Among household composition variables, household size—including migrant members—is positively and significantly related with the participation in migration. Similarly, the coefficient on the dependency ratio is also positive and significant at the 1% level, implying a positive correlation between the share of dependents relative to members of the household of active age and the participation in migration. Conversely, the fact that the household is headed by a man is unsuprisingly negatively correlated with the probability that the household participate in migration. Reverse causality may explain this result since when the male house-hold head is abroad, the househouse-hold tends to be more frequently headed by his wife. As can be seen in table 4, households whose head have at least some secondary education are more likely to participate in migration. Due to small cells issues, the variable for the education of the household head in the multinomial logit model is a dummy variable taking the value 1 when
11In both household and individual regression model, when either migration in Africa, migration out of Africa
alternatives, or no-migration alternatives are dropped, Hausman tests show that IIA assumption holds. For more robustness alternative regression models using multinomial probits were also run. Up to a scale factor, similar results were found.
12
In all regressions the survey design is taken into account, observations are weighted using survey weights, and residuals are allowed to be correlated whithin clusters: standard errors are clustered by district for household level regressions and by household for individual regressions.
Table 5: Migration decision : household multinomial logit regression model
Multinomial logit regression Number of observations=1707
Migration to:
Africa versus none Out of Africa versus none
coef. t-stat coef. t-stat p-value
Household 0.0000
Size 0.051∗∗ (2.33) 0.100∗∗∗ (6.29) Dependency ratio 1.195∗ (1.76) 0.887∗∗ (2.18) Gender composition 1.118∗ (1.84) −0.276 (−0.64) Age of the household head 0.003 (0.43) 0.008 (1.03) Household head male (d) −1.654∗∗∗
(−6.83) −1.795∗∗∗
(−8.45) Education of the head (d) 0.299 (1.16) 0.264 (1.30)
Wealth indicators 0.0095
Land (d) 0.223 (0.81) −0.705∗∗∗
(−2.85) Total net expenditures −0.020 (−0.26) 0.054∗∗ (2.51)
Location 0.0002
Rural (d) −0.052 (−0.18) 0.266 (0.91) North-West and North East −1.158∗∗∗
(−2.64) −0.851∗∗∗
(−2.76) South and Center 0.156 (0.50) −0.551∗∗ (−2.15) Migration networks
Community level 0.0001
Historical migration −0.001 (−0.04) 0.016 (0.60) Current migration in Africa 0.209∗∗∗ (4.56) 0.115∗∗∗ (3.07) Current migration out of Africa 0.062 (1.34) 0.071 (1.28)
Household level 0.0000
Historical migration in Africa (d) 1.436∗∗∗ (4.71) 0.343 (1.19) Historical migration out of Africa (d) 0.341 (0.77) 2.040∗∗∗ (4.95) Constant −3.959∗∗∗ (−5.72) −3.115∗∗∗ (−6.79) Survey design and weights are used in the multinomial regression
(d) indicates dummy variables
p-value for groups of variables are obtained from an adjusted Wald test.
∗
p < 0.10,∗∗ p < 0.05,∗∗∗ p < 0.01 Source: PSF Data collected in 2006.
Table 6: Migration decision : individual multinomial logit regression model
Multinomial logit regression Number of observations=8645
Migration to:
Africa versus none Out of Africa versus none
coef. t-stat coef. t-stat p-value
Individual variables 0.0000 Age 0.181∗∗∗ (4.35) 0.248∗∗∗ (4.36) Age squared −0.002∗∗∗ (−4.76) −0.003∗∗∗ (−3.91) Male (d) 0.733∗∗∗ (2.94) 1.360∗∗∗ (5.23) Education, primary −0.654∗ (−1.97) −0.433 (−1.21) Education, secondary and higher −0.938∗∗ (−2.00) 0.377 (1.28)
Household variables 0.0000
Size −0.038 (−1.38) 0.021 (0.84)
Dependency ratio 2.553∗∗∗ (2.73) 1.305∗ (1.76) Gender composition 0.249 (0.25) −0.877 (−1.31) Age of the household head 0.015 (1.58) 0.004 (0.36) Household head male (d) −1.078∗∗∗
(−3.28) −1.335∗∗∗
(−4.71) Murid (d) −0.469 (−1.16) 0.086 (0.31) Education of the head (d) 0.860∗∗∗ (2.80) 0.354 (1.22)
Wealth indicators 0.1699
Land (d) 0.224 (0.63) −0.661∗
(−1.75) Total net expenditures 0.050 (1.46) 0.053∗ (1.80)
Location 0.0015
Rural (d) −0.502 (−1.41) 0.469 (1.10) North-West and North-East (d) −0.476 (−0.90) −0.911∗∗ (−2.35) South and Center (d) 0.712∗∗ (2.06) −0.392 (−1.20) Migration networks
Community level 0.0007
Historical migration −0.015 (−0.38) 0.056 (1.15) Current migration in Africa 0.218∗∗∗ (4.42) −0.024 (−0.30) Current migration out of Africa 0.039 (0.58) 0.014 (0.19)
Household level 0.0002
Historical migration in Africa (d) 1.211∗∗∗ (3.98) 0.124 (0.39) Historical migration out of Africa (d) 0.378 (0.72) 1.367∗∗∗ (2.96)
Constant −9.384∗∗∗
(−6.11) −9.292∗∗∗
(−6.99) Survey design and weights are used in the multinomial regression
(d) indicates dummy variables
p-value for groups of variables are obtained from an adjusted Wald test.
∗
p < 0.10,∗∗ p < 0.05,∗∗∗ p < 0.01 Source: PSF Data collected in 2006.
the head has at least some primary education. When primary education and higher levels of education are aggregated, the coefficient on the education of the head variable remains positive but is not significant any more except for African destinations in the multinomial logit model at the individual level (see table 6). Neither the age of the head nor the murid dummy variable are significant13. Household composition effects are found to be robust across specifications and similar whatever the destination. Note however that household size is not significantly correlated with migration in the multinomial logit regression at the individual level.
Coefficients on physical capital variables are not found to be jointly significant in any of the three regressions. However the coefficient on the expenditures variable (defined as the logarithm of per capita annual expenditures) used as a proxy for household income, is found significant, for migration out of Africa only, in the multinomial logit regressions. It means that there is a pos-itive relationship between wealth measured by expenditures and the participation in migration out of Africa. One may interpret this result as indicating that richer households are more likely than poorer to participate in costly international outmigration. But such an interpretation is not the only one allowed by our specification, since wealth is highly endogenous with regard to migration by means of remittances, even after deduction of the expenditures directly taken care of by migrants. Alternative interpretations could be that the income generated by migration to European or American countries increases the expenditures of migrant households through remittances in a way that is not accurately taken into account here, or that migration to high income countries enhances through remittances and investments the ability of households to receive a higher income at home.
Sex, age and education variables are included in the individual multinomial logit whose re-sults are shown in table 5. Not suprisingly, the probability to migrate is a quadratic function of age, increasing with age up to a turning point at around 39 years of age for both destinations. Being a man increases by respectively 2.1 and 3.6 the probability that an individual migrate to an African country and a non-African country, holding all other independent variables constant. As for education, adults with some primary education do not migrate more than those with no education at all. But highest levels of education (secondary and higher) are positively corre-lated with the probability that an individual migrate out of Africa and negatively correcorre-lated
13This result, despite having to be considered cautiously due to the small number of observations, is interesting
considering the vast litterature on Murid migration networks. According to our results, Murid do not migrate more than other Senegalese.
with the probality to migrate within Africa. This latter result is consistent with the findings of the migration literature: the cost of entry into international migration is even higher for migration to Europe and the United-States, which could favor emigrants with a greater educa-tional background. Conversely, returns to education are expected to be higher at home than in another African country, which explains why Senegalese whith higher levels of education have a lower probabilty to migrate to African countries.
As for location variables, due to the small proportion of households and migrant households located the regions of Saint-Louis, Matam and Tambacounda, regional dummies are aggregated in three categories. The reference category for regional dummies is the Dakar region. Negative coefficient on the “North-West and North-East” variable shows that, all else equal, households located in the regions of Louga, Saint-Louis, Matam and Tambacounda, in spite of the fact that the latter two include the upper Senegal river valley kwnown as a major emigration area, are less likely to have migrants than households located in Dakar. This latter finding is not much suprising since most international migrants going to Europe, whatever their geographical origin, first move to Dakar before leaving the country.
Networks variables
Results of the binary logit regression in table 4 suggest that all network variables except historic community networks are positively correlated with the probability that households participate in international migration, though not significantly for current community networks out of Africa. Moreover effects are larger for family networks: having one more person in its community network in Africa multiplies by 1.2 the probability to participate in migration, but all else equal and all other variables taken at their mean value, the same probability is multiplied by 2.6 when households have former migrant members back from Africa (historic household network)14.
Multinomial logit regressions run at both household and individual levels allow to go into networks correlation with the probability to migrate according to the destination. Two unequiv-ocal results stand out in tables 4 and 5: First, at the household level, as expected, networks seem to be destination-specific. The dummy for the presence of former migrants to Africa in the household is positively related to the probability to have current migrants in Africa, whereas
14
Part of the difference in scale between the two coefficients could be explained by a measurement error bias, as explained above.
the dummy for former migrants out of Africa is positively related to the probability for the household of participating in migration out of Africa. Interpreting these results in terms of relative risk ratios for household level regression (table 4), means that having a former migrant to Africa back in the household increases by a factor of 4.2 the probability for the household to participate in current migration to Africa. Similarly having a former migrant to a non-African country increases by 7.9 the probability for a household to participate in migration out of Africa. Conversely, having household networks in Africa is not correlated with a greater participation in migration out of Africa, and vice versa.
Second, conversely, community networks do not appear to be destination-specific (see ta-ble 4) Anyhow, it is noteworthy that at the household level the variata-ble for community networks in Africa is positively correlated with both probabilities to participate in migration in and out of Africa, while community networks out of Africa variables have no significant impact on any of these probabilities, even on the probability that households have a migrant out of Africa. 15.
Table 7: Community networks and family networks: complements or substitutes?
Logistic regression
Number of observations=8645 (individuals) Participate versus non participate in migration coef. t-stat p-value
Migration networks 0.0001
Community level
Historical migration 0.004 (0.14) Current migration in Africa (d) 0.557∗∗∗ (2.39) Current migration out of Africa (d) 0.552∗∗ (2.25) Household level
Historical migration (d) 1.704∗∗∗ (4.68) Community current migration Africa (d) X
Household historical migration (d) −0.527 (−1.29) Community current migration out of Africa (d) X
Household historical migration (d) −0.988∗∗ (−2.36)
Controls yes
Constant −9.212∗∗∗
(−8.96) Survey design and weights are used in the multinomial regression
(d) indicates dummy variables
Controls included are individual and household non-networks variables figuring in table 3
∗
p < 0.10,∗∗ p < 0.05,∗∗∗ p < 0.01 Source: PSF Data collected in 2006.
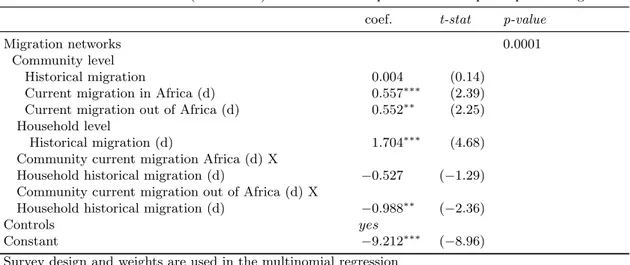
The relationship between community and household migration networks is investigated fur-ther by introducing interaction terms between both types of networks. The relatively small number of observations in the subsample does not allow to explore interactions between
house-15Note however that in the individual regression this latter correlation is no more significantly different from
hold and community level network variables and at the same time break down migrants des-tination into African and non-African countries. In order to get round small cells problems a new household network dummy variable is thus constructed taking the value one when the household has one or more former international migrant back either from Africa or from a non-African country. Interactions between this new variable for household network and the two above defined community variables for current migration networks are explored in a binary logit model run on individual data. Results are shown in table 6. However, unlike in linear models interpretation of coefficients on interacted variables in logistic models is not straightforward. Both the sign and the significance of the interaction terms vary with the values attributed to all other covariates16.
In order to get round this difficulty, counterfactuals are built for specific subpopulations, basing on the regression shown in table 7. Consider the interaction between the family networks and the community networks in Africa variables: first the subsample of individuals with none of these networks (5303 observations) is isolated. Their estimated probability to migrate is 1.42% . Then, this probability is compared to the mean of the predicted probability to migrate for individual from this specific subsample, if they had community networks in Africa. The prob-ability for this counterfactual is 2.15%, which amounts to a 66% increase. If these individuals had family networks instead, their probability to migrate would be 3.36%. Then, had they in addition community networks, the predicted probability to migrate would jump to 4.98%. The transition between these latter two counterfactuals increases the predicted probability to mi-grate by 48%. Therefore having community networks in Africa increases more the probability to migrate for individuals without family networks than for those endowed with family networks. This result thus suggests that household network and community network in Africa are partly substitutable17. As concerns the relationship between family networks and community networks
out of Africa, the same exercise shows no difference in increase in predicted probabilities to mi-grate depending on the availability of household networks. Household network and community network out of Africa thus seem to have no interaction.
To sum up, results presented above seem to imply first that migration networks at the household level have a greater positive influence on the probability to migrate than community
16See Norton, Wang, & Ai (2004). 17
Note that the predicted probabilities to migrate for each constructed counterfactual are very close to the predicted probabilities for the true subpopulations, which reinforces the credibility of the results.
networks, which is consistent with the above mentioned distinction between “strong” and “weak” ties. It is agreed that while information can be provided by community networks, direct financial assistance is more likely to be given to the would-be migrant by members of the same household. Second, migration networks at the household level appear to be destination specific in the sense that having family networks in Africa does not affect the decision to participate in migration out of Africa, and vice versa. Third, having access to community networks in Africa is positively related with the probability that a household participate in migration whatever the destination chosen. Empirical evidence indeed suggest that migrants to Northern countries often pass in transit through African countries before reaching their final destination. In such a perspective, migrants from the same community settled in an African country may turn out to be major assets in a migration strategy intended to reach Europe. Fourth, commmunity networks, in Africa only, are found to be partial substitutes for household networks which means that the former type of networks is relatively more useful to help migrate individuals that do not benefit from family networks than those who are already endowed with family networks.
5.2 Exploring Heterogeneity in Networks Effects: Gendered Migration
Pat-terns?
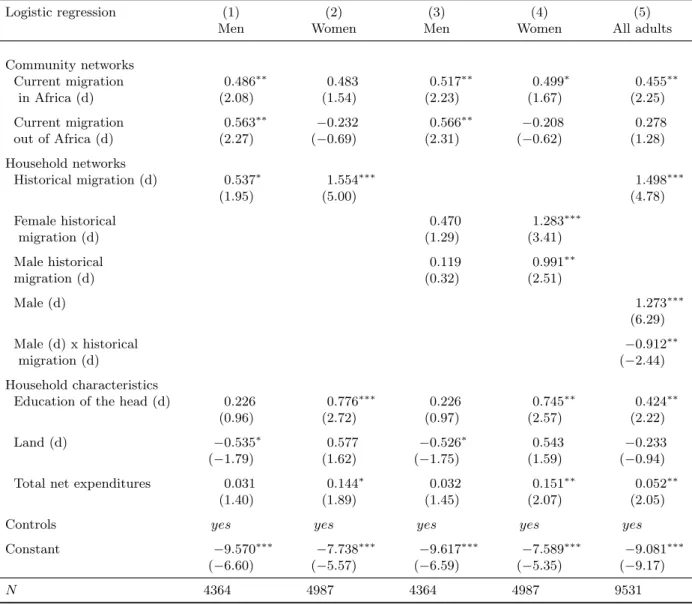
In order to go further into the description of migration, heterogeneities in networks effects depending on gender are investigated. Since the male dummy variable seems to be a key deter-minant of migration, it is interesting to explore whether family networks tend to amplify such a gender bias in migration, or instead, whether networks act as substitutes of such individual characteristics facilitating migration. Indeed, within the household do women benefit from fam-ily networks more than men ? There is a priori no reason why household networks would affect the same way all members of a given household. Gender issues are thus investigated using logit regressions results shown in table 8.
In the first four columns of table 8, logistic regressions are run separately for men and women. First it is interesting to note that none of the two community network variables sig-nificantly affects the probability of women to migrate whereas both are sigsig-nificantly correlated with a higher probability to migrate for men (column one and two). Conversely, the coeffi-cient on the household network variable is higher and more significant for women than for men.
Table 8: Gender issues: logistic regressions at the individual level
Logistic regression (1) (2) (3) (4) (5) Men Women Men Women All adults
Community networks Current migration 0.486∗∗ 0.483 0.517∗∗ 0.499∗ 0.455∗∗ in Africa (d) (2.08) (1.54) (2.23) (1.67) (2.25) Current migration 0.563∗∗ −0.232 0.566∗∗ −0.208 0.278 out of Africa (d) (2.27) (−0.69) (2.31) (−0.62) (1.28) Household networks Historical migration (d) 0.537∗ 1.554∗∗∗ 1.498∗∗∗ (1.95) (5.00) (4.78) Female historical 0.470 1.283∗∗∗ migration (d) (1.29) (3.41) Male historical 0.119 0.991∗∗ migration (d) (0.32) (2.51) Male (d) 1.273∗∗∗ (6.29) Male (d) x historical −0.912∗∗ migration (d) (−2.44) Household characteristics
Education of the head (d) 0.226 0.776∗∗∗ 0.226 0.745∗∗ 0.424∗∗ (0.96) (2.72) (0.97) (2.57) (2.22) Land (d) −0.535∗
0.577 −0.526∗
0.543 −0.233 (−1.79) (1.62) (−1.75) (1.59) (−0.94) Total net expenditures 0.031 0.144∗ 0.032 0.151∗∗ 0.052∗∗
(1.40) (1.89) (1.45) (2.07) (2.05)
Controls yes yes yes yes yes
Constant −9.570∗∗∗ −7.738∗∗∗ −9.617∗∗∗ −7.589∗∗∗ −9.081∗∗∗
(−6.60) (−5.57) (−6.59) (−5.35) (−9.17)
N 4364 4987 4364 4987 9531
t statistics in parentheses
Controls included are age and age squared, household size and composition variables, sex and age of the head and geographical controls
∗
p < 0.10,∗∗ p < 0.05,∗∗∗p < 0.01 Source: PSF Data collected in 2006.
Subsequently, in the next two columns, family networks are disaggregated depending on their gender composition into female and male networks. Very interestingly, female migration is pos-itively correlated with both gendered family networks. Once disaggregated, on the contrary, family networks are not found to significantly affect men’s probability to migrate. In addition, a selection of non networks variables are shown in table 8. Separate regressions on male and female subsamples emphasize a number of differences in male and female migration patterns. On the one hand, indeed, when the head of the household has at least some primary education, women are found to be more likely to migrate whereas this positive correlation is not significant for men. On the other hand, wealth variables do not symmetrically affect men’s and women’s probability to migrate: female migrants are more likely to come from richer households, and men are less likely to migrate when the household has land assets.
In column five, the male dummy variable is interacted with the aggregate household networks dummy variable in order to study whether family networks are more useful to men or women. While the male dummy and the household historical migration dummy are both positively cor-related with the probability to migrate, the coefficient on their interaction term is negative and significant, suggesting a substitution effect between being a male and having family networks. Nevertheless, as noted earlier, such an interpretation is not allowed in a non-linear framework. Thus potentially differential family networks effects depending on gender can be studied with the help of counterfactuals. The estimated probability to migrate for female adults with no family networks is 1.18%. Had these women benefited from family networks, this estimated probability would be multiplied by 2.4 (2.83%). Had they been men without networks instead, all their other characteristics being unchanged, their estimated probability would be 3.07%. Finally, had they in addition benefited from family networks, this latter estimated probability to migrate would be multiplied by 2.28 (7.00%). The comparison between the estimated prob-abilities to migrate for these counterfactuals suggests that household networks may be slightly more efficient for women than for men. Nevertheless the difference is definitely not large enough to be considered statistically reliable. Therefore, female migrations are found to rely more on household networks and less on community networks. This finding is consistent with the fact that a non negligible share of female migrants move in order to get married. A more general interpretation could be that the first element of the family migration chain is most probably a
man, and it is only once the chain exists that female migration occurs.
Heterogeneities in community networks’ effects depending on households’ characteristics were also tested. Among these characteristics were relative wealth variables18, household de-mographic structure and the presence of extended family, land assets or the education of the household head. None of these characteristics was found to be correlated with community net-works effects. This finding allows for at least two interpretations, leaving aside the causality issue dealt with in the discussion below. In the first interpretation community networks are equally available and useful to all households whatever their characteristics. A second interpre-tation could be that none of the variables interacted with network variables adequately measures potential discriminations in households’ access to community networks19.
5.3 Discussion
As noted above, problems of interpretation arise from the use of cross-sectional data. A positive correlation between networks and current migration can be interpreted in a causal way by stating that migrant networks have a positive impact on migration. But one could also argue that both networks and migration choices at the household level are caused by a third unobserved variable, say preferences of the household. If panel data were available, this issue could be partially addressed, for example by introducing household fixed-effects into the initial regression model. Moreover the two populations — in Africa and out of Africa— of migrants and migrant households differ a lot on a number of observable characteristics such as wealth proxied by the per capita amount of expenditures or education. One may infer from that statement that the two subsamples also differ on a number of unobservable characteristics. In particular, why not imagine a story where Senegalese households differ in their preference for risk. Migration is a lucrative but high-risk strategy. Nevertheless, among the destinations that are available to emigration candidates, European or American countries are associated with higher expected gains but also higher risk. Thus one may consider that among households and individuals
18The relative wealth variable tested here is a dummy variable that equals one when household expenditures are
above a poverty line set at the median of the distribution of annual per capita expenditures in all 12 households surveyed in the same cluster. In addition, different poverty lines were tested ranging from the 25th to the 80th percentiles.
19
For example, although caste is a taboo subject and could not be adressed in the questionnaire of the survey, empirical observations tend to suggest that in Senegal, at least in some ethnic groups, the social structure is based on a still effective caste hierarchy.
deciding to participate in international migration, those which are more risk-averse choose African destinations instead. This could explain why households with migrants that returned from an African country are more likely to have current migrants in an African country : what could at first sight be interpreted as a causal positive effect of networks on migration would be the consequence of different preferences that explained migration choices in the past and continue to explain migration strategies today.
Indeed another flaw results from the impossibility to identify the real impact of community networks by differenciating it from the impact of other variables at the community level that would positively influence past as well as current migration at the community level. But prefer-ences could be positively correlated among communities as well. A reason for that could be the endogeneity of community formation, but this correlation might also be driven by unobservable variables operating at the community level. A so-called community networks effect is thus as questionable as household networks effects, and for the same reasons causal interpretations may be ruled out.
But more puzzling if one does not believe the networks story is the interpretation of the pos-itive correlation between the current community networks in Africa variable and the probability to participate in migration, whether in Africa or out of Africa. Last but not least, networks are found to be correlated with a higher increase in the probability to migrate for women than for men within the same household. The networks story is particularly suited to explain these het-erogeneities: networks are more useful to those lacking other or better forms of socioeconomic assets. Both of these findings allow us to be slightly more confident about the networks story.
6
Conclusion
Thanks to a new nationally representative dataset, this paper is primarily intended to contribute to a better understanding of Senegalese migration networks and their impact on migration. Exploiting the features of the survey, migration networks are decomposed into community and household networks, but also according to their destination — African countries and non-African countries — and gender contents.
Modelling the migration decision either at the household level or at the individual level as a binary choice, it is shown that household networks seem to have a more positive influence
on migration decisions than community networks. Subsequently the migration decision is rep-resented as a multiple options choice, accounting for the two broad destinations migrants can choose. Results from the multinomial logistic regressions show that household networks are doubtlessly destination specific. On the contrary, the impact of community networks does not seem to be destination specific. A positive correlation is observed between the availability of current community networks in Africa and the probability to migrate, whatever the destina-tion, and no or weak impact of community networks out of Africa on the relative probability to migrate. Anyhow, all regression results suggest that besides an obvious path-dependency of migration choices and the geographical specificity of migratory careers, family networks may have a greater influence on faraway migrations whereas community networks would play a more important role for migrations within Africa.
Separate regressions for men and women reveal the existence of gendered migration patterns. Very interestingly, family networks, whatever their gender content, seem to affect more positively and significantly female than male migration. Conversely, unlike men, women’s probability to migrate is not higher when community networks out of Africa are available.
However, due to endogeneity and unobserved heterogeneity problems, no causal inference can relevantly be drawn from above documented correlations. Panel data would be a plus in a further examination of networks and migration issues aimed at identifying the proper influence of networks on migration.
References
Adams, A.: Le long voyage des gens du fleuve, Paris: Fran¸cois Maspero, 1977.
Aguilera, M. B., & Massey, D. S.: Social capital and the wages of Mexican migrants: New hypotheses and tests, Social Forces, 82(2), (2003), 671–701.
Barou, J.: Les immigrations africaines en France au tournant du si`ecle: Africains d’ici et de l`a-bas, Hommes et migrations, 1239, (2002), 6–18.
Bauer, T., Epstein, G., & Gang, I. N.: Herd effects or migration networks? The location choice of Mexican immigrants in the U.S., IZA Discussion Paper Series 551, 2002.
Bava, S.: De la “baraka aux affaires”: ethos ´economico-religieux et transnationalit´e chez les migrants s´en´egalais mourides, Revue Europ´eenne des Migrations Internationales, 19(2), (2003), 69–84.
Bound, J., Brown, C., & Mathiowetz, N.: Measurement error in survey data, in J. J. Heckman, & E. Leamer (Eds.), Handbook of Econometrics, vol. 5, chap. 59, (pp. 3705–3843), Elsevier, 2007.
Bredeloup, S.: La Diams’pora du fleuve S´en´egal, Presses universitaires du Mirail, IRD Editions, 2007. Carrington, W. J., Detragiache, E., & Vishwanath, T.: Migration with endogenous moving costs, The
American Economic Review, 86(4), (1996), 909–930.
Clark, A. F.: Internal migrations and population movements in the Upper Senegal Valley (West Africa), 1890-1920, Canadian Journal of African Studies/Revue Canadienne des Etudes Africaines, 28(3), (1994), 399–420.
Cornelius, W., Martin, P., & Hollifield, K. (Eds.): Controlling Immigration: A Global Perspective, Stanford, Californie: Stanford University Press, 1994.
Curran, S., & Rivero-Fuentes, E.: Engendering migrant networks: The case of Mexican migration, Demography, 40(2), (2003), 289–307.
Davis, B., Stecklov, G., & Winters, P.: Domestic and international migration from rural Mexico: Dis-aggregationg the effects of network structure and composition, Population Studies, 56(3), (2002), 291–309.
Davis, B., & Winters, P.: Gender, networks and Mexico-US migration, Journal of Development Studies, 38(2), (2001), 1–26.
de Haas, H.: The myth of invasion: The inconvenient realities of African migration to Europe, Third World Quarterly, 29(7), (2008), 1305–1322.
DeVreyer, P., Lambert, S., Safir, A., & Sylla, M.: Pauvret´e et Structure Familiale: Pourquoi une nouvelle enquˆete ?, Stat´eco, 102.
Dia, H.: Espaces domestiques, espaces villageois, espaces urbains multi-situ´es. Cinquante de migrations `a partir de la moyenne vall´ee du fleuve S´en´egal (1960-2010), Ph.D. thesis, University of Paris V, 2009. Elia, A.: Les Foulb´e de la vall´ee du S´en´egal en Italie, Paris: L’Harmattan, 2006.
Granovetter, M.: The strength of weak ties: A network theory revisited, Sociological Theory, 1, (1983), 201–233.
Grasmuck, S., & Pessar, P.: Between Two Islands: Dominican International Migration, Berkeley: Uni-versity of California Press, 1991.
Grieco, E. M.: The effects of migration on the establishment of networks: Caste disintegration and reformation among the Indians of Fiji, International Migration Review, 32(3), (1998), 704–736.
Guilmoto, C. Z.: Institutions and migrations. short-term versus long-term moves in rural West Africa, Population Studies, 52(1), (1998), 85–103.
Harris, J. R., & Todaro, M. P.: Migration, unemployment and development: A two-sector analysis, The American Economic Review, 60(1), (1970), 126–142.
Massey, D. S.: The social organization of Mexican migration to the United States, Annals of the American Academy of Political and Social Science, 487, (1986), 102–113.
Massey, D. S., & Espinosa, K. E.: What’s driving Mexico-U.S. migration? A theoretical, empirical, and policy analysis, The American Journal of Sociology, 102(4), (1997), 939–999.
Mboup, M.: Les S´en´egalais d’Italie, Paris: L’Harmattan, 2001.
McKenzie, D., & Rapoport, H.: Self-selection patterns in Mexico-U.S. migration: The role of migration networks, World Bank Policy Research Working Paper 4118.
Moretti, E.: Social networks and migrations: Italy 1876-1913, International Migration Review, 33(3), (1999), 640–657.
Ndione, B., & Lalou, R.: Tendances r´ecentes des migrations internationales dans le s´en´egal urbain : existe-t-il une dynamique de quartiers ?, in Colloque international AIDELF, Les migrations interna-tionales : Observation, analyse et perspectives, Budapest, Hungary, 2005.
Norton, E. C., Wang, H., & Ai, C.: Computing interaction effects and standard errors in logit and probit models, The Stata Journal, 4(2), (2004), 154–167.
Sjaastad, L. A.: The costs and returns of human migration, Journal of Political Economy, 70(4), (1962), 80–93.
Stark, O.: The Migration of Labor, Blackwell, 1991.
Stefanski, L., Buzas, J., & Tosteson, T. D.: Measurement error, in W. Ahrens, & I. Pigeot (Eds.), Handbook of Epidemiology, chap. 2.5, (pp. 729–765), Springer, 2005.
Winters, P., de Janvry, A., & Sadoulet, E.: Family and community networks in Mexico-U.S. migration, The Journal of Human Resources, 36(1), (2001), 159–184.