HAL Id: halshs-00689460
https://halshs.archives-ouvertes.fr/halshs-00689460
Preprint submitted on 19 Apr 2012
HAL is a multi-disciplinary open access archive for the deposit and dissemination of sci-entific research documents, whether they are pub-lished or not. The documents may come from teaching and research institutions in France or
L’archive ouverte pluridisciplinaire HAL, est destinée au dépôt et à la diffusion de documents scientifiques de niveau recherche, publiés ou non, émanant des établissements d’enseignement et de recherche français ou étrangers, des laboratoires
Migration Networks in Senegal
Isabelle Chort
To cite this version:
WORKING PAPER N° 2012 – 17
Migration Networks in Senegal
Isabelle Chort
JEL Codes: F22, J61, O15
Keywords: Migration ; Migrant Networks ; Senegal
P
ARIS-
JOURDANS
CIENCESE
CONOMIQUES48, BD JOURDAN – E.N.S. – 75014 PARIS TÉL. : 33(0) 1 43 13 63 00 – FAX : 33 (0) 1 43 13 63 10
Migration Networks in Senegal
Isabelle Chort∗November 14, 2011
Abstract
This paper investigates the importance and role of migration networks in Senegal using a new nationally representative survey conducted in 2006-2007. Using a sample of 1707 Senegalese households I explore potentially differential effects of networks on international migration depending on their characteristics in terms of composition and destination. Re-sults from logit and multinomial logit regressions show that household networks seem to be destination-specific and have a greater positive influence on migration than community networks. Networks also seem to have heterogeneous effects on migration depending on gender, household wealth or size which is consistent with previous findings in the literature and backs up a networks effects story.
Keywords: Migration, migrant networks, Senegal
JEL codes: F22, J61, O15
1
Introduction
Empirical studies on the determinants of migration generally find a large and positive influence
of migration networks on the decision to move and on location choices (Massey, 1986; Massey
and Espinosa, 1997; Davis, Stecklov, and Winters, 2002). Indeed, networks enhance migration
by lowering migration costs and uncertainty. First, networks help reduce migration costs by
providing direct financial assistance to new migrants in the destination country. Second, network
members supply migration candidates with useful information on the destination country, for
example concerning labor market conditions.
∗
Paris School of Economics. Address: 48, Boulevard Jourdan - 75014 - Paris (France), Phone: +33 1 43136364, E-mail: [email protected]
However, the overwhelming majority of quantitative studies on migration networks rely
on data on Mexico-US migration flows, the exceptional quality of available Mexican data on
migration permitting furthermore interesting refinements of networks decomposition and
differ-ential influences (see for example Massey, 1986 ; Massey and Espinosa, 1997; Davis, Stecklov,
and Winters, 2002; Aguilera and Massey, 2003; Bauer, Epstein, and Gang, 2002; Curran and
Rivero-Fuentes, 2003; McKenzie and Rapoport, 2007; Winters, de Janvry, and Sadoulet, 2001).
By contrast very few studies aim at documenting African migration networks, and the main
reason for this may be lack of appropriate data. Having access to an exceptionally rich dataset
from a new nationally representative household survey conducted in Senegal in 2006-2007, I
intend to provide a description of Senegalese outmigrations before investigating the correlations
between migrant networks and the decision to migrate. In line with the migrant networks
literature and in the specific Senegalese context, the four following hypotheses are explored:
First, migrant networks do increase the probability that individuals or households participate
in international migration. Second, the strength of the links between network members matters,
which means that community networks do not play the same role as household networks. Third,
networks are destination-specific and fourth, networks may have heterogeneous impacts, in
particular depending on gender, but also on household income or structure.
This article is divided into six sections. Section II provides a brief overview of Senegalese
mi-grations whereas section III presents the main findings and challenges of the migration networks
literature. The data are presented and described in section IV. Section V uses successively a
logit model to study the role of networks on the decision to migrate, and a multinomial logit
model to examine the issue of destination-specific networks. Moreover the potential
heterogene-ity in networks effects depending on gender, wealth and family structure is investigated, and
alternative interpretation are discussed. The final section presents concluding remarks.
2
Overview of Senegalese International Migrations
Over a population of 12 million, the number of Senegalese living abroad is estimated to between
400,000 and 2 million1. In contrast with a widespread idea, the largest part of them is located
in Africa. Long ignored, West-African migrations have been drawing much political attention
in Europe in the past few years. Migration policies became more restrictive in Europe in
the 1990s (Cornelius, Martin, and Hollifield, 1994) while the media spread a representation of
West-African migrants as invaders of a new kind, threatening the European “fortress” (de Haas,
2007)2. It is thus necessary to put current migratory trends back in their historical context.
Indeed, Senegalese migrations have deep historical roots and current migration flows cannot
be explained without evoking traditions of mobility in Western Africa. The first region of
Senegal to participate in massive international migration is the Senegal river valley adjoining
Mauritania and Mali. Clark (1994) shows the links between current migration flows from this
region and the high mobility characterizing the inhabitants of the valley as far back as
pre-colonial times. Large population movements responded to numerous reasons: environmental,
colonial, religious and historical factors contributed to make the economy of the region depend
on emigration flows. In 1995, according to an International Labour Organization survey (Barou,
2002), migrants’ remittances in this region represented between 30 and 80% of households needs.
But nowadays outmigration concerns all Senegalese regions and ethnic groups.
Senegalese outmigrations developed under the French colonization period. After the
Sec-ond World War and until the end of the 1970s migration of Western-Africans to Europe was
encouraged due to the needs of unskilled workers in Europe. Family reunification policies soon
introduced led to a relative feminization of Senegalese migration flows. In the 1990s,
immigra-tion policies in France and in Europe became more and more restrictive. At the same time
new destination countries emerged, among which Southern Europe countries such as Spain and
Italy attracting mostly unskilled migrants, and Germany, the United Kingdom or even North
America for skilled migrants.
As for migration within Africa, Ghana, Nigeria and Cˆote d’Ivoire successively attracted
Senegalese migrants before embarking on violent anti-immigration policies. Relatively wealthy
countries such as Gabon and the two Congos also became destination countries for Senegalese
migrants, mostly traders. In the 1990s North-African countries experienced an increase in
Sub-Saharan migration flows and became destination countries in themselves as well as transit
countries for migrants en route for Europe.
To the best of my knowledge however no valuable quantitative study of migration
deter-2Indeed, the media and public opinion in Europe tend to focus on illegal migration: see for example the large media coverage of the events of Ceuta and Melilla in 2005 and more recently the numeral stories of canoes trying to reach the Canary Islands coasts.
minants and migration networks on Senegalese data can be found. And yet, a number of
historical, sociological or anthropological case studies on Senegalese migrations document the
importance and functioning of a large variety of migration networks. These networks may be
based on either ethnic or geographic characteristics, or even occupation, or religion. Among
others, Adams (1977) and Guilmoto (1998) provide descriptions of community networks
origi-nating from the Senegal river valley, Ndione and Lalou (2005) on the other hand show evidence
of networks’ impact on migration in the urban context of Dakar. Bredeloup (2007) illustrates
the role of occupational networks on migration in the diamond trade sector. Murid networks
are much documented (see for example Bava (2003)), whereas Elia (2006) or Mboup (2001)
provide detailed analyses of Senegalese migrant networks in a destination country, namely Italy.
In addition, Dia (2009) documents the specialization of households regarding the destination
their migrant members choose and thus provides evidence of the destination-specific aspect of
migration networks.
3
Networks in the Migration Literature
At the micro-level, the reference neoclassical works consider the decision to migrate in a
cost-benefit framework: migration occurs in response to (expected) earnings differentials net of
migration costs accross regions or countries (Sjaastad, 1962; Harris and Todaro, 1970). And
yet, empirical observations tend to support the view of migration as a self-sustaining
network-based process, unrelated with differences in actual or expected incomes in the sending and
receiving countries (Massey, 1986; Moretti, 1999; Carrington, Detragiache, and Vishwanath,
1996). Nevertheless, considering migration costs as a decreasing function of network size allows
the neoclassical migration model to account for this empirical puzzle (Carrington, Detragiache,
and Vishwanath, 1996).
Indeed, most studies concerned about migration networks assess their positive impact on
migration through cost-decreasing effects. First, current migrants can provide direct assistance
to candidates to migration. Such an assistance is not limited to financial aid and can consist
in psychological support as well. Second, current and former migrants are a much valuable
source of information for would-be emigrants. Both channels suggest that migration networks
only to the specific country, region or even city where it is settled. Leaving aside the issue
of whether network effects on migration result in the first place from direct assistance helping
reduce financial costs of migration, or from pure information transfers (Bauer, Epstein, and
Gang, 2002), migrant networks have an unambiguous positive impact on migration.
As for the definition of migrant networks in the related literature, it varies from family
members with a past or current migration experience to the whole group of fellow-countrymen
living in a destination city or country. Most recent studies concerned with migration networks
have dealt with the effects of different networks’ compositions. A first decomposition of
net-works, taken from social networks theory (Granovetter, 1983), has been made between “strong
ties” associated with family networks and “weak ties” relative to community networks (Davis,
Stecklov, and Winters, 2002; Curran and Rivero-Fuentes, 2003; Grieco, 1998). Disaggregating
further family networks according to kinship structure, Davis, Stecklov, and Winters (2002)
show that the stronger the ties, the larger the positive impact of networks on migration. Recent
empirical studies also distinguish networks made of current migrants from networks whose
mem-bers have a past migration experience (Davis, Stecklov, and Winters, 2002; Winters, de Janvry,
and Sadoulet, 2001). Indeed these two types of networks are expected to influence migration
through different channels since current migrants are able to provide direct assistance in the
receiving country and up to date information whereas historic networks indicate a family or
community tradition of mobility. Disaggregating networks according to their gender
composi-tion allows Davis and Winters (2001) or Curran and Rivero-Fuentes (2003) to emphasize the
existence of gendered migration patterns. In addition the migration decision is usually
consid-ered as a multiple-option choice between several destination places, thus leading to the obvious
decomposition of networks according to their destination content (Davis, Stecklov, and Winters,
2002; Curran and Rivero-Fuentes, 2003).
Finally, networks are not found to be equally useful to potential migrants. Indeed, networks
may help the poorest households overcome liquidity constraints that would prevent them from
participating in international migration (Stark, Taylor, and Yitzhaki, 1986; 1988). On the other
hand, McKenzie and Rapoport (2007) relate networks effects to self-selection issues. Using
Mexican data, they show that the propensity to migrate is positively related to education
large networks. Their results are thus consistent with both the positive self-selection of migrants
driven by high migration costs and the negative self-selection of migrants due to lower returns to
education in the United-States than in Mexico for highly educated Mexicans. Networks are thus
expected to have a greater impact on the migration of the most economically, or educationally
deprived individuals or households.
Basing on the main empirical and theoretical findings in the above reviewed literature, I
try to assess the impact of migrant networks on migration decision and migrants’ destination
by investigating the four following hypotheses, mentioned in the introduction. First, migrant
networks increase the probability that individuals or households participate in international
migration. Second, the strength of the links between network members matters, which means
that community networks do not play the same role as household networks. Third, networks
are destination-specific and fourth, networks may have heterogeneous impacts, in particular
depending on gender, but also on household income or structure.
Note that this work inevitably shares with a number of empirical studies of migration,
particularly those based on cross sectional data, a double problem with the failure to account for
migration dynamics, and with endogeneity issues (Davis, Stecklov, and Winters, 2002; Winters,
de Janvry, and Sadoulet, 2001; McKenzie and Rapoport, 2007). Lacking relevant instruments,
or even historic migration rates (used by McKenzie and Rapoport (2007)3, to instrument for
current community networks), I choose to provide a merely descriptive analysis. Nonetheless,
results of the regressions run in section V are consistent with a networks effects story. Alternative
interpretations are also discussed in section V.
4
Data and Summary Statistics
4.1 The Survey
The data used in this study come from the “Enquˆete sur la Pauvret´e et la Structure Familiale”
(EPSF) survey 4, that was conducted in Senegal in 2006-2007 (DeVreyer, Lambert, Safir, and
3
The authors make the questionable assumption that historic migration variables affect current migration only through networks effects. In fact, communities which have high historic migration rates may have been and may continue to be more prone to respond positively to migration for unobserved reasons.
4The EPSF survey was designed by Momar Sylla and Matar Gueye of the Agence National de la Statistique et de la D´emographie of Senegal, on the one hand and Philippe De Vreyer (EQUIPPE, University of Lille 2 and IRD-DIAL), Sylvie Lambert (LEA-INRA and PSE) and Abla Safir (CREST-INSEE and LEA-INRA) on the other. The data collection was conducted by the ANSD thanks to the funding of the IRDC (International
Sylla, 2008). The data comprises 1785 households distributed among 150 clusters5. A two
stage sampling procedure based on a double stratification using the 2004 census data ensures
that the resulting sample is nationally representative. Survey design and sampling weights are
exploited to draw inferences on the whole Senegalese population. Unless otherwise mentioned,
all summary statistics and regressions results are based on weighted data.
The PSF survey includes information on socio-economic characteristics of households as
well as detailed information on their migrant members. The sample is restricted to households
whose head is Senegalese in order to exclude immigrant households settled in Senegal. Indeed,
including these non-Senegalese households would lead to an over-evaluation of the size and
influence of household networks, since these may have left some of their members in their
home country. The nationality criterion would raise selection concerns if large numbers of
immigrants in Senegal were likely to have acquired the Senegalese nationality. According to
Fall (2003), because of restrictive legal conditions, cumbersome and costly (100,000 XOF in
2001) administrative procedures, only 592 naturalization decrees were signed between 1971 and
2001, granting the Senegalese nationality to at most 9,000 individuals (since collective decrees
can concern 8 to 15 individuals), which is not likely to be a number large enough to affect the
composition of my sample. The estimation sample thus comprises 1707 households whose head
is Senegalese and 8,645 individuals aged 15 and over.
Migrants are defined as household members aged more than 15 years, who were living abroad
at the time of the survey, and who once lived in the surveyed household. Relatives of household
members living in another country but who have never lived in the surveyed household are thus
not counted as migrants. Actually, the design of the survey allows to identify migrants only
if they are close relatives to a household member present in the household at the time of the
survey, unless they left less than five years before the time of the survey. Hence, the population
of migrants built from PSF survey data is made of a representative sub-sample of migrants who
left after 2001 added to with a sub-sample of individuals who migrated before 2001 and left
behind them at least a spouse, a parent or a child. The data allow to differentiate migrants
depending on the broad destination they chose. It is known whether the migrant was living in
an African country or in a non African country at the time of the survey. Information on the
Development Research Center.) 5
Clusters are drawn among census districts which are small demographic units of about one hundred house-holds: they amount to one village in rural areas to a few blocks in Dakar.
exact destination has not been collected. Nonetheless, the distinction between African and non
African countries is meaningful : African destinations are much less costly than others, and most
of them do not require any visa, according to CEDEAO agreements. This feature is exploited to
see whether and how networks’ destination content affect their correlation with the probability
to migrate abroad and within Africa. Migrant households are defined as households with at
least one adult member currently living abroad. Overall 255 adults in the estimation sample are
international migrants, among which 105 were living in another African country at the time of
the survey, and 150 in a non-African country. Using sampling weights, this population of adult
migrants represents more than 160,000 individuals, that is 2.5% of the total adult population
of Senegal6. Summary statistics on the characteristics of migrants and migrant households are
presented in table 1 and 2.
The 255 international migrants are distributed among 186 households (10.3 % of our sample).
81 households (4.8 %) have a migrant in an African country whereas 108 (5.8 %) have a migrant
out of Africa. It is noteworthy that only four households actually have migrants both in Africa
and out of Africa7. Migrant households have between one and six international migrants with
an average of 1.36. As can be seen in table 2 the average number of migrants per household is
slightly higher for households participating in migration out of Africa (1.41) than for households
with migrants in an African country (1.34). However, a huge majority of migrant households
(74.3 %) only have one migrant.
As shown in table 1, more than two thirds of the migrants are men. This is all the more
true for migrants out of Africa (76.4 % are men). As for education, migrants greatly differ
depending on their destination: the percentage of migrants to an African country without
education is 40.8 %, very close to the percentage of non educated non-migrant adults (42.6 %)
whereas only 16.2 % of migrants out of Africa never went to school. The difference in the
education profiles of migrants in Africa and migrants out of Africa is even more striking when
comparing the percentages of individuals with tertiary education (2.0 % for migrants in Africa,
13.9 % for migrants out of Africa)8. Very interestingly, the percentage of individuals with
Koranic schooling only is 10 percentage points higher in the subsample of migrants (regardless
6
Note that this figure is obtained from data on migration outflows and is thus not comparable to estimates of the stock of Senegalese living abroad.
7Those households were not included in the estimation sample in the multinomial logit regression. 8
Note that it is not known whether they reached their education level before leaving the country or whether they attended university abroad
Table 1: Individual characteristics of migrants and non migrants
Migrants Migrants test All migrants All adults test
in Africa out of Africa (1)-(2) (3)-(4)
Number of observations 105 150 255 9747
Subpopulation size (individuals) 69,954 91,512 161,466 6,462,475
Percentage of total 1.1 1.4 2.5 100
Sex (% male) 63.9 76.4 ** 70.9 47.2 ***
Age 35.3 34.6 34.9 34.2
Percentage of individuals:
Without education 40.8 16.2 *** 26.8 42.6 **
With Koranic education only 25.5 23.1 24.1 15.6 **
With primary education 19.4 19.2 19.3 27.2 **
With secondary education 12.2 27.7 ** 21.1 12.5 **
With tertiary education 2.0 13.9 *** 8.9 2.1 ***
Source: PSF Data collected in 2006.
Tests of equality of the means between migrants in Africa and migrants out of Africa on the one hand, and between migrants and non-migrants on the other hand are obtained from an adjusted Wald test.
of the destination) than in the whole population of adults.
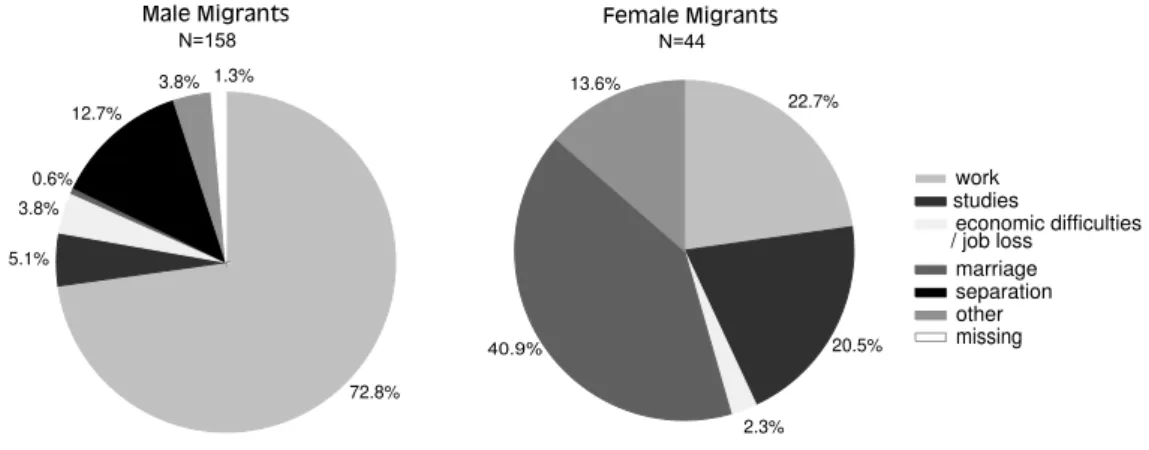
Additional information about the reason for leaving and the exact destination place is
avail-able for two different subsets of 154 and 168 migrants. Though not exploited in the remainder
of this study, these additional data provide an insight about the migration process. Job-related
reasons come first (more than 70%) for male migrants whatever their destination whereas it is
only second for women with 23%, far below marriage which is put forward by 42% of female
migrants. This feature suggests that migration patterns probably differ for men and women.
Second, as concerns migrants’ destination, 22 countries are mentioned. Most frequently named
are France (43 individuals), The Gambia and Mauritania (21 and 23 migrants), followed by Italy
and Spain (17 and 11 migrants). All other destination countries are chosen by less than seven
migrants. Note that among African countries, those adjoining Senegal are the top destinations,
whereas among non African countries France comes first, in spite of the growing attractiveness
T able 2: Characteristics of migran t and non migran t household s (1) (2) (3) (4) (5) Households Households Households Households All with Migran ts with Migran ts test with Migran ts without test Households Units in Africa out of Africa (1)-(2) Migran ts (3)-(4) Num b er of observ ations (households) 81 108 186 1530 1716 P e rc en tage of total 4.8 5.8 10.3 89.7 100 Household Size 9.6 10.8 10.2 7.7 *** 7 .9 Dep endency ratio 0.45 0.43 0.44 0.40 ** 0 .4 1 Gender comp osition ratio 0.48 0.41 ** 0.44 0.51 *** 0.50 Age of the household head y ears 51.8 53.4 52.5 49.7 ** 50.0 Sex of the household head % male 61.5 4 9.3 ** 55.0 81.9 *** 79.1 Murid % 14.7 33.7 *** 24.1 34.1 *** 33.0 Educ. of the head, no formal education % 64 .7 62.0 63.0 66.4 6 6.1 Educ. of the head, primary % 18.5 10.8 14.6 19.2 * 18.7 Educ. of the head, secondary and higher % 16.8 27.3 *** 22.5 14.4 ** 15.2 W ealth indicators Land % 46.9 25.2 *** 34.7 41.9 * 41.2 Net p er capita total exp enditures 10 6 X OF 0 .4 01 0.792 ** 0.626 0.542 0.551 Lo cation Rural % 55.1 38.2 ** 43.7 53.7 * 52.9 Dak ar % 24.9 42.5 *** 35.4 27.5 ** 2 8.3 North and East % 24.4 17.6 20.6 14 .1 ** 14.8 South % 25.6 4.6 *** 13.9 9.6 * 10.0 Cen te r % 11.6 28.7 *** 21.1 39.6 *** 37.6 Dep endency ratio is the share of households residen t mem b ers a ged 0-15 and aged 65 and o v er; gender comp osition is the prop ortion of male household mem b ers Dak ar is the administrativ e Dak ar region ; N o rth and East represen ts the regions of Sain t-Louis Matam and T am bacou nda; South, the regions of Ko lda and Ziguinc hor; and Cen ter, the fiv e regions of Thi `es, Louga, F atic k, Diourb el and Kaolac k. T ests of equalit y of the means b et w een ho use h olds with migran ts in Africa and households with migran ts out of Africa on the one hand, and b et w een households with and without migra n ts on the other ha nd are obtained from an adjusted W ald test. Means are found to b e differen t at the follo wing significance lev els ∗ p < 0 .10, ∗∗ p < 0 .05, ∗∗∗ p < 0 .01 Sour ce : PSF Data coll ected in 2006.
Characteristics of households depending on their migration status are presented in table 2.
Demographic characteristics (household size, gender or age composition) are based on remaining
members of the household only, that is individuals residing in the surveyed household in Senegal 9. The variables used are described in table footnotes wherever needed. Migrant households are
found to be different from non migrant households in many demographic indices: they are on
average larger households, whose head is slightly older and more often a woman, with a biased
gender composition (lower percentage of male among adults), and more dependants. These
statistics are consistent with the labor migration of male of active age.
On the other hand, migrant households form two distinct groups depending on the
destina-tion of their migrant members10. In particular households with migrants in Africa are less often
Murid and less wealthy in terms of per capita expenditures than average. As for households
with migrants in non African countries, their head has more frequently some secondary or
ter-tiary education (27.3% against 14.4% in the whole population), they are more than 50% richer
and urban (42.5% of such households are located in Dakar, against 27.5% of all households).
As concerns location, North-East and South regions, bordering two of the most frequently cited
destination countries, Mauritania and The Gambia, are unsurprisingly overrepresented among
households with migrants in Africa.
4.2 Migration Networks
The networks approach chosen in this paper follows a methodology applied to Mexican data
by Winters, de Janvry, and Sadoulet (2001) or Davis, Stecklov, and Winters (2002). Not only
does this approach seem to be generally approved but it also fits particularly well the nature of
information collected by the PSF survey. We first define two types of networks: family networks
and community networks. Subsequently both kind of networks are disaggregated further by their
destination content (Africa versus out of Africa), and community networks are decomposed into
historic and current migration networks.
Household networks variables account for the migration history of the household. They are
based on the presence of return migrants in the surveyed households. Two household networks
9Such a restrictive choice could be discussed, since the limits to be given to a household is a tricky issue, and probably even more in Senegal. Including migrants could be a possibility and avoid some reverse causality issues, but the question of whether including internal migrants would be more complex, and lead to arbitrary choices.
dummy variables are created to account for the two broad destinations migrants can choose:
the first dummy variable equals one when at least one member of the household returned from
an African country and the second dummy variable equals one when at least one member of
the household returned from a non-African country.
At the community level, the construction of networks variables exploits the design of the
survey as follows: Remember that the sampling process led to the drawing of 150 clusters in each
of which 12 households were randomly drawn to be interviewed. For each household, community
networks variables thus summarize information on migrants in the 11 other surveyed households
from the same cluster. Two strong assumptions are needed: First it is assumed that surveyed
households can be considered representative of their census districts, in spite of a serious concern
about the small number of surveyed households in each census district. Indeed, a measurement
error depending on the size of clusters (which varies from 25 to 400 households with an average
of 100) arise from the use of survey data to construct community networks variables. Though
the bias generated is well known as attenuation bias, in a non-linear regression framework with
multiple covariate we have a priori no clue about the magnitude and direction of the bias (Bound,
Brown, and Mathiowetz, 2007; Stefanski, Buzas, and Tosteson, 2005). The second assumption
is that census districts do correspond to actual communities, implying for example that social
relationships exist between individuals and households living in the same census districts. For
lack of migration data at the community level, above discussed community networks variables
are nevertheless considered acceptable proxies for community networks.
Two sets of networks variables are thus defined at the community level to take into account
both past and current migration facts11. For a given household the historic community networks
variable is defined as the sum of the number of return international migrants over the 11
other households from the same cluster. Similarly current migration networks variables at the
community level are defined as the total number of current migrants to Africa on the one hand,
and out of Africa on the other hand, in other surveyed households from the same census district.
11
After testing for different specification the decomposition according to destination (within Africa or out of Africa) was not retained for historic community networks, since it did not seem to supply enough information to make up for the cost of adding one more variable in the model
T able 3: F amily and comm unit y net w orks at the household lev el (1) (2) (3) (4) (5) Households Households Households Households All with Migran ts with Migran ts test with Migran ts without test Households Units in Africa out of Africa (1)-(2) Migran ts (3)-(4) Num b er of observ ations (households) 8 1 108 186 15 30 171 6 P erce n tage of total 4.8 5.8 10.3 89.7 100 Household migration and net w orks Curren t migran ts Num b er of migran ts 1.34 1.41 1.36 0 -0.16 Historic migran ts (net w orks) F ormer migran ts, Africa % 27.4 11.1 *** 17.8 7.0 *** 8.1 F ormer migran ts, out of Africa % 3.4 12.5 *** 8.6 1.9 *** 2.6 Comm unit y net w orks Num b er of curren t migran ts, Africa 1.6 1.0 ** 1.3 0.7 *** 0.7 Curren t migran ts, Africa % 60.9 38.7 *** 48.6 34.2 *** 35.7 Num b er of curren t migran ts, out of Africa 1.1 1.3 1.2 0.8 *** 0.8 Curren t migran ts, out of Africa % 48.9 55.1 53.0 41 .6 ** 42.8 F ormer migran ts % 82.4 7 1.0 * 75.6 60.2 *** 61.8 Num b er of former migran ts 2.9 2.5 2.6 2.1 *** 2.1 T ests of equalit y of the means b et w een ho useholds with migran ts in Africa and households with migran ts out of Africa on the one hand, and b et w een households with and without migra n ts on the other ha nd are obtained from an adjusted W ald test. Means are found to b e differen t at the follo wing significance lev els : ∗ p < 0 .10, ∗∗ p < 0 .05, ∗∗∗ p < 0 .01 Sour ce : PSF Data colle cted in 2006.
Descriptive statistics for household and community migration networks are presented in
table 3. Community networks can take different values for households living in the same
com-munity since they are based on the total number of migrants in all surveyed households in
the community minus their own contribution. Not surprisingly households migration networks
in Africa are significantly higher for households with migrants in Africa and households with
migrants out of Africa have larger networks out of Africa. But distribution of networks
accord-ing to the destination of migrants is not perfectly symmetrical: the proportions of households
with former migrants returned from a non-African country and from Africa are very close for
households currently participating in migration out of Africa (11.1 and 12.5%), whereas more
than a quarter of households with current migrants in Africa have historic networks in Africa
and only 3.4% of them have historic networks out of Africa. Historic connections with Africa
are thus more evenly distributed than historic networks out of Africa.
5
Multivariate Analysis and Discussion
5.1 Regression Results
At first, households and individuals are considered to be faced with the choice of whether to
participate in international migration or not. The migration decision is thus modelled as a
binary output using a logistic regression model. Results of the household level regression are
presented in table 412.
Subsequently, following Davis, Stecklov, and Winters (2002), a multinomial logit regression
model is used to represent the migration decision taking into account the two broad
destina-tions migrants can choose. Migrants or migrant households are considered to take the decision
whether to participate in migration to Africa, to participate in migration out of Africa, or not
participate in international migration at all. The three options being unordered, the
multi-nomial logit regression model is best suited. A Hausman test has been conducted and does
not lead to reject the assumption of independence of irrelevant alternatives (IIA)13. Results
12
Binary logit results at the individual level are very similar to results shown in table 4, and are therefore not commented here but are presented in Appendix (table 14).
13
In both household and individual regression model, when either migration in Africa, migration out of Africa alternatives, or no-migration alternatives are dropped, Hausman tests show that IIA assumption holds. For more robustness alternative regression models using multinomial probits were also run. Up to a scale factor, similar results were found.
Table 4: Migration decision: household logit regression model
Logistic regression
Number of observations=1,779 Participate vs non participate in migration
coef. t-stat p-value
Household 0.000
Size 0.081∗∗∗ (6.03)
Dependency ratio 0.708 (1.65)
Gender composition −1.287∗∗∗
(−3.10)
Age of the household head 0.004 (0.72)
Household head male (d) −1.465∗∗∗ (−7.78)
Murid (d) −0.176 (−1.00)
Education of the head, primary (d) 0.063 (0.27)
Education of the head, secondary or higher (d) 0.830∗∗∗ (3.73) Education of the head, koranic only (d) 0.326∗ (1.79)
Wealth variables 0.093
Land (d) −0.283 (−1.35)
Total net expenditures 0.037∗ (1.89)
Location 0.000
Rural (d) 0.213 (0.97)
North and East (d) −0.277 (−1.26)
South (d) 0.330 (1.42)
Center (d) −0.906∗∗∗
(−3.71)
Community migration networks 0.002
Historical migration −0.019 (−0.93)
Current migration in Africa 0.141∗∗∗ (3.61)
Current migration out of Africa 0.076∗ (1.90)
Household migration networks 0.000
Historical migration in Africa (d) 0.982∗∗∗ (4.47) Historical migration out of Africa (d) 1.589∗∗∗ (4.30)
Constant −2.192∗∗∗ (−4.88)
Survey design and weights are used in the multinomial regression (d) indicates dummy variables
p-value for groups of variables are obtained from an adjusted Wald test ∗
p < 0.10,∗∗ p < 0.05,∗∗∗p < 0.01 Source: PSF Data collected in 2006.
of the estimation of this model (at both household and individual level) are shown in table 5
and 614. In both tables, the two columns show results for the alternatives “participate in
mi-gration in Africa” and “participate in mimi-gration out of Africa”, relative to the third option,
that is, not participate in international migration. Table 6 presents a regression model adapted
to the individual dataset and incremented with individual variables. Then, in order to allow
for the possibility of internal migration, we consider a more realistic set of migration choices,
by considering for migrants originated from regions other than Dakar, the migration decision
as a choices between four alternatives: stay, move to Dakar, migrate to an Africa country, or
migrate to farther destinations. Results are presented in table 8, whereas table 9 investigates
potential specificities in migration decisions of individuals whose origin household is settled in
Dakar.
5.1.1 Household composition, wealth, human capital and location variables
The main findings for the non-networks variables are first discussed here. Results mostly
con-firm what summary statistics suggested as regards household composition, physical capital and
location variables. Among household composition variables, household size is positively and
significantly related with the participation in migration. Similarly, the coefficient on the
de-pendency ratio is also positive (though not significant at the 10% level), implying a positive
correlation between the share of dependants relative to members of the household of active age
and the participation in migration. Conversely, the fact that the household is headed by a
man is unsurprisingly negatively correlated with the probability that the household participate
in migration. Reverse causality may explain all these results, if migrants are male of active
age, which is confirmed by the regression run at the individual level (table 6. In particular,
as regards the gender of the household head, indeed when the male household head is abroad,
the household tends to be more frequently headed by his wife. In order to avoid such reverse
causality concerns, those three variables most likely to be involved (gender composition,
depen-dency ratio and gender of the head) are not included in the subsequent regressions. However,
note that including them does not affect the results.
As can be seen in table 4, households whose head has either Koranic education or at least
14
In all regressions the survey design is taken into account, observations are weighted using survey weights, and residuals are allowed to be correlated within clusters: standard errors are clustered by district for household level regressions and by household for individual regressions.
Table 5: Migration decision: household multinomial logit regression model
Multinomial logit regression Number of observations=1,779
Migration to:
Africa versus none Out of Africa versus none
coef. t-stat coef. t-stat p-value
Household 0.000
Size 0.060∗∗∗ (2.75) 0.104∗∗∗ (6.50)
Age of the household head −0.000 (−0.04) 0.008 (1.08)
Household head male (d) −1.598∗∗∗ (−6.98) −1.850∗∗∗ (−10.68)
Murid (d) −0.706∗∗
(−2.22) 0.136 (0.63)
Education of the head, primary (d) 0.170 (0.57) −0.293 (−0.87)
Education of the head, secondary or higher (d) 0.733∗ (1.89) 0.831∗∗∗ (3.51)
Education of the head, koranic only (d) 0.422 (1.65) 0.140 (0.52)
Wealth variables 0.048
Land (d) 0.032 (0.11) −0.629∗∗
(−2.50)
Total net expenditures −0.066 (−0.61) 0.040∗ (1.98)
Location 0.000
Rural (d) 0.244 (0.71) 0.438 (1.41)
North and East (d) 0.133 (0.36) −0.423 (−1.43)
South (d) 0.967∗∗∗ (2.70) −0.745∗ (−1.93)
Center (d) −1.220∗∗
(−2.59) −0.624∗∗
(−2.07)
Community migration networks 0.002
Historical migration −0.045 (−1.40) 0.003 (0.10)
Current migration in Africa 0.151∗∗∗ (3.60) 0.133∗∗∗ (3.03)
Current migration out of Africa 0.087∗∗ (1.99) 0.045 (0.77)
Household migration networks 0.000
Historical migration in Africa (d) 1.290∗∗∗ (4.38) 0.395 (1.35)
Historical migration out of Africa (d) 0.493 (1.13) 2.032∗∗∗ (4.96)
Constant −2.839∗∗∗ (−4.84) −3.097∗∗∗ (−7.06)
Survey design and weights are used in the multinomial regression (d) indicates dummy variables
p-value for groups of variables are obtained from an adjusted Wald test ∗
p < 0.10,∗∗ p < 0.05,∗∗∗p < 0.01 Source: PSF Data collected in 2006.
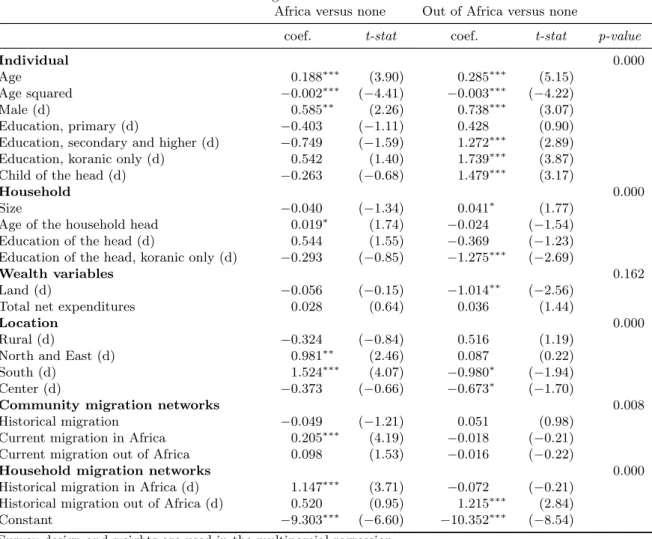
Table 6: Migration decision: individual multinomial logit regression model
Multinomial logit regression Number of observations=8,644
Migration to:
Africa versus none Out of Africa versus none
coef. t-stat coef. t-stat p-value
Individual 0.000 Age 0.188∗∗∗ (3.90) 0.285∗∗∗ (5.15) Age squared −0.002∗∗∗ (−4.41) −0.003∗∗∗ (−4.22) Male (d) 0.585∗∗ (2.26) 0.738∗∗∗ (3.07) Education, primary (d) −0.403 (−1.11) 0.428 (0.90)
Education, secondary and higher (d) −0.749 (−1.59) 1.272∗∗∗ (2.89)
Education, koranic only (d) 0.542 (1.40) 1.739∗∗∗ (3.87)
Child of the head (d) −0.263 (−0.68) 1.479∗∗∗ (3.17)
Household 0.000
Size −0.040 (−1.34) 0.041∗ (1.77)
Age of the household head 0.019∗ (1.74) −0.024 (−1.54)
Education of the head (d) 0.544 (1.55) −0.369 (−1.23)
Education of the head, koranic only (d) −0.293 (−0.85) −1.275∗∗∗ (−2.69)
Wealth variables 0.162
Land (d) −0.056 (−0.15) −1.014∗∗ (−2.56)
Total net expenditures 0.028 (0.64) 0.036 (1.44)
Location 0.000
Rural (d) −0.324 (−0.84) 0.516 (1.19)
North and East (d) 0.981∗∗ (2.46) 0.087 (0.22)
South (d) 1.524∗∗∗ (4.07) −0.980∗ (−1.94)
Center (d) −0.373 (−0.66) −0.673∗
(−1.70)
Community migration networks 0.008
Historical migration −0.049 (−1.21) 0.051 (0.98)
Current migration in Africa 0.205∗∗∗ (4.19) −0.018 (−0.21)
Current migration out of Africa 0.098 (1.53) −0.016 (−0.22)
Household migration networks 0.000
Historical migration in Africa (d) 1.147∗∗∗ (3.71) −0.072 (−0.21) Historical migration out of Africa (d) 0.520 (0.95) 1.215∗∗∗ (2.84)
Constant −9.303∗∗∗ (−6.60) −10.352∗∗∗ (−8.54)
Survey design and weights are used in the multinomial regression (d) indicates dummy variables
p-value for groups of variables are obtained from an adjusted Wald test ∗
p < 0.10,∗∗ p < 0.05,∗∗∗ p < 0.01 Source: PSF Data collected in 2006.
some secondary education are more likely to participate in migration. Due to small cells issues,
the variable for the education of the household head in the multinomial logit model (table 5)
is a dummy variable taking the value 1 when the head has at least some primary education.
When primary education and higher levels of education are aggregated, the coefficient on the
education of the head variable remains positive and significant. Neither the age of the head
nor the Murid dummy variable is significant15. Results for household composition variables are
found to be robust across specifications and similar whatever the destination. Note however
that the household size is not significantly correlated with migration in the multinomial logit
regression at the individual level.
Coefficients on physical capital variables are found to be jointly significant at least at the
10% level in all specifications. But actually, as shown in table 5 the coefficient on the
expen-ditures variable (defined as the logarithm of per capita annual expenexpen-ditures) used as a proxy
for household income, is found positive and significant, for migration out of Africa only. It
means that there is a positive relationship between wealth measured by expenditures and the
participation in migration out of Africa. One may interpret this result as indicating that richer
households are more likely than poorer to participate in costly international outmigration. But
such an interpretation is not the only one allowed by our specification, since wealth is highly
endogenous with regard to migration by means of remittances, even after deduction of the
ex-penditures directly taken care of by migrants. Alternative interpretations could be that the
income generated by migration to European or American countries increases the expenditures
of migrant households through remittances in a way that is not accurately taken into account
here, or that migration to high income countries enhances through remittances and investments
the ability of households to receive a higher income at home. Because of the potential
endo-geneity of the expenditures variables, I tested different specifications of the model excluding
it. In particular, wealth and education could be positively correlated, and such a correlation
could affect the coefficients on the education of the head variables. Indeed, when excluding the
expenditure variable of the model, the coefficient on the education of the head variables come
to zero, as regards migration to Africa. Conversely, the positive correlation between secondary
and higher levels of education of the head and the probability to have migrants out of Africa
15This result, despite having to be considered cautiously due to the small number of observations, is interesting considering the vast literature on Murid migration networks. According to our results, Murid do not migrate more than other Senegalese.
remains unchanged. All other results are robust to the inclusion of the expenditures variable.
Gender, age and education variables, as well as a dummy indicating that the individual is the
son or daughter of the household head, are included in the individual multinomial logit whose
results are shown in table 6. Not surprisingly, the probability to migrate is a quadratic function
of age, increasing with age up to a turning point at around 39 years of age for both destinations.
Being a man is associated with a higher probability to migrate to an African country and a
non-African country, holding all other explanatory variables constant. As for education, adults with
some primary education do not migrate more than those with no education at all, but highest
levels of education (secondary and higher) are positively correlated with the probability that
an individual migrate out of Africa and negatively correlated with the probability to migrate
within Africa. This latter result is consistent with the findings of the migration literature:
the cost of entry into international migration is even higher for migration to Europe and the
United-States, which could favor emigrants with a greater educational background. Conversely,
our finding that Senegalese with higher levels of education have a lower probability to migrate to
African countries suggests that returns to education are higher at home than in another African
country. A noticeable finding is the positive correlation between Koranic education and the
propensity to migrate out of Africa, which may be explained by the existence of religion-based
international networks, or household strategies of investment in both education and migration
(as in Auriol and Demonsant (2011)). Note that sons or daughters of household heads are
more likely to migrate, especially to non African countries, which is consistent with households
models of migration : closer family ties are expected to create more remitting obligations, thus
households are likely to sponsor migration of sons (Stark and Lucas (1988), Hoddinott (1994)).
As for location variables, regional dummies are aggregated in four categories16. The reference
category for regional dummies is the Dakar region. First note that households located in the
regions of Thies, Diourbel, Kaolack and Fatick are less likely to participate in international
migration (table 4). Negative (though non significant) coefficients on the “North and East”
dummy in table 4 suggest that, all else equal, households located in the regions of Saint-Louis,
Matam and Tambacounda, in spite of the fact that the latter two include the upper Senegal river
valley kwnown as a major emigration area, are no more likely to have migrants than households
located in Dakar. The coefficient on the “North and East” dummy is however significantly
correlated with migration in Africa in some specifications (see table 6), as expected of regions
bordering Mauritania.
Table 5 also shows that the coefficients on all three regional dummies are negative, as regards
the probability to migrate in a non African country. This latter finding is not much surprising
since most international migrants going to Europe, whatever their geographical origin, first
move to Dakar before leaving the country.
5.1.2 Networks variables
Results of the binary logit regression in table 4 suggest that all network variables except historic
community networks are positively correlated with the probability that households participate
in international migration. Moreover these effects seem to be larger for family networks: having
one more person in its community network in Africa is associated with a probability 1.2 times
higher to participate in migration, but all else equal and all other variables taken at their mean
value, the same probability is multiplied by 2.6 when households have former migrant members
back from Africa (historic household network)17.
Multinomial logit regressions run at both household and individual levels allow to go into
networks correlation with the probability to migrate with regard to the destination. Two
unequivocal results stand out in table 5: First, at the household level, as expected, networks
seem to be destination-specific. The dummy for the presence of former migrants to Africa
in the household is positively related to the probability to have current migrants in Africa,
whereas the dummy for former migrants out of Africa is positively related to the probability
for the household of participating in migration out of Africa. Interpreting these results in
terms of relative risk ratios for household level regression (table 5), means that having a former
migrant to Africa back in the household is correlated with a probability 4.2 times higher for
the household to participate in current migration to Africa. Similarly having a former migrant
to a non-African country is associated with a probability 7.9 times higher for a household to
participate in migration out of Africa. Conversely, having household networks in Africa is not
correlated with a greater participation in migration out of Africa, and vice versa.
Second, conversely, community networks seem to be less destination-specific than family
17
Part of the difference in scale between the two coefficients could be explained by a measurement error bias, as explained above.
networks (see table 5) The positive correlation between the variable for community networks in
Africa and the probability to participate in African migration is significant and robust. On the
opposite, the non-African community network is not found to affect migration outside Africa.
In between, results depend on which model is estimated (individual versus household). Note in
particular that at the household level the variable for community networks in Africa is positively
correlated with both probabilities to participate in migration in and out of Africa.
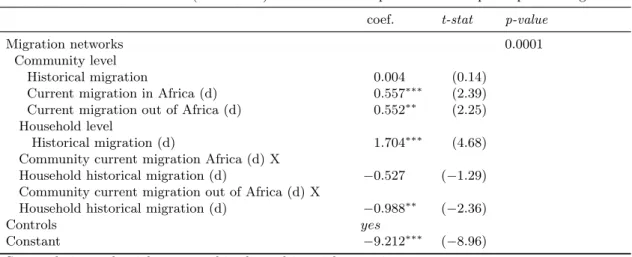
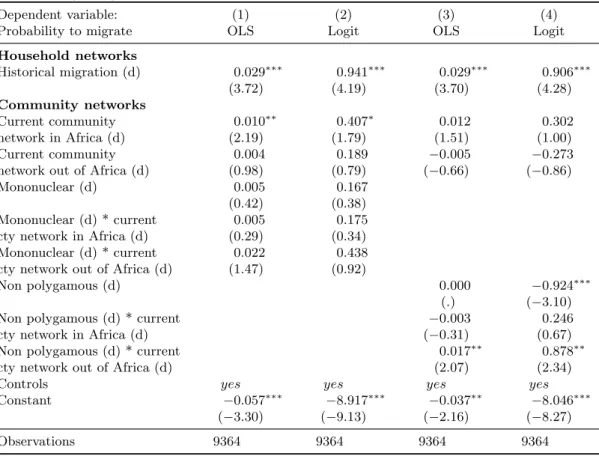
Table 7: Community networks and family networks: complements or substitutes?
Logistic regression
Number of observations=8645 (individuals) Participate versus non participate in migration coef. t-stat p-value
Migration networks 0.0001
Community level
Historical migration 0.004 (0.14)
Current migration in Africa (d) 0.557∗∗∗ (2.39)
Current migration out of Africa (d) 0.552∗∗ (2.25) Household level
Historical migration (d) 1.704∗∗∗ (4.68)
Community current migration Africa (d) X
Household historical migration (d) −0.527 (−1.29)
Community current migration out of Africa (d) X
Household historical migration (d) −0.988∗∗
(−2.36)
Controls yes
Constant −9.212∗∗∗
(−8.96) Survey design and weights are used in the multinomial regression
(d) indicates dummy variables
Controls included are individual and household non-networks variables figuring in table 3 ∗
p < 0.10,∗∗ p < 0.05,∗∗∗ p < 0.01 Source: PSF Data collected in 2006.
The relationship between community and household migration networks is investigated
fur-ther by introducing interaction terms between both types of networks. The relatively small
number of observations in the subsample does not allow to explore interactions between
house-hold and community level network variables and at the same time break down migrants
des-tination into African and non-African countries. In order to get round small cells problems
a new household network dummy variable is thus constructed taking the value one when the
household has one or more former international migrant back either from Africa or from a
non-African country. Interactions between this new variable for household network and the
two above defined community variables for current migration networks are explored in a
bi-nary logit model run on individual data. Results are shown in table 718. The negative sign of
18In spite of interpretation issues raised by interactions in non linear models demonstrated by ?, the interpre-tation presented here is reinforced by the fact that similar results are obtained when computing counterfactuals
the interaction term between community networks in Africa and household networks suggest
that household networks and community networks in Africa are partly substitutable, whereas
household network and community network out of Africa seem to have no interaction.
To sum up, results presented above seem to imply first that migration networks at the
household level have a greater positive influence on the probability to migrate than community
networks, which is consistent with the above mentioned distinction between “strong” and “weak”
ties. It might be advanced that while information can be provided by community networks,
direct financial assistance is more likely to be given to the would-be migrant by members of
her own household, although the available data cannot help differentiate these two channels.
Second, migration networks at the household level appear to be destination specific in the sense
that having family networks in Africa does not affect the decision to participate in migration
out of Africa, and vice versa. Third, having access to community networks in Africa seems to
be positively related with the probability that a household participate in migration whatever
the destination chosen19. This finding is indeed consistent with numerous empirical evidence
suggesting that migrants to Northern countries often pass in transit through African countries
before reaching their final destination. In such a perspective, migrants from the same community
settled in an African country may turn out to be major assets in a migration strategy intended to
reach Europe. Fourth, community networks, in Africa only, are found to be partial substitutes
for household networks which means that the former type of networks is relatively more useful
to help migrate individuals that do not benefit from family networks than those who are already
endowed with family networks.
5.2 Migration to Dakar
International and rural-urban migrations cannot be considered in isolation. Indeed, as suggested
by the above results on geographical patterns of Senegalese migrations, most migrants heading
towards Europe or America necessarily transit through Dakar. For that reason, table 8 present
regressions results where migration is represented as a choice between four options, with the
possibility to move to Dakar being added to the two broad foreign destinations and the stay
option. It is interesting to note that adding an extra destination does not affect, on average,
(see in Appendix).
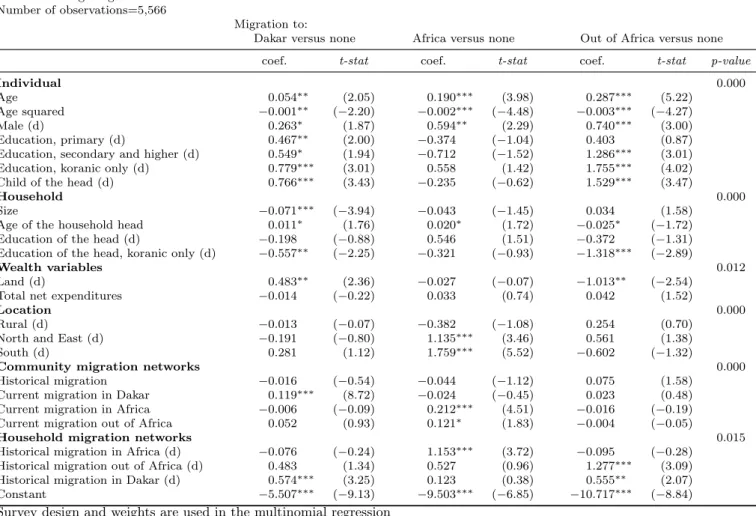
Table 8: Migration decision: individual multinomial logit regression model, regions other than Dakar
Multinomial logit regression Number of observations=5,566
Migration to:
Dakar versus none Africa versus none Out of Africa versus none coef. t-stat coef. t-stat coef. t-stat p-value
Individual 0.000
Age 0.054∗∗ (2.05) 0.190∗∗∗ (3.98) 0.287∗∗∗ (5.22)
Age squared −0.001∗∗ (−2.20) −0.002∗∗∗ (−4.48) −0.003∗∗∗ (−4.27)
Male (d) 0.263∗ (1.87) 0.594∗∗ (2.29) 0.740∗∗∗ (3.00)
Education, primary (d) 0.467∗∗ (2.00) −0.374 (−1.04) 0.403 (0.87)
Education, secondary and higher (d) 0.549∗ (1.94) −0.712 (−1.52) 1.286∗∗∗ (3.01) Education, koranic only (d) 0.779∗∗∗ (3.01) 0.558 (1.42) 1.755∗∗∗ (4.02) Child of the head (d) 0.766∗∗∗ (3.43) −0.235 (−0.62) 1.529∗∗∗ (3.47)
Household 0.000
Size −0.071∗∗∗ (−3.94) −0.043 (−1.45) 0.034 (1.58)
Age of the household head 0.011∗ (1.76) 0.020∗ (1.72) −0.025∗ (−1.72)
Education of the head (d) −0.198 (−0.88) 0.546 (1.51) −0.372 (−1.31) Education of the head, koranic only (d) −0.557∗∗ (−2.25) −0.321 (−0.93) −1.318∗∗∗ (−2.89)
Wealth variables 0.012
Land (d) 0.483∗∗ (2.36) −0.027 (−0.07) −1.013∗∗ (−2.54)
Total net expenditures −0.014 (−0.22) 0.033 (0.74) 0.042 (1.52)
Location 0.000
Rural (d) −0.013 (−0.07) −0.382 (−1.08) 0.254 (0.70)
North and East (d) −0.191 (−0.80) 1.135∗∗∗ (3.46) 0.561 (1.38)
South (d) 0.281 (1.12) 1.759∗∗∗ (5.52) −0.602 (−1.32)
Community migration networks 0.000
Historical migration −0.016 (−0.54) −0.044 (−1.12) 0.075 (1.58)
Current migration in Dakar 0.119∗∗∗ (8.72) −0.024 (−0.45) 0.023 (0.48) Current migration in Africa −0.006 (−0.09) 0.212∗∗∗ (4.51) −0.016 (−0.19)
Current migration out of Africa 0.052 (0.93) 0.121∗ (1.83) −0.004 (−0.05)
Household migration networks 0.015
Historical migration in Africa (d) −0.076 (−0.24) 1.153∗∗∗ (3.72) −0.095 (−0.28) Historical migration out of Africa (d) 0.483 (1.34) 0.527 (0.96) 1.277∗∗∗ (3.09) Historical migration in Dakar (d) 0.574∗∗∗ (3.25) 0.123 (0.38) 0.555∗∗ (2.07)
Constant −5.507∗∗∗ (−9.13) −9.503∗∗∗ (−6.85) −10.717∗∗∗ (−8.84) Survey design and weights are used in the multinomial regression
(d) indicates dummy variables
p-value for groups of variables are obtained from an adjusted Wald test ∗
p < 0.10,∗∗ p < 0.05,∗∗∗p < 0.01 Source: PSF Data collected in 2006.
above commented results as regards the two other alternatives (migrate in Africa and out
of Africa), consistently with the IIA assumption, and even though the regression sample is
different since it here excludes households located in Dakar. Results suggest that migrant
household members settled in Dakar are on average more educated than stayers, which can be
explained both by the fact that moving to Dakar often proves the only possibility to pursue
one’s education, or by the lack of job opportunities for skilled individuals in other regions.
Coefficients on migration networks seem to corroborate the role played by Dakar of a
stopping-off city between all Senegalese regions (since none of the coefficients on regional dummies is
found significant) and Europe or America. Indeed, individuals with family networks in Dakar,
consistently with the idea of destination-specific networks, but also in non African countries are
more likely to move to Dakar.
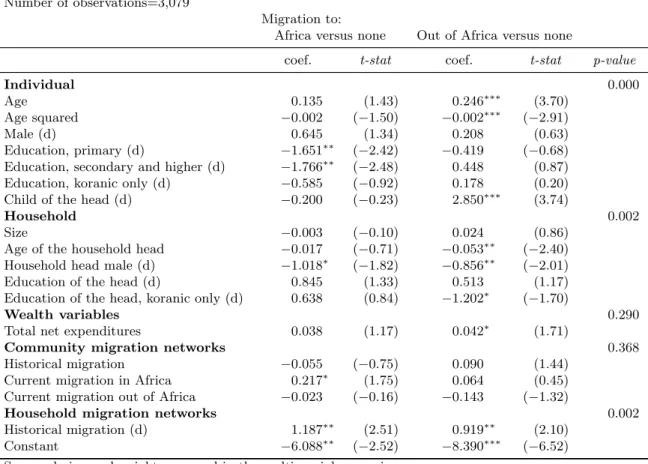
Table 9: Migration decision: individual multinomial logit regression model, Dakar
Multinomial logit regression Number of observations=3,079
Migration to:
Africa versus none Out of Africa versus none
coef. t-stat coef. t-stat p-value
Individual 0.000 Age 0.135 (1.43) 0.246∗∗∗ (3.70) Age squared −0.002 (−1.50) −0.002∗∗∗ (−2.91) Male (d) 0.645 (1.34) 0.208 (0.63) Education, primary (d) −1.651∗∗ (−2.42) −0.419 (−0.68)
Education, secondary and higher (d) −1.766∗∗
(−2.48) 0.448 (0.87)
Education, koranic only (d) −0.585 (−0.92) 0.178 (0.20)
Child of the head (d) −0.200 (−0.23) 2.850∗∗∗ (3.74)
Household 0.002
Size −0.003 (−0.10) 0.024 (0.86)
Age of the household head −0.017 (−0.71) −0.053∗∗ (−2.40)
Household head male (d) −1.018∗
(−1.82) −0.856∗∗
(−2.01)
Education of the head (d) 0.845 (1.33) 0.513 (1.17)
Education of the head, koranic only (d) 0.638 (0.84) −1.202∗
(−1.70)
Wealth variables 0.290
Total net expenditures 0.038 (1.17) 0.042∗ (1.71)
Community migration networks 0.368
Historical migration −0.055 (−0.75) 0.090 (1.44)
Current migration in Africa 0.217∗ (1.75) 0.064 (0.45)
Current migration out of Africa −0.023 (−0.16) −0.143 (−1.32)
Household migration networks 0.002
Historical migration (d) 1.187∗∗ (2.51) 0.919∗∗ (2.10)
Constant −6.088∗∗
(−2.52) −8.390∗∗∗
(−6.52) Survey design and weights are used in the multinomial regression
(d) indicates dummy variables
p-value for groups of variables are obtained from an adjusted Wald test ∗
p < 0.10,∗∗ p < 0.05,∗∗∗ p < 0.01 Source: PSF Data collected in 2006.
Symmetrically, table 9 focuses on migration of individuals originated from households settled
in Dakar. Very strikingly, the only significant characteristic found to be correlated with their
propensity to migrate to non African destinations, except their age, is the existence of family
networks. Because of the reduced size of the sample, household networks cannot be
differenti-ated with regard to their destination content. As for migration within Africa, it is positively
correlated with household networks but also, even in such an urban context, with community
networks in Africa. In addition, no difference is found between migrants from Dakar and from
other regions as regards their educational characteristics: migrants in Africa are on average less
educated whereas farther destinations attract or select the most educated ones.
Note that the fact that migrants may transit through Dakar before migrating to Europe or
America may raise a concern about double counting. Indeed, those migrants from rural areas
or regional towns might be declared to have left two households : their origin household, and
the household that gave them shelter in Dakar. Since our sample is representative, there is
in theory a double counting of migrants originated from regions other than Dakar, if migrants
stayed long enough to be considered to have been once member of the household, and declared
to surveyors. Moreover, if they left their shelter household in Dakar more than 5 years before
the survey and had no direct family tie to remaining members, they are missed by the survey.
Even if (theoretical) double counting may explain to some extent the fact that most migrants
are originated from Dakar, since we are not trying to estimate the incidence of migration, but
rather explore the relation between networks and migration, there is no much cause of concern.
On the other hand, the recall bias analysed by Safir (2009), who contributed to design the
survey, may have greater consequences. Indeed, she shows that households tend to under-declare
the departures of women, especially those marrying out in rural areas. However, this may not
be the main explanation for our results, since we expect households to keep better memories of
women who migrated abroad, and in particular to a non African country.
5.3 Exploring Heterogeneity in Networks Effects
5.3.1 Gendered Migration Patterns?
In order to go further into the description of migration, heterogeneities in networks effects
deter-minant of migration, it is interesting to explore whether family networks tend to amplify such
a gender bias in migration, or instead, whether networks act as substitutes of such individual
characteristics facilitating migration. Indeed, within the household do women benefit from
fam-ily networks more than men ? There is a priori no reason why household networks would affect
the same way all members of a given household. Gender issues are thus investigated using logit
regressions, whose results are shown in table 10.
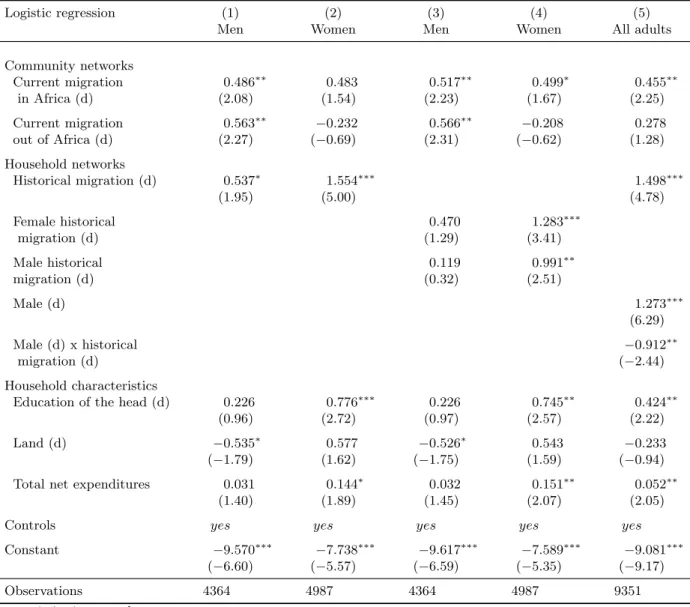
Table 10: Gender issues: logistic regressions at the individual level
Logistic regression (1) (2) (3) (4) (5)
Men Women Men Women All adults
Community networks Current migration 0.486∗∗ 0.483 0.517∗∗ 0.499∗ 0.455∗∗ in Africa (d) (2.08) (1.54) (2.23) (1.67) (2.25) Current migration 0.563∗∗ −0.232 0.566∗∗ −0.208 0.278 out of Africa (d) (2.27) (−0.69) (2.31) (−0.62) (1.28) Household networks Historical migration (d) 0.537∗ 1.554∗∗∗ 1.498∗∗∗ (1.95) (5.00) (4.78) Female historical 0.470 1.283∗∗∗ migration (d) (1.29) (3.41) Male historical 0.119 0.991∗∗ migration (d) (0.32) (2.51) Male (d) 1.273∗∗∗ (6.29) Male (d) x historical −0.912∗∗ migration (d) (−2.44) Household characteristics
Education of the head (d) 0.226 0.776∗∗∗ 0.226 0.745∗∗ 0.424∗∗
(0.96) (2.72) (0.97) (2.57) (2.22)
Land (d) −0.535∗
0.577 −0.526∗
0.543 −0.233
(−1.79) (1.62) (−1.75) (1.59) (−0.94)
Total net expenditures 0.031 0.144∗ 0.032 0.151∗∗ 0.052∗∗
(1.40) (1.89) (1.45) (2.07) (2.05)
Controls yes yes yes yes yes
Constant −9.570∗∗∗ −7.738∗∗∗ −9.617∗∗∗ −7.589∗∗∗ −9.081∗∗∗
(−6.60) (−5.57) (−6.59) (−5.35) (−9.17)
Observations 4364 4987 4364 4987 9351
t statistics in parentheses
Controls included are age and age squared, household size and composition variables, sex and age of the head and geographical controls
∗
p < 0.10,∗∗ p < 0.05,∗∗∗p < 0.01 Source: PSF Data collected in 2006.
In the first four columns of table 10, logit regressions are run separately for men and women.
affects the probability of women to migrate whereas both are significantly correlated with a
higher probability to migrate for men (column one and two). Conversely, the coefficient on the
household network variable is larger and more significant for women than for men. In the next
two columns, family networks are disaggregated depending on their gender composition into
female and male networks. Very interestingly, female migration is positively correlated with
both gendered family network variables. Once disaggregated, on the contrary, family networks
are not found to significantly affect men’s probability to migrate. In addition, a selection of non
networks variables are shown in table 10. Separate regressions on male and female subsamples
emphasize a number of differences in male and female migration patterns. On the one hand,
indeed, when the head of the household has at least some primary education, women are found
to be more likely to migrate whereas this positive correlation is not significant for men. On
the other hand, wealth variables do not symmetrically affect men’s and women’s probability
to migrate: female migrants are more likely to come from richer households, and men are less
likely to migrate when the household has land assets. This latter finding should be related to
inheritance issues, land assets being most frequently transmitted to male heirs, thus given the
responsibility to exploit them.
In column five, the male dummy variable is interacted with the aggregate household
net-works dummy variable in order to study whether family netnet-works are more useful to men or
women. While the male dummy and the household historical migration dummy are both
pos-itively correlated with the probability to migrate, the coefficient on their interaction term is
negative and significant, suggesting a substitution effect between being a man and having
fam-ily networks. Although, as noted above, interpretation of coefficients on interacted variables in
a non-linear framework might be taken cautiously, I can be reasonably confident in the validity
of these results since counterfactual analysis bring consistent elements : household networks
seem to be (slightly) more efficient for women than for men20. Therefore, female migrations are
found to apparently rely more on household networks and less on community networks. This
finding is consistent with the observation that a non negligible share of female migrants move in
20
Indeed, the estimated probability to migrate for female adults with no family networks is 1.18%. Had these women benefited from family networks, this estimated probability would be multiplied by 2.4 (2.83%). Had they been men without networks instead, all their other characteristics being unchanged, their estimated probability would be 3.07%. Finally, had they in addition benefited from family networks, this latter estimated probability to migrate would be multiplied by 2.28 (7.00%). The comparison between the estimated probabilities to migrate for these counterfactuals suggests that household networks may be slightly more efficient for women than for men, although the difference might not be large enough to be considered statistically reliable.