This project is funded by the European Union under the 7th Research Framework Programme (theme SSH) Grant agreement nr 290752. The views expressed in this press release do not necessarily reflect the views of the European Commission.
Working Paper n°60
EICT MICROSIMULATIONS: PUBLIC POLICY
INITIATIVES FOR MEXICO TO TACKLE
POVERTY
Araceli Ortega Díaz
Government School of Tecnológico de Monterrey
1
EICT MICROSIMULATIONS: PUBLIC POLICY INITIATIVES FOR MEXICO
TO TACKLE POVERTY1
Araceli Ortega Díaz2
Abstract
This paper estimates a Heckman correction equation to perform simulations of an earned income tax credit (EITC) program for single mothers, using an income and expenditure household survey to assess the poverty reduction. The results show that poverty decreases at least four percentage points more with this program than with the current cash transfer program “PROSPERA”, and at 20% of the cost. In addition an income tax credit program fosters women formal employment by 10.8% and increase government revenue, concluding that this could be a better strategy for tackling extreme poverty in a sustainable way, and at lower public cost.
Key words
Poverty, Cash Transfers, EITC JEL (I32), (I38), (H24), (H31)
1 The author thanks the NOPOOR Project financed by European Commission under FP7 framework, www.nopoor.eu; the comments during the NOPOOR annual meeting in Dakar, the XXIV Mexican Colloquium of Mathematical Economics and Econometrics, the Dial-IRD Conference Barriers to Development and the staff at the of Ministry of Development Ciclo de Conferencias sobre “Pobreza, Desigualdad y Política Social en México 2015”, The IMA 2015 conference and the LACEA-2015 annual meeting, and the WEIA.Chile 2017. The author thanks to the research assistants in different stages of the research, Valeria Serrano, Francisco Castellanos, Gerardo Islas, Rodrigo Morales and Gerardo Gutiérrez and the NOPOOR member Javiera Selman for his help with the stata program so that we can compare Mexico and Chile in the future.
2Research-Professor of the Government School of Tecnológico de Monterrey, [email protected].
2
I. INTRODUCTION
The Mexican government has set several public policies to reduce poverty in the last decades. One of the most well-known programs, given its careful design, transparency and available evaluations, is the human development program PROSPERA (previously known as OPORTUNIDADES), which has currently more than 5.2 million families as beneficiaries (around 25 million people, approximately one quarter of the Mexican population and about 50% of the people in income poverty).3 This program gives Conditional Cash Transfers
(CCT) every 2 months to the mother of the children who attend school at least 85% of the time and has her family’s health revised in periodical medical appointments, together with nutritional supplements for pre-schooler children. The cash transfer amount depends on the sex of the children enrolled in school, females received a higher amount than males. The amount of the CCT rises as students graduate each year from grade 3 of primary education to the last year of high school (middle education), therefore eligible families have children from 8 to 22 years old that attend school. Very recently, from September 2014, PROSPERA includes students enrolled in higher education.
So far this program, has been successful in improving basic health indicators, increase basic and middle education enrolment, and basic education completion (J. R. Behrman, Sengupta, & Todd, 2005) and decreasing agricultural work on boys (Jere R. Behrman, Parker, & Todd, 2011). Notwithstanding, this program has failed in graduating families out of poverty, insert poor people into the labour market after graduation and therefore it generates a dependence
3 Based on patrimony poverty line, which considers poor a person whose per capita household income is lower
than the cost of a bundle that includes the food basket plus the costs of education, transport, health, dressing and housing in Mexico.
3
on the welfare state transfers. Most of the families that joined as beneficiaries in 1997 are still beneficiaries.
This study main´s motivation emerged from the fact that after 19 years of using cash transfers in Mexico, and not graduating people out of poverty it is necessary to move to programs that can effectively graduate them in a more sustainable and inclusive way, it means that the government could implement programs according to family structure and graduating them so they can transit to programs that assure they will graduate out of poverty. According to (Agostini, Selman, & Perticará, 2013) , developed countries like Canada, United States, Austria, Australia, Belgium, Finland, France, Finland, Germany, Greece, Italy, Netherlands, New Zealand and the UK have stablished programs with employments components that fight poverty more effectively than cash transfers due to their influence in generating sustainable income. One of these programs is the Earned Income Tax Credit (EITC), implemented since 1975 in United States, the New Zeeland´s Working for Families Tax Credit in 1984 and the UK´s Working Tax Credit in 1999. Consistent with (Eissa, N., Kleven, H. J., & Kreiner, C. T., 2008) this type of program is a proof that tax and subsidies can influence labour participation and reduce poverty levels. Moreover, there are finding about EITC having help the children of beneficiaries to perform better in school measured by several standardised tests, also are more likely to attend university and have higher wages, plus . This has help women to increase their wage and infants to improve their health (Marr & Huang, 2014)
In the current research, it is analyse whether an EITC program for single mothers would be more effective reducing poverty in comparison with cash transfer programs. The selection of simulated beneficiaries is done to compare it to PROSPERA which gives the CCT to mothers, and it would be a more convenient comparison for this group.
4
In the following sections the poverty and employment indicators of the situation in Mexico are presented, and the evidence of results that impact evaluations have found of PROSPERA in Mexico. Then, in sections 4 to 6 the EITC is explained, then constructed, and simulated for Mexico. In section 7 the results are discussed. Finally, section 8 presents some public policy recommendations and conclusions.
II. AN OVERVIEW OF THE MEXICAN ECONOMY, EMPLOYMENT AND
POVERTY.
México is a developing country that has advanced towards economic stability and human international commitments. Nevertheless there are many challenges to be overcome as social problems arise when development is not inclusive.
Mexico has growth despite the 2008 mortgage crisis in the US. There has been population and GDPPC growth, but this growth has not been equally distributed among household income deciles, lower income households are still growing in number of members at larger rates than higher income households, and poverty has increase since 2006. Mexico´s annual average growth from 2000 to 2014 has been 1.15%, and 1.04% since 2006. In the same period, the exchange rate with Mexico´s main economic partner (USA) has oscillated from 9.30 to 13.5 pesos per dollar but since January 2015 has risen almost to reach euro standards at 19 pesos per dollar. Government revenue has decreased due to oil prices plumbing and oil revenues being the first source of government income.
5
An economy like Mexico, even with macroeconomic stability lacks from providing decent work to its population, which is the source of a sustainable income that can lead people out of poverty. A recent research on this subject (Ortega Díaz, 2013) shows that about 27.1% Mexican workers between 12 and 65 years old, have non-decent work, which according to ILO´s definition, this means they have some of their labour rights not accomplished, including a wage below the minimum standard. The research shows that 67.6% of Mexican workers suffer at least one violation to their labour rights, where the more frequent violation is social security and family safety (nursery, maternity leave and time devoted to children). Although the study do not dig into the roots of decent work, it shed light on one major problem, many of the workers are in the informal market, they do not pay taxes and have not social security number, that make the fiscal and economic system week.
Mexico presents low unemployment rates, because unemployment, different from European countries, is measured by counting people that in a national employment quarterly survey ENOE (INEGI, 2012) answered that they did not work last week. However, if people worked, even an hour last week and received payment, let's say an informal car washer, that person is counted as employed in the survey. For example, in 2005 there were 2.63 million people without work and 39.45 million employed, and in 2010, 2.71 and 44.53, respectively, see Graph 1. This contrast with the high rates of informal labour. For instance, in 2010, one of the poorest States like Oaxaca in the south have lower unemployment rates 2.6% than a richer State like Nuevo León 5.7%, but 81.2% of Oaxaca´s workers were informal meaning they do not pay taxes, whereas for Nuevo León 39.5% were informal. Informality can mean in many cases, poverty and uncertainty.
6
GRAPH 1.
Mexican labour force by their employability status, millions of people.
Source: own elaboration using ENOE data.
These facts are a second motivation for this research, because a policy that fosters labour insertion in the formal sector would help both, the sustainable income of families and the government revenue to finance at least social security. The state of the art now is that poor household´s with workers are very unlikely to be in the formal sector, and poor households would have less incentives to participate in the labour market if their income net of taxes is negative. Incentives to participate in general in the formal labour market, for women, are related with access to nursery, maternity leave, health services, mortgage services and a pension, but when costs of participation in a daily basis are higher than benefits, agents, either
119.9 80.3 30.4 9.1 50.0 30.3 47.3 2.7 104.1 67.2 30.3 6.6 41.1 26.1 39.4 1.6 - 20.0 40.0 60.0 80.0 100.0 120.0 140.0 Population in working age (>= 14, <65)
Population less than 14 years Population >= 65 years Belongs to labor force Do not belong to labor force With Occupation Without any Occupation
To tal P o p u la tio n P o p u latio n a cc o rd in g to age P o p u latio n ac co rd in g to ec o n o m ic situ a tio n P o p u latio n Eco n o m ica ll y A ctiv e
7
poor or non-poor do not see the formal labour market as an option (Eissa, Kleven, & Kreiner, 2008a). Moreover, a poor agent that sees the negative income, would prefer to receive a CCT without working, therefore, as long as these CCT provide health and nutrition services, and complements as nursery4, pension for the elderly who are poor, 5 and a wider range of free
health services, 6 the incentive to work in the formal labour market is almost null.
These facts, may explain why PROSPERA families have not incentives to graduate from this program after 19 years, and keep depending on the welfare system. Mostly if the participation of women in the labour force is conditional on the number of children they have, as we see in Graph 2, single females with children change they labour participation with the number of children. First, the presence of one children is related with 65% of participation, this can be due to the fact that the forgone income of one children is not as high as the forgone income to feed three children, this is seen in Graph 2, an increase in the labour participation of single mothers with one to three children; for a fourth child the participation decreases. Five or more children decreases participation strongly.
Participation, not only depends on the number of children but also in the skill level. It has been calculated that about 90% of poor men and women who work are non-skilled workers, whereas 25% of non-poor workers can be considered skilled. This characteristic restrict the access to the formal labour, as the National Statistics show (INEGI, 2013), the contribution
4 Social development nurseries for working mothers who are poor.
http://www.sedesol.gob.mx/en/SEDESOL/Programa_estancias_infantiles
5 Social development program of pensions
http://www.sedesol.gob.mx/en/SEDESOL/Pension_para_adultos_mayores
Social and health protection system 6
8
to labour services is higher in areas where there are more skilled workers like the scientific sector, legislation and government sectors, whereas the lower productivity is in manufacture, where many young women are employed.
GRAPH 2.
Single women who work as a proportion of the total single women, 14 year old or more, according to the number of children born alive to them.
Source: Author´s own elaboration using ENOE quarterly data.
Skills are related to years of schooling and experience, and the average year of schooling that single women have vary as well if we consider geography and size of the regions, as shown in Table 1, women who are employed have more years of schooling than unemployed women. The difference in years of schooling increases from 2.1 to 3.1 in localities from 2500 to less 15,000 inhabitants and then decreases to 1. The highest average years of schooling attained by single mothers who work is 10.6 years which is equivalent to reaching the second
0.42 0.47 0.52 0.57 0.62 0.67 0.72
9
year of high school, and 9.6 years for the unemployed, this situation is not different for the rest of the population which usually dropout studies when entering high school.
TABLE 1.
Average years of schooling of single mothersa by size of locality and contractual situation.
Number of inhabitants Employment
status
Less than 2 500 2,500 to 14,999 15,000 to 99,999 100,000 and more
Unemployed 4.0 4.7 6.6 9.6
Employed 6.0 7.8 8.2 10.6
Difference 2.1 3.1 1.7 1.0
Note a: Single mothers include unmarried, divorced and widow women without the presence of a male couple. Source: Own estimation with data from ENIGH 2014
To relate poverty, informality , economic sector, education, civil status, age and female participation in remunerated labour, (Cardero, Espinosa, Straffon, Junco, & Savage, 2010) link all these variables in ballots to determine their relation and they conclude that in the formal sector, women that work have less than 3 children in comparison with the ones that work in the informal sector. Poor women working in the informal sector have three or more children, and are associated with the agricultural sector, they have education less than primary school and are younger than 20 years old, whereas the poor women that work in the formal sector, are older than 50, single without children and work on manufacture. These
10
authors observed that women have lower wages than their male counterparts and differences are exacerbated for young poor women in the informal sector. The informal sector is chosen by women in a myopic way as they found it flexible, work less ours, it may be close home, but the informal sector is found to be set generally in more precarious conditions, smaller facilities, concentrated in services and commerce, domestic workers and restaurants, which implications are that reduce the long term income, affect health, and restrict the human capital accumulation. These authors conclude that there should be fiscal incentives and credit to enterprises to support decent job and decrease poverty and informality.
The report of CONEVAL (2015) shows that in the last decade poverty have worsened. Despite the fact that there are at least 20 social programs with national coverage, poverty rates have not decrease. For instance, the extreme poverty (food poverty)7 has risen from 14% in 2006 to 20.5% in 2014 that is approximately 7.6 million of Mexicans entering into extreme poverty in the last two presidential administrations. As shown in Table 2, the situation of single mothers is not different, currently 45.4 % are poor and the difference between women who work and who don’t work is 2.2 percentage points.
This phenomenon is aggravated by the fact that the gap between the people in food poverty and patrimonial poverty has widen, as shown in Graph 3. In 2006 this gap was of 28.9
1. 7 Food poverty line: counts the number of people that even when using all their disposable income
cannot afford the food basket.
2. Capabilities poverty line: counts the number of people that even when using all their disposable income cannot afford the food basket, health and education services.
3. Patrimony poverty line: counts the number of people that even when using all their disposable income cannot afford the food basket, health, education services, clothing, housing and transportation.
11
percentage points and in 2014 is 34.6, which in number of persons translates into 31.4 and 41.5 million respectively.
TABLE 2.
Distribution of women by employment status and poverty
Unemployed Employed Total
Food poverty Non-poor 85.0 85.7 85.5 Poor 15.0 14.3 14.5 Total 100.0 100.0 100.0 Capabilities poverty Non-poor 77.9 78.0 78.0 Poor 22.1 22.0 22.0 Total 100.0 100.0 100.0 Patrimony poverty Non-poor 53.0 55.2 54.6 Poor 47.0 44.8 45.4 Total 100.0 100.0 100.0
12
This gap has steadily increase through time in number of people in poverty, meaning that the inequality among poor has widen. In percentage terms is very interesting to see how this gap was closing from 1992 to 2005 and then increasing. Therefore, if poverty is increasing and the gap among the types of poverty widening, it seems that social programs are not working as they should. In the case of the CCT program PROSPERA, the many impact evaluations in their components conclude that this program has been effective in increasing school enrolment and years of schooling in children and teenagers between 8 and 22 years old (Jere R. Behrman et al., 2011), and basic health and Nutrition. What it has not been effective in, is graduating families out of poverty.
GRAPH 3.
Gap between top and bottom Income Poverty Lines
Source: own elaboration using CONEVAL data.
28 29 30 31 32 33 34 35 0 5 10 15 20 25 30 35 40 45 1992 1994 1996 1998 2000 2002 2004 2005 2006 2008 2010 2012 2014 M il li on s of p er son s in p ove rty
Gap between food and patrimony poverty (million of people) Gap between food and patrimony poverty (%)
% of p eop le in p ove rty
13
III. CONDITIONAL CASH TRANSFER PROGRAM PROSPERA.
To describe the impact of PROSPERA in reducing poverty, each component of the program has to be assessed: education, health and nutrition. Within the education components, the program has the project of stimulating adult education “Proyecto de Estímulos para el
Desarrollo Humano y las Capacidades de los Adultos (EDHUCA) 2012”. According to its
evaluation, the program has 25 million beneficiaries within PROSPERA families from this universe it has been found that “six million people in working age (between 15 to 39 year
old) have not conclude basic education and more than 504 thousand cannot read nor write. Adults older than 40 year old, who are about 2.5 million, are non-literate (1.1 million) and only 360 thousand have completed primary education”.(López P., 2012).
With respect to the health component, the beneficiaries and non-beneficiaries (INSP, 2014), have no significant difference in their health status for the following indicators:
1. Diarrea (rural and urban) 2. Low weight for the age.
3. Short height for the age (“Emaciación”)
4. Anemia in non-pregnant women (12 to 49 years old) 5. Anemia in pregnant women (12 to 49 years old)
Regarding the schooling performance (Valora, 2012) shows that the difference among beneficiaries and non-beneficiaries between 2008 and 2011,results in a higher performance in the standardised ENLACE test, but there is still a gap when they graduate from primary education “21%, in 2008 attained 61.8 points in ENLACE and in 2011 48.8 points”.
14
It is worth to point out that from both studies, health and primary education performance, the second do not performed an evaluation with control and treatment group, and that ENLACE test should not be averaged as it assesses different subjects like maths and Spanish.
There is, however an accumulative evaluation 2007-2008 of (Campos B., 2012) that is more positive with respect to the impact of the program, where it is argued that the nutritional supplements have an impact in children and that the mobility of indigenous beneficiaries is positive because they switch from non-paid to paid labour; but the lack of opportunities in their villages push them to migrate. Table 3 shows a summary of the impacts; as we can observe almost 25% of Mexican population is beneficiary of PROSPERA, this is almost 50% of the poor population (considering the patrimony income line).
TABLE 3.
PROSPERA Beneficiaries
Source: own elaboration.
Population in
2012 115 million Mexicans
19.7% in food poverty (22.66 million people) 28% in capabilities poverty (32.2 million people) 52.3% in patrimony poverty (60.15 million people)
Beneficiaries 5.2 million Families (25 million people.)
1. Enrolment and attendance: Primary, Secondary and Upper secondary. Higher education from September 2014.
2. Basic Health Services 3. Nutrition
Increase in school enrolment and attendance, but low performance. Increase in terminal efficiency
No impact Educational quality, employability and leave poverty
Poor
Components
15
The debate about conditional cash transfers impact on the labour force participation has been long. Some researches argue that the behaviour of household heads change as they are no willing to leave the CCT benefit, and this attitude inhibits mothers labour participation (Arce, Bando, & Freije, 2006), some others argue that CTT helps children not to work in the agricultural sector(Jere R. Behrman et al., 2011). There are no clear evidence showing that the program has been able to impact in graduating beneficiaries out of poverty, and even with these diagnosis the government has kept the families in the program for years, and recently has incorporate even more from the food program PAL.8At the same time the Budget of the program is currently more than 63,000 million pesos (2014), almost double than in 2013 with 36,177 million, and 2012 with 34,941 million.
GRAPH 4.
PROSPERA budget (right) and Families supported (left)
Source: Own elaboration using data from 2nd Government Report, 2013-2014.
8https://www.prospera.gob.mx/Portal/ 1,000 2,000 3,000 4,000 5,000 6,000 7,000 10,000 20,000 30,000 40,000 50,000 60,000 70,000 80,000 2000 2001 2002 2003 2004 2005 2006 2007 2008 2009 2010 2011 2012 2013 2014 Prospera Budget (Millions of MXP) Families supported by Prospera (000)
16
The increase in the budget and the number of beneficiaries is shown in Graph 4, it can be easily calculated that the annual average budget for families has grown from 3.6 thousand to 11.6 thousand pesos, in current prices (see Graph A1 in the appendix). The current research, for purposes of dimensioning the costs, compares this budget with the one that could be invested in an Earned Income Tax Credit program, and analyses if this type of tax would decrease poverty.
IV. EARNED INCOME TAX CREDIT (EITC)
The public policy of Earned Income Tax Credit (EITC), has been implemented since 1975 in United States; it is a reimbursed fiscal credit that yearly rewards the labourer in a household. The target population is low income families. The amount of the credit is calculated based on labour income of the family, and conditional on workers labour participation counting the total taxable income. If the credit is higher than the tax, the family receives a cash transfer in their annual income declaration, (Agostini, Selman, & Perticará, 2013).
The benefit that each family receives depends on their household income, marriage status, and number of eligible children. There are three phases to be considered to provide the benefits: the phase in, the flat phase and phase out. In the first segment the EITC ( t ) behaves as a subsidy proportional to wage (w), and in the second segment it is a fix amount, let’s say (t-fix) , the third segment is proportional to wage and it decreases as income increases.
17
Following (Agostini et al., 2013) and (Eissa, Kleven, & Kreiner, 2008b), we re-draw Graph 5 which presents the budget constrain of a single parent family (where the initial budget before EITC reflects the situation where she/he is exempt of paying taxes; in point A the person does not work and has a utility level ( 𝑢0). If the person that does not work receives a
credit, similar to a conditional cash transfer (CCT) expanding her non-labour income, its budget constrain moves to the right and reaches a higher utility level (𝑢1) point B. If in the
initial point the person already works, the CCT would have an income effect that will be associated with an increase in leisure hours (reducing her working hours) and increasing her consumption. If in the initial point the person does not work, but she/he decides to work under the EICT program, this will give her/him access to a higher utility level, point C in the utility curve (𝑢1).
EICT has been analysed in several publication of (Eissa & Nichols, 2005)and (Eissa & Hoynes, 2004) and have observed effects in the extensive margin and in the intensive margin. The authors mention that the extensive margin effect is important because it accounts for the number of possible workers that can be incorporated to the labour force with this policy, whereas the intensive margin applies to those who are already working and may increase or decrease their hours worked due to the subsidy.
18
Effect of EITC and CCT on budget constrain.
Source: own elaboration based on Agostini et al., 2013.
In the current research the analysis is focus in the extensive margin because it is the aim to account for those women that could be incorporated into the labour force using this type of policy while keeping those that already work and qualify as beneficiaries. EITC could be used as an incentive for single mothers whose children are not yet eligible for PROSPERA, this means children younger than 9 years old or that do not yet reach third grade of primary education or older children (teenagers) who do not study. In addition EITC could be used for
B C
A
Hours worked / Leisure
Consumption / Income 0 Phase in w(1+t) Flat region w Phase out w(1 - t)
19
mothers who have PROSPERA but want to enter the labour force, or are in the informal sector and want to become formal.
Without loss of generality the simulation in next section is performed for single mothers with children of all ages, but controlling for the age bracket of the children.
V. SIMULATION METHODOLOGY
The methodology of (Eissa et al., 2008b) is followed to estimate an equation that identifies women with characteristics that are likely to be incorporated in the Mexican labour force, these characteristics are related to schooling level, experience, age, geographical area and number of children. To predict the labour income of those that do not work a wage equation in logs using Heckman (1979) selection equation is estimated.9 Estimating this equation
corrects the bias caused by the decision of participating in the labour force. The simulation consists in four consecutive stages. First the taxable income and the amount of tax that each person should pay is calculated because the EITC is based on the wage and the rest of the
9 Based on Heckman, the first stage consists in estimating a Probit model of labor participation:
𝑃𝑟𝑜𝑏(𝑆𝑖= 1| 𝑍𝑖) = Φ(𝑍𝑖𝛾)
S equals one for those who work, and Z is a vector of socioeconomic variables that determine whether the person would work or not. In the second stage consist in estimating the amount of wage and the Mills ratio is introduced as regressor:
𝐸(𝑌𝑖| 𝑋𝑖, 𝑍𝑖, 𝑆𝑖= 1) = 𝑋𝑖𝛽 + 𝜌𝜆(𝑍𝑖𝛾), con 𝜆(𝑍𝑖𝛾) = ϕ(𝑍𝑖𝛾) Φ(𝑍𝑖𝛾)
For those who do not work we assume a distribution of the error with zero mean and variance equal to the variance of the error of people that work.
20
taxable income.10. Table 4 shows the two official definitions of taxable income by two
Mexican government institutions: the Treasury (SHCP) and the National Council of Evaluation of the Social Policy (CONEVAL), the latter is the institution in charge of calculating the official poverty measures, and for that duty, it has to calculate an official income measure of the households. Therefore, the net income of households I calculated according to CONEVAL, and the tax rates calculated using the SHCP official laws.
TABLE 4.
Taxable Income according to several definitions
Source: CONEVAL and pages 95-97 of (SHCP, 2015)
10 The source is the Income and Expenditure Household Survey of Mexico (ENIGH-2014), and the taxable
income is based on the Treasury Ministry regulation.
Net income Gross income Investments income
Monetary income plus the non monetary income, minus the gifts
given by the household.
Monetay income plus the non monetary income.
Interests from fixed terms investments, interests from loans,
interests from saving accounts and yields from bonds and
warrants.
Labor income from professional activities and rentals, income from
corporate activities and interests, (pp.96).
Labor income, income from professional activities and rentals, income from corporate activities, interests and contributions to social
security, (pp 95).
Interest on fixed maturities, from savings accounts and loans, (pp.
97). CONEVAL
21
The second step consists in calculating the annual amount of credit to be reimbursed to those female workers that accomplish the EITC requirements based on age, number of children and income. This amount depends on the hours worked for those who participate in the labour market. For those who do not work, the wage prediction is used and it is assumed that they will be willing to work 20 hours weekly as a way to incorporate initially to the labour force.
In the third stage, once net income and the income tax to be paid are calculated, the amount of tax credit is estimated and the beneficiaries of the program identified. Then the percentage variation with respect to the initial income is computed. This paper focus on single mothers, this means women in working age that are single, widow or divorced and there is not a male partner in the household that provides income for them, and their low income made them eligible to be EICT beneficiaries. In the case of eligible women that do not work, the labour participation probability is used to select them, if it is higher than 0.5 the person is assumed to enter the labour force 𝑃𝑟𝑜𝑏(𝑆𝐸𝐼𝑇𝐶 = 1) ≥ 0.5, and receive EITC.
Two strong assumptions are, first that there exists labour demand for women who want to work. This may affect women´s wage due to competing in the market for a job. Notwithstanding a minimum wage should be set as a floor, in the case of Mexico this is relevant as the labour reform and the initiatives are voting in favour of raising minimum wage. Second, is assumed that the costs of participating in the labour force are zero, this is a strong assumption and is extensively discussed in (Eissa et al., 2008b). If she is selected to work, the household labour income is the sum of worker´s wage and the amount of EITC received.
22
Gross labour income is initially zero for those women who do not work and it becomes positive when the person works after the EITC program is implemented. Denote the wage for women who enter the labour force as (wEICT ), it is assumed that at the beginning of the
policy, women that are new in the labour force will provide 20 hrs of work per week, that is a half time, 𝐻𝑜𝑢𝑟𝑠𝐸𝐼𝑇𝐶 = 20. Therefore ZEICT 20 *wEITC
Where the change in household labour income is the sum of the monthly wage of members who work, less taxes and plus EITC received, discounting the unemployment benefits forgone in case of joining the labour force, which in the case of Mexico, they are almost non-existent. The fourth and last stage of the simulations consists in re-estimating poverty and compare the effect of the program.
VI. DATA
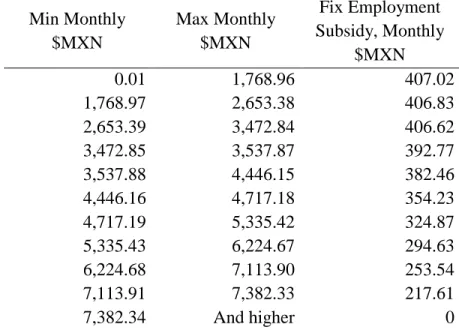
The limits of the official taxable income is shown in Table 5 this are used to estimate the payable income tax according to the income tax limits using the Income Tax Law published in the Official Journal of the Mexican Federation on May 25th 2012, which establishes that the tax amount to be paid should abide to the limits in Tables 5 and 6. Where (TA) is the Tax Amount to be paid, (FA) is a Fixed Amount, (ISR) is the Income Tax Rate, (I) is the earned income and (BL) is the Lower Bound. Earned Income (I) determines the (FA) and the (ISR) according the income bracket.
*( )
i i i i i
23
TABLE 5.
Limits of the income tax (ISR) Min Monthly $MXN) Max Monthly $MXN) Fix Monthly $MXN) ISR (%) 0.01 496.1 0.0 1.9 496.08 4210.4 9.5 6.4 4,210.42 7399.4 247.2 10.9 7,399.43 8601.5 594.2 16.0 8,601.51 10298.4 786.5 17.9 10,298.36 20770.3 1090.6 21.4 20,770.30 32736.8 3327.4 23.5 32,736.84 higher 6,142.0 30.0
Source: Tax Law of Mexico, 2012
TABLE 6. Limits for tax subsidies
Min Monthly $MXN Max Monthly $MXN Fix Employment Subsidy, Monthly $MXN 0.01 1,768.96 407.02 1,768.97 2,653.38 406.83 2,653.39 3,472.84 406.62 3,472.85 3,537.87 392.77 3,537.88 4,446.15 382.46 4,446.16 4,717.18 354.23 4,717.19 5,335.42 324.87 5,335.43 6,224.67 294.63 6,224.68 7,113.90 253.54 7,113.91 7,382.33 217.61 7,382.34 And higher 0
24
The parameters for Mexico are based in EITC scheme of US in 201211 which is the year of
the most recent limits of ISR in Mexico.
2012 2012
*
_
2012/ 2012MXN USD MXN USD
EITC
EITC
Exchange rate
Table 7 shows the limits to be received of EITC for a household were the female is the household head or live alone and has no income from a male partner. The household may rank from zero children, meaning the female lives alone, to a single mother living with three or more children, and or with other family members (except a partner), but where the sum of the household income does not surpass the limits marked on the Table 7.
TABLE 7.
Income schedule, Rates and Credit amount proposed for Mexico Annual income by household (x) Segment Credit (3 children)
0 - $32476.07 First segment 45% * x
$32476.07-$42400.01 Flat phase $14,618.79
$42400.01-$111793.11 Third segment $14,618.79- 21.06% * (x - $42,400.01)
Annual income by household (x) Segment Credit (2 children)
0-$32476.07 First segment 40% * x
32476.07-$42400.01 Flat phase $12,988.25
25
42400.01-$104082.21 Third segment $12,988.25- 21.06% * (x - $42,400.01)
Annual income by household (x) Segment Credit (1 children)
0-$23122.76 First segment 34% * x
$23122.76-$42400.01 Flat phase $7,860.53
$42400.01-$91597.91 Third segment $7860.53 - 15.98% * (x - $42,400.01) Annual income by household (x) Segment Credit (no children)
0-$15406.91 First segment 7.65% * x
$15406.91-$19277.24 Flat phase $1,178.64
$19277.24-$34684.15 Third segment $1,178.64 – 7.65% * (x - $19,277.24)
Source: author´s own calculations using different sources.
With respect to the data in the households’ survey, there are 2701 observations of single mothers and women alone, who are equivalent to 4,495,456 million women alone. See the summary in Table 8. From this sample, women who work are 72.8%, and the 65.58% of them concentrate in four sector sectors, which are retail trade (19.09%); manufacture (12.79%); accommodation, food, and beverages services (13.78%); and other services (repairing, beauty, associations, household work) except Government (19.92%). See Table A2 in the Appendix.
26
TABLE 8.
Women alone, widow, single and divorce.
Civil Status
Member type
Head Alone Total
Divorced 1,970,777 240,199 2,210,976 Widow 989,435 176,080 1,165,515 Single 827,253 291,712 1,118,965 Total 3,787,465 707,991 4,495,456 Source: Own elaboration using ENIGH 2014
VII. ESTIMATION RESULTS
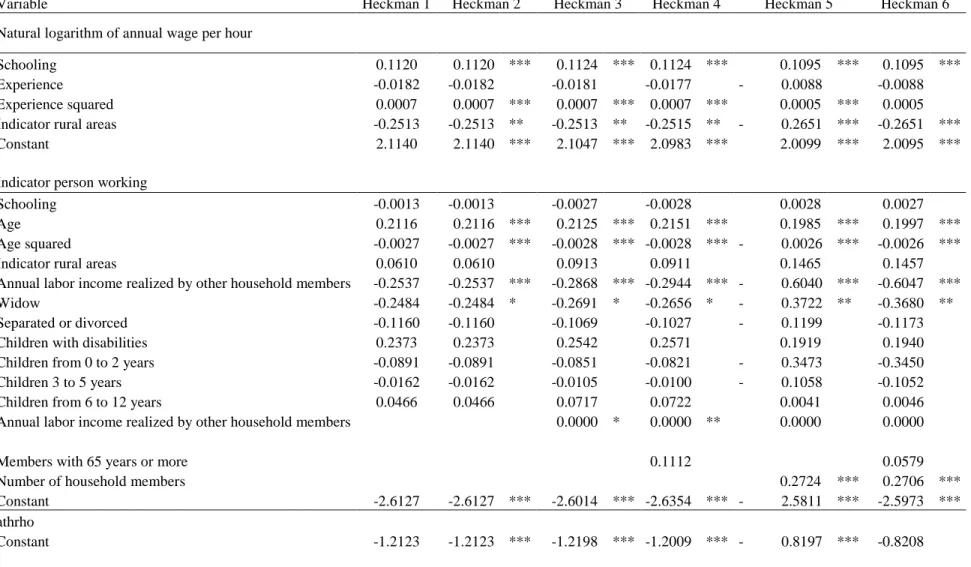
We specify six different estimations of the Heckman equation taking into account the number of hours and income labour that workers receive, a different selection variables, see Table A1 in the appendix. Finally we chose estimation six in the last column of Table A2 for being more precise, showed in Table 9. We use this equation to estimate the probability of participating in the labour force. As explained in previous section, all women whose probability of working is above 0.50 are inserted in the labour force. Those inserted are assumed to work 20 hours per week, and receive a gross wage equal to their counterparts that work.
27
TABLE 9.
Heckman selection model
Variable Natural logarithm of annual wage per hour Indicator person working Schooling 0.109 0.003 (15.29)** (-0.3) Experience -0.009 (-0.61) Experience squared 0 (-1.48)
Indicator rural areas -0.265 0.146
(3.54)** (-1.64)
Age 0.2
(7.88)**
Age squared -0.003
(9.19)**
Annual labour income realized by other household
members 0
(-0.77)
Other income recipients -0.605
(4.84)**
Widow -0.368
(2.86)**
Separated or divorced -0.117
(-1.11)
Children with disabilities 0.194
(-1.2)
Children from 0 to 2 years -0.345
(-1.85)
Children 3 to 5 years -0.105
(-0.74)
Children from 6 to 12 years 0.005
(-0.06)
Members with 65 years or more 0.058
(-0.37)
Number of household members 0.271
(4.50)**
Constant 2.01 -2.597
(9.72)** (4.83)**
28
t statistics in parentheses
* significant at 5%; ** significant
at 1%
Source: Own calculations using ENIGH-2014
TABLE 10. Results of simulation
Employment Status before EICT Persons Percentage
Women not working 1,222,590 27.2%
Women working 3,272,866 72.8% without payment** 888,111 27.1% with payment 2,384,755 72.9% Total 4,495,456 100%
Employment Status after EICT Persons Percentage
Women not working 737,362 16.4%
Women working 3,758,094 83.6%
without payment** 888,111 23.6%
with payment 2,869,983 76.4%
non- beneficiaries of EICT 79,052 2.8%
beneficiaries of EICT 2,790,931 97.2%
Total 4,495,456 100%
Inserted to labour force 485,228 10.8%
** There is a variety of cases of women who declare working and received
No payment this category should be studied further.
Using this approach we have 485,228 women inserted in the labour force and 2,790,931who received EITC. This beneficiaries cost the government $ 7,187,168,768 MX pesos, this is an
29
average of $ 2,575.1868 per family head per year, to get an idea, and this is about a fifth of the cost of PROSPERA that on average provides 11.6 thousand pesos per family. It is seen in Table 10 that the new labour force of women is 10.8%, because before EITC was 72.8% and after EITC is 83.6%. These women are mostly in four sectors of the economy as we said before (see Table A1), therefore if this strategy is implemented with enterprises and firms in those sectors in a partnership with the government, these women would receive the EICT annually, as a subsidy of working formally. These women would receive their labour income and as being part of the formal labour market, they are entitled to benefits of social security, health, nursery, maternity live and holidays.
Finally, the net income of the family is calculated. This calculation is done for four simulations, first for the family non-receiving neither PROSPERA nor EITC, then receiving just PROSPERA, then receiving EITC and then receiving both. The population of single mothers and women alone have a total poverty of 46.4%, PROSPERA would only decrease 1 percentage point their poverty, whereas EITC would decrease in 14.1 percentages points the poverty. And if both are combined poverty would decrease 15.1 percentage points.
TABLE 11.
Poverty measures with and without transfers
Income Poverty Measure Net Income calculation Food Capabilities Patrimony
Without CCT nor EITC 16.3% 23.9% 46.4%
With Prospera 14.5% 22.0% 45.4%
With EITC 10.7% 16.1% 32.3%
30
Source: Author´s own elaboration.
It is very clear than and EICT program would be more beneficial to graduate women out of poverty. In numbers, EITC decrease poverty 14 times more than PROSPERA, and at one quarter of the budget, under the assumption that the treasury SHCP operational costs are the same, and that every women whose skills are the same as those in the market finds a match who employs her.
VIII. CONCLUSIONS
The current research simulated what would happen to poverty indicators in case of implementing an Earned Income Tax Credit (EITC) scheme in Mexico for single women with and without eligible children. The simulation consists in selecting those women who are suitable, according to a Heckman selection equation, to work. Once women are selected, and according to the number of children in the household, we apply an EITC, which acts like a subsidy that is increasing in the first stage with wage and hours work. In the second stage is a flat rate and in the third stage decreases as working women supply more labour and earned higher income.
This process is applied using the household survey ENIGH-2014. The results show that women in extreme poverty before implementing the subsidy was 16.3%, and after the subsidy is 10.7%, and for the patrimony poverty 46.4% and reduces to 32.3% after the subsidy.
If we assume that in a given year EITC inserts 485,228 females into the labour force because they have positive gains, not only coming from the wage but also coming from the subsidy,
31
their families will be better off and the economy will have more workers, unemployment will decrease, and in a formal labour setting these female workers will have more benefits like nursery, maternity leave, pension system and own health security.
In a conditional cash transfers setting women do not contribute to their retirement pension, neither to social security or access to credit for a mortgage. Moreover, EITC could be a better option for the government to tackle poverty rates, mainly for the following reasons:
Cost a fifth of Prospera, so it could be a complement for working mothers. Poverty reduction is faster and decrements are higher.
It is more sustainable as is people acquire more skills while working, as well as social benefits because they work in the formal sector.
Workers contribute to the pensions system, making it more sustainable.
Creates sense of pride by being productive and actively participating in the country’s economy and diminishes stereotypes.
For future work we would like to incorporate women who report working with no payment, and those whose characteristic make them not suitable for the labour market due to geography or skill level; and check whether with EITC they will be better off.
IX. BIBLIOGRAPHY
Agostini, C., Selman, J., & Perticará, M. (2013). Una Propuesta de Crédito Tributario al Ingreso Para Chile. Estudios Públicos, 129, 49-104.
32
Arce, F., Bando, R., & Freije, S. (2006). Conditional Transfers, Labor Supply, and Poverty: Microsimulating Oportunidades. Economía (Fall).
Behrman, J. R., Parker, S. W., & Todd, P. E. (2011). Do Conditional Cash Transfers for Schooling Generate Lasting Benefits? A Five-Year Followup of PROGRESA/Oportunidades. Journal of Human Resources, 46(1), 93-122.
Behrman, J. R., Sengupta, P., & Todd, P. (2005). Progressing through PROGRESA: An impact assessment of a school subsidy experiment in rural Mexico. Economic Development and Cultural Change, 54(1), 237-275.
Campos B., P. (2012). Documento Compilatorio de la Evaluación Externa 2007-2008 del
Programa Oportunidades Mexico: Sedesol Retrieved from
https://www.prospera.gob.mx/EVALUACION/es/wersd53465sdg1/docs/2010/2010_doc_compilatorio2008.pdf.
Cardero, M. E., Espinosa, G., Straffon, b., Junco, J. M., & Savage, D. (2010). El empleo informal desde una perspectiva de género y pobrezaen México. Mexico: Instituto
Nacional de las Mujeres Retrieved from.
http://www.gob.mx/inmujeres/documentos/cuadernos-de-trabajo-sobre-genero.
CONEVAL. (2015). National Income Poverty Evolution, 1992 to 2014.
Eissa, N., & Hoynes, H. W. (2004). Taxes and the Labor Market Participation of Married Couples: The Earned Income Tax Credit. Journal of Public Economics, 88(9–10), 1931-1958. doi:http://dx.doi.org/10.1016/j.jpubeco.2003.09.005
33
Eissa, N., & Nichols, A. (2005). Tax-Transfer Policy and Labor-Market Outcomes. The American Economic Review, 95(2), 88-93. doi:10.2307/4132796
Eissa, N., Kleven, H. J., & Kreiner, C. T. (2008). Evaluation of Four Tax Reforms in the United States: Labor Supply and Welfare Effects for Single Mothers. Journal of Public Economics, 92(3-4), 795-816.
INEGI. (2012). Cuestionario de la Encuesta Nacional de Ocupación y Empleo. Instituto Nacional de Estadística, Geografía e Informática.
INEGI. (2013). Productividad Total de los Factores 1990-2011. Mexico: Instituto Nacional de Estadística y Geografía.
INSP. (2014). Nota explicativa sobre la interpretación de la comparación de resultados en indicadores de salud y/o nutrición entre la población beneficiaria y la no beneficiaria de oportunidades en la encuesta nacional de salud y nutrición (Ensanut) 2011 - 2012.
Sedesol retrieved from
https://www.prospera.gob.mx/EVALUACION/es/wersd53465sdg1/docs/2012/nota_ensanut_2011_2012.pdf.
López P., O. (2012). Evaluación del Proyecto Estímulos para el Desarrollo Humano y las Capacidades de los Adultos (EDHUCA) 2012. Mexico: El Colegio de San Luis Ac.
Marr, C., & Huang, C.-C. (2014). Earned Income Tax Credit Promotes Work, Encourages Children’s Success at School, Research Finds For Children, Research Indicates that Work, Income, and Health Benefits Extend Into Adulthood. Center on Budget and Policy Priorities (March), 1-11.
34
Ortega Díaz, A. (2013). Defining a Multidimensional Index of Decent Work for México. The Mexican Journal of Economics and Finance, 8(1).
SHCP. (2015). Criterios Generales de Política Económica 2016. Mexico: SHCP Retrieved from http://www.shcp.gob.mx/POLITICAFINANCIERA/FINANZASPUBLICAS/Paginas/CriteriosGralesPolEco.aspx.
Valora. (2012). El desempeño de los becarios del Programa Oportunidades en la prueba ENLACE: cambios entre 2008 y 2011 en educación básica y media superior.
Mexico Retrieved from
https://www.prospera.gob.mx/EVALUACION/es/wersd53465sdg1/docs/2012/valora
APPENDIX
GRAPH A1.
PROSPERA: Annual Average Budget per family (MX pesos)
Source: Author own elaboration using data from Prospera. 2,000.00 4,000.00 6,000.00 8,000.00 10,000.00 12,000.00 14,000.00 2 0 0 0 2 0 0 1 2 0 0 2 2 0 0 3 2 0 0 4 2 0 0 5 2 0 0 6 2 0 0 7 2 0 0 8 2 0 0 9 2 0 1 0 2 0 1 1 2 0 1 2 2 0 1 3 2 0 1 4
35
TABLE A1.
Sectors where single mothers work before EITC.
Code Name of the Sector Frequency Percent Accum
11
Agriculture, animal breeding forestry,
fishing and hunting 205,099 5.71 5.71
21 Miner 2,355 0.07 5.78
22 Electricity, Water and Gas 17,555 0.49 6.27
23 Construction 23,385 0.65 6.92 31-33 Manufacture 459,236 12.79 19.71 43 Wholesale business 64,679 1.8 21.51 46 Retail trade 685,576 19.09 40.6 48-49 Transport, mail. 16,145 0.45 41.05 51 Media 34,107 0.95 42
52 Financial and Insurance Services 41,379 1.15 43.15
53 Real Estate Services 33,563 0.93 44.08
54 Professional and Scientific Services 55,983 1.56 45.64
55 Corporations 45.64
56 Waste and Scrap Services 91,815 2.56 48.2
61 Educational Services 211,717 5.9 54.1
62 Health and Social Services 218,297 6.08 60.18
71
Sports, Culture and Recreational
Services 37,425 1.04 61.22
72
Accommodation, Food and Beverages
Services 495,019 13.78 75
81
Other services ( repairing, beauty, associations, household work) except
Government 715,553 19.92 94.92
93 Government 182,384 5.08 100
Total 3,591,272 100.00
36
TABLE A2. Heckman selection models
Heckman selection models
Variable Heckman 1 Heckman 2 Heckman 3 Heckman 4 Heckman 5 Heckman 6 Natural logarithm of annual wage per hour
Schooling 0.1120 0.1120 *** 0.1124 *** 0.1124 *** 0.1095 *** 0.1095 *** Experience -0.0182 -0.0182 -0.0181 -0.0177 - 0.0088 -0.0088 Experience squared 0.0007 0.0007 *** 0.0007 *** 0.0007 *** 0.0005 *** 0.0005 Indicator rural areas -0.2513 -0.2513 ** -0.2513 ** -0.2515 ** - 0.2651 *** -0.2651 *** Constant 2.1140 2.1140 *** 2.1047 *** 2.0983 *** 2.0099 *** 2.0095 ***
Indicator person working Schooling -0.0013 -0.0013 -0.0027 -0.0028 0.0028 0.0027 Age 0.2116 0.2116 *** 0.2125 *** 0.2151 *** 0.1985 *** 0.1997 *** Age squared -0.0027 -0.0027 *** -0.0028 *** -0.0028 *** - 0.0026 *** -0.0026 *** Indicator rural areas 0.0610 0.0610 0.0913 0.0911 0.1465 0.1457 Annual labor income realized by other household members -0.2537 -0.2537 *** -0.2868 *** -0.2944 *** - 0.6040 *** -0.6047 *** Widow -0.2484 -0.2484 * -0.2691 * -0.2656 * - 0.3722 ** -0.3680 ** Separated or divorced -0.1160 -0.1160 -0.1069 -0.1027 - 0.1199 -0.1173 Children with disabilities 0.2373 0.2373 0.2542 0.2571 0.1919 0.1940 Children from 0 to 2 years -0.0891 -0.0891 -0.0851 -0.0821 - 0.3473 -0.3450 Children 3 to 5 years -0.0162 -0.0162 -0.0105 -0.0100 - 0.1058 -0.1052 Children from 6 to 12 years 0.0466 0.0466 0.0717 0.0722 0.0041 0.0046 Annual labor income realized by other household members 0.0000 * 0.0000 ** 0.0000 0.0000
Members with 65 years or more 0.1112 0.0579 Number of household members 0.2724 *** 0.2706 *** Constant -2.6127 -2.6127 *** -2.6014 *** -2.6354 *** - 2.5811 *** -2.5973 ***
athrho
37 lnsigma Constant -0.0579 -0.0579 -0.0587 -0.0617 - 0.1244 -0.1242 Statistics N 2144 2144 2144 2144 2144 2144 legend: * p<0.05; ** p<0.01; *** p<0.001
Scientific Coordinator : Xavier Oudin ([email protected]) Project Manager : Delia Visan ([email protected])
Find more on www.nopoor.eu Visit us on Facebook, Twitter and LinkedIn