DIAL • 4, rue d’Enghien • 75010 Paris • Téléphone (33) 01 53 24 14 50 • Fax (33) 01 53 24 14 51 E-mail : dial@dial.prd.fr • Site : www.dial.prd.fr
D
OCUMENT DE
T
RAVAIL
DT/2008-10
Social Mobility and Colonial Legacy
in Five African Countries
Thomas BOSSUROY
Denis COGNEAU
SOCIAL MOBILITY AND COLONIAL LEGACY IN FIVE AFRICAN COUNTRIES1
Thomas Bossuroy PSE, DIAL, Paris bossuroy@dial.prd.fr
Denis Cogneau IRD-DIAL Paris, PSE
cogneau@dial.prd.fr
Document de travail DIAL
Décembre 2008
ABSTRACT
How fluid are African societies? This paper uses wide-sample nationally representative surveys to set down the first comparative measurement of the extent and features of the social mobility of men in five countries of Sub-Saharan Africa. Intergenerational as well as intra-generational mobility between the farm and non-farm sectors are examined, and are linked to migration patterns on the one hand, educational development and mobility on the other hand. Two former British colonies, Ghana and Uganda, stand out with the highest level of social fluidity. Two former French Western colonies, Côte d’Ivoire, Guinea, come next. Last, Madagascar exhibits specifically large and sustained inequalities of opportunity. Comparisons between countries reveal how occupational mobility is linked to spatial and educational mobility. In the former French colonies, these latter forms of mobility are much selective on the origin variables, and appear as pre-requisites for the access to non-agricultural jobs. In the former British colonies, the links between origin, migration, education and occupational achievement appear much looser. Historical evidence suggests that these different structures are the product of policies and investments implemented differently by the two former colonial powers. This article thus presents original evidence on social mobility in Africa and highlights how institutions and policies shape it.
Keywords: Social Mobility, Education, Intergenerational Transmission, Colonization, Dualism,
Africa.
RESUME
Quel est le degré de fluidité des sociétés africaines ? Cet article mobilise des enquêtes nationalement représentatives à larges échantillons pour établir une première mesure comparative du niveau et des caractéristiques de la mobilité sociale des hommes dans cinq pays d'Afrique Sub-Saharienne. Les mobilités intergénérationnelle ainsi qu'intra-générationnelle entre les secteurs agricole et non-agricole sont examinés, et mis en relation avec les caractéristiques de la migration d'une part, avec le développement de l'éducation et la mobilité scolaire intergénérationnelle d'autre part. Deux anciennes colonies britanniques, le Ghana et l'Ouganda, ressortent avec le plus haut degré de fluidité sociale. Deux anciennes colonies françaises d'Afrique de l'Ouest, la Côte d'Ivoire et la Guinée, viennent ensuite. Enfin, Madagascar montre une inégalité des chances particulièrement élevée et durable. Les comparaisons entre pays révèlent que la mobilité professionnelle est liée à la mobilité spatiale et à la mobilité scolaire. Dans les anciennes colonies françaises, ces deux dernières formes de mobilité sont plus sélectives en fonction des variables d'origine sociale, et apparaissent comme des préconditions pour l'accès aux professions non-agricoles. Dans les anciennes colonies britanniques, les liens entre origine sociale, migration, éducation et destination professionnelle apparaissent beaucoup plus lâches. L'analyse historique suggère que ces structures différentes sont les produits de politiques et d'investissements mis en oeuvre de façon différente par les deux puissances coloniales. Cet article présente ainsi une série de faits originaux sur la mobilité sociale en Afrique et met en lumière comment les institutions et les politiques lui confèrent ses formes.
Mots clés : Mobilité sociale, éducation, transmission intergénérationnelle, colonisation, dualisme,
Afrique
JEL code: J62, N37, O15
1 The authors thank Victor Hiller for his participation in the first stage of this study; they also thank Laure Pasquier-Doumer and Constance Torelli for their contributions in the construction of datasets. Research funding from Agence Française de Développement (AFD) is gratefully acknowledged. Last, they also thank the World Bank and the National Statistical Institutes from Côte d’Ivoire, Ghana, Guinea, Madagascar and Uganda for making the data available for this research. The usual disclaimer applies.
This paper proposes the first comparative measurement of the extent of intergenerational mobility in five countries of Sub-Saharan Africa: Côte d’Ivoire, Ghana, Guinea (Guinée-Conakry), Madagascar and Uganda. It also studies the evolution of intergenerational mobility across time, with some consideration for intra-generational occupational mobility. This is made possible by the availability of large-sample surveys built upon a common methodology and providing information on the social origins of the interviewed adult individuals: parents’ education and occupation, and region of birth. We use a set of nine surveys that were implemented during a period ranging from the mid-1980s to the mid-1990s.
The analytical methods used here relate to that of the groundbreaking Erikson and Goldthorpe (1992) comparative study and associated works. These works rarely go beyond the set of Western industrialized countries, or else mostly include former-socialist European ones. Low-income, developing or sub-tropical countries enter the comparative databases with unrepresentative surveys, which are often restricted to urban areas or specific regions (see, e.g., Tyree, Semyonov and Hodge 1979; Grusky and Hauser 1984; Ganzeboom, Liujkx and Treiman 1989). Apart from representativeness, comparability of occupational variables is also an issue (Goldthorpe 1985).
The availability of relevant and reliable data makes the first explanation for the scarcity of similar quantitative studies of social mobility in developing countries. Even today, only few large sample nationally representative surveys ask about the parental background of adult respondents. For the purpose of comparison among Latin American countries, Behrman, Gaviria and Szekely (2001) could only find four countries where this kind of data had been collected on a comparable basis2. In Latin
America, Chile appears as an exception (Torche 2005), but is also the most industrialized country in this sub-continent. Asia does not seem much more documented, except recently for China (Cheng and Dai, 1995; Wu and Treiman 2007), and India (Kumar, Heath and Heath 2002a & 2002b). As for Africa, only South Africa had yet been investigated in that dimension (Lam 1999; Louw, Van der Berg and Yu 2007).
In this work, we focus on rural-urban dualism, both because of data constraints and analytical accuracy. Rural-urban segmentation is of outstanding importance in the context of African countries. The majority of the population still lives in rural areas and derives its income from agricultural activities, but internal migration flows towards towns are large and the urban sector developed rapidly in the course of the 20th century. Rural-urban dualism was first intensified by colonial powers
establishing European-like administrative structures and European firms promoting the development of a formal sector in urban areas. This made the mobility to non-agricultural jobs even more attractive. In the African context, leaving the agricultural occupations and entering the non-farm sector remains the major upward move. We thus chose to focus on this specific mobility; reproducing the seven-class categories commonly used in studies on industrialized countries would prove both difficult and largely irrelevant with the data at hand.
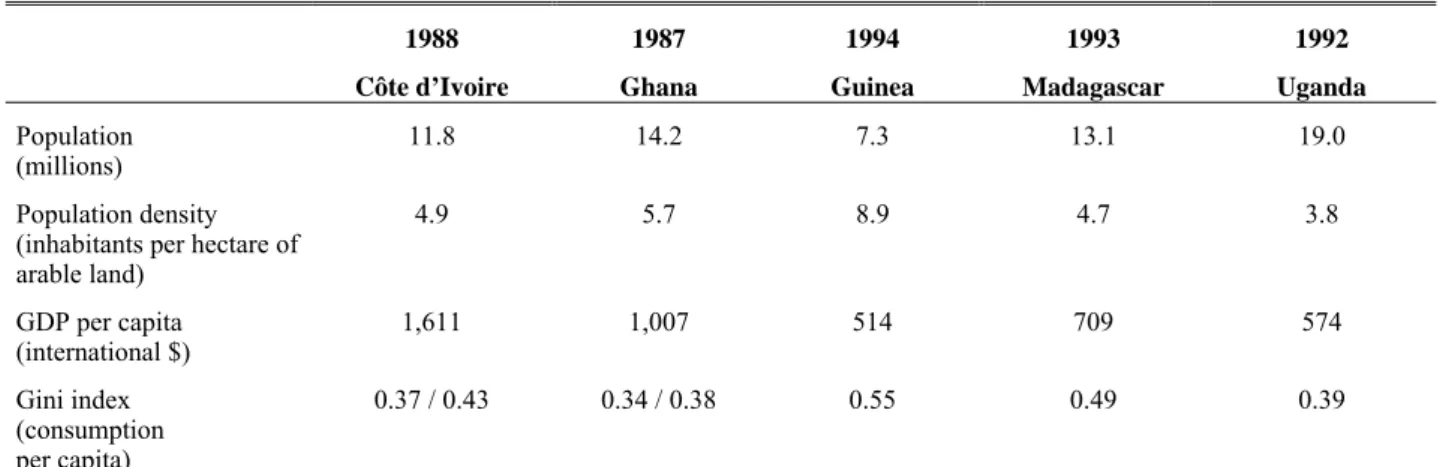
The five African countries under review here have certain characteristics in common: they are of average size, do not have large mineral resources and derive most of their trade income from agricultural exports. When computed over arable land, population density is very much similar across the five countries. The bulk of the labor force is still working in agriculture everywhere, although there is some variation between the most urbanized country, Côte d’Ivoire, and the most rural, Madagascar. The vast majority of agricultural workers are small landowners or shareholders (see Table A.1 in Appendix A).
However, the five countries’ colonial histories are quite different. Côte d’Ivoire, Guinea and Madagascar were colonized by the French while Ghana and Uganda were colonized by the British in the late 19th century. Both colonial powers ruled these countries during more than half a century. The
five countries then took different roads after independence around 1960 (see Table A.2 in Appendix A for a timeline).
2 The case of Brazil has been particularly investigated by Pastore 1982; Pastore and Valle Silva 2000; Picanço 2003; Bourguignon, Ferreira and Menendez 2007; Dunn 2007; Cogneau and Gignoux 2008.
The former French colonies displayed quite divergent trajectories. Under President Houphouët-Boigny Côte d’Ivoire established itself as the main partner of the former colonial power in Africa, adopted the regional common currency linked to the French Franc with a fixed rate (franc CFA) and developed a liberal export-oriented economy based on cocoa culture. Oppositely, Guinea broke with France in 1963 and President Sekou Toure introduced a long-lasting authoritarian and repressive socialist government. Madagascar displayed a succession of those two polities, the first President Tsiranana maintaining narrow relationships with France whereas from 1975 Didier Ratsiraka set up a radical socialist system soon to be mitigated to restore the relationships with international donors and implement macroeconomic reforms.
The two former British colonies also had distinct trajectories. In Ghana, a succession of military coups entailed power instability but did not threaten civil peace, while Uganda was the scene of violent episodes such as brutal repressions, terror on populations and war against Tanzania. Financial stabilization and economic adjustment were implemented in Ghana and Uganda from the mid-1980s. Appendix A provides a chronogram of political regimes, some demographic and economic indicators and occupational structures computed from the surveys.
Our main finding is that social mobility is more restricted in the three former French colonies than in the two former British colonies, whether we consider occupational or educational mobility, and inter- or intra-generational mobility. Intergenerational mobility between agriculture and other sectors is higher in the two former British colonies, Ghana and Uganda. This conclusion is maintained when correcting for potential bias arising from intra-generational mobility; in fact, mobility along the life cycle is also more fluid in Ghana. When measured through the migration decisions or the diversification of activities, the ‘social distance’ between agricultural and non-agricultural occupations is shown to be more limited in our two former British colonies. When looking at education, intergenerational opportunities are also strikingly more restricted in former French colonies. Lastly, inequality of opportunity in both migration and education accounts for a great deal of the differences in intergenerational occupational mobility between former French and former British colonies, especially in the case of Western African countries (Côte d’Ivoire and Guinea vs. Ghana). We argue that the colonial legacy of spatial structures and of educational systems has very much to do with all these features.
The remainder of the paper is organized as follows. Section 1 presents the survey data, the variables of analysis and the main analytical tools. In section 2 we analyze intergenerational entry into and exit from agriculture and after having proposed a correction method for intra-generational mobility and life cycle effects, we compare the five countries across time. Section 3 delves into spatial and migration issues. Section 4 examines educational development and educational intergenerational mobility in the five countries over 40 years. Section 5 introduces education and migration as correlates of occupational mobility. Section 6 summarizes and concludes.
1/ DATA AND ANALYTICAL TOOLS
We use national household surveys that were carried out between 1985 and 1994 in the five countries we study, covering large probability samples on a national level. The countries and periods in question are Côte d’Ivoire from 1985 to 1988, Ghana in 1987 and 1992, Guinea in 1994, Madagascar in 1993 and Uganda in 1992. The sample designs procedures are regionally stratified and two-stage. Within each strata, a first random draw of primary sampling units (PSUs, or survey clusters) is made among a list of localities or big towns sub-sectors established from the most recent national census. After enumeration of households within PSUs, a fixed number of household is then randomly drawn in each PSU. The resulting sample usually comes with a set of unequal weights attached to each PSU3.
Face-to-face interviews are conducted by trained staff. The Côte d’Ivoire, Ghana and Madagascar surveys are “integrated” Living Standard Measurement Surveys (LSMS) designed by the World Bank in the
3 The Ghana GLSS1 survey makes an exception in that respect, with its self-weighting sample (equal probability of selection for each household in the country).
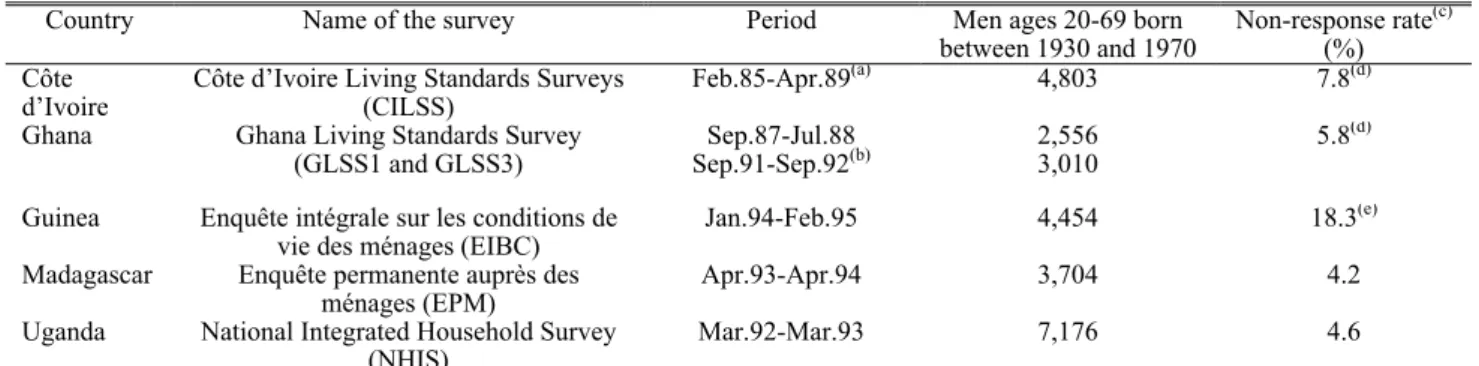
1980s; the format of the two other for Guinea and Uganda is inspired from them. The Appendix table A.4 gives the precise names, periods, sample sizes and response rates of these surveys4.
In the more recent period and in many countries in Africa, surveys with smaller questionnaires have since been preferred for reasons of cost and feasibility, and unfortunately no longer include information on parental background for adult interviewees. To our knowledge, the surveys that we selected are the only large sample nationally representative surveys in Africa that provide information on parental background for adult respondents.
They all provide a good deal of information about the main employment of the interviewed person. Homogenizing classifications however proves difficult. For this reason, we focus on entry and exit from the agricultural sector. Individual occupational mobility is partially observed in the surveys thanks to an “employment history” section, except in Uganda5. As for the occupation of fathers, the
differences between the available items in each survey also drove us to retain only the distinction between farmers and non-farmers.
We also introduce education in the analysis and distinguish three levels: no education / primary level / middle or secondary level. Education of the father is also available but is not perfectly comparable between Côte d’Ivoire and the other countries, as the Côte d’Ivoire survey informs about the highest diploma when other surveys give the highest level attained. This slight difference will of course be taken into account in our comments on the educational dimension.
We restrict our analysis to adult between 20 and 69 years of age and cohorts born between 1930 and 1970. In some respect, the old age of these surveys constitutes an advantage as it makes it possible to go back to the colonial era by analyzing cohorts born before the 1960s. We also focus on men, the analysis of intergenerational mobility of women being left for further research.
As it is now traditional in quantitative sociology, we compute odds-ratios from mobility tables crossing sons’ and fathers’ occupation or education and analyze them with the logit model. Odds-ratios make it possible to compare the strength of association between origin and destination across time and space, regardless of the fact that the weight of some destinations varies between countries or periods. More precisely, they express the relative probability for two individuals of different origins to reach a specific destination rather than another one. Let i=0,1 and j=0,1 index the two origins and the two destinations of a 2 rows and 2 columns mobility table; let nij be the number of individuals of
origin x=i and destination y=j, and pij=p(y=j|x=i) the conditional probability of reaching destination j
for origin i. The odds-ratio of this table is defined as:
(
)
(
)
(
(
1 0)
)
[
[
1(
(
1 0)
)
]
]
1 1 1 1 1 1 1 01 01 11 11 00 01 10 11 = = − = = = = − = = = − − = = x y p x y p x y p x y p p p p p n n n n OR (1)The logit model expresses the natural logarithm of odds-ratios as a linear function of more than one correlate:
(
)
(
)
α
Xβ
X y p X y p + = = − = 1 1 1 ln (2)where y still indexes the occupational or educational destination. X is a vector of observed variables x (parental background, education, etc.). β is a vector of parameters. α is a constant that stands for the ‘reference group’ (all x=0 within X), i.e. the denominator of (1) in the univariate (only one variable of origin x) and dichotomic (x=0 or 1) case.
4 Documentation and more details can be found at the Website of the World Bank’s Africa Household Survey Databank:
http://www4.worldbank.org/afr/poverty/databank/default.cfm.
5 This kind of data is not available either in the GLSS4 survey implemented in Ghana in 1998, even if information on father’s occupation and education was still collected. This led us to exclude 1998 Ghana from our set of surveys.
2/ MOBILITY BETWEEN AGRICULTURE AND OTHER OCCUPATIONS
This section deals with intergenerational entry into, and exit from, the agricultural sector.
2.1. A first measurement of intergenerational mobility
In order to measure what we call intergenerational dualism, we first construct (2,2) mobility tables crossing occupational origin (i.e. father being a farmer or not) and destination (i.e. son being a farmer or not). So as to observe the evolutions across time, we split our sample into a set of four decennial cohorts built upon the date of birth of individuals. Aggregated outflow tables are in Appendix B. The odds-ratios for each of these cohorts are reported in Table 1 and graphically presented in Figure 1.
[Insert Table 1 about here]
Table 1 and Figure 1 reveal noticeable differences between countries. In Madagascar, intergenerational dualism seems to have remained at very high levels throughout the colonial and post-colonial eras, with odds-ratios always above 15. The four remaining countries seem to share close starting points in the 1930-39 cohort. However, the two former British colonies, Ghana and Uganda, stand out with stable across time and relatively low odds-ratios: Whatever be the cohort considered, the son of a farmer and the son of a non-farmer are “only” 3 to 6 times more likely to reproduce their fathers’ positions than to change them.
[Insert Figure 1 about here]
In the third group of countries composed by the two Western former French colonies, Côte d’Ivoire and Guinea, intergenerational dualism seems to increase across time, bringing the odds-ratios of the 1950-59 cohorts to levels twice as high as in Ghana or Uganda, although the difference is statistically not very significant for Côte d’Ivoire because of sample size. In the last and youngest cohort, intergenerational dualism is again doubled in both countries and catches up with the level of Madagascar.
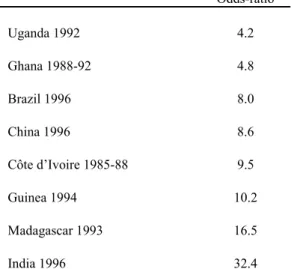
On the basis of a computation of the same odds-ratios for the whole sample of men ages 20-69, we can draw some simple comparisons with other developing or emerging countries from other continents. As Table 2 shows, Brazil, a country well-known for its record in inequality, and China, where labor migrations are still strictly regulated, share the same level of intergenerational dualism as Côte d’Ivoire and Guinea. Madagascar stands in-between this latter group of countries and India, whose caste system ascribes individuals to their father’s occupation; although less prominent, caste-like discriminations also prevail in Madagascar, at least among the Merina ethnic group6. In contrast,
Uganda and Ghana stand out as much more fluid societies. [Insert Table 2 about here]
2.2. Intra-generational mobility
• Method
Two men of same social origin but of different ages cumulate two reasons for having reached different positions: one is the evolution of intergenerational mobility across time; the other is the individuals’ occupational mobility along their own career. The comparison we just presented does not take into account the fact that individuals are not observed at the same point of their lifetime. In the rural/urban dualistic framework we study here, this could yet play a role: a 20 years old man may be less likely to have reached a non-agricultural position than a 60 timer, if people tend to move to urban areas during their lives. Conversely, if men come back to land after having accumulated some capital in non-agricultural occupation, a young man may be more likely to be non-farmer than an older man.
Moreover, the weight of social origin may have different impacts on the life cycle. It may decrease with age if people emancipate from their social origins by getting older, in which case the observed mobility of younger cohorts would be biased downward relatively to the one of older cohorts. Conversely, if the social origin not only determines the starting point but also the set of opportunities all along the individuals’ careers, divergence conditional to social origin is underestimated at younger ages. We therefore take into account intra-generational mobility so as to compare individuals as if they all had ended their work career, whatever be their age at the time of the survey.
In every country except Uganda (because of data limitation), we construct mobility matrixes crossing the current occupation of the respondent and his previous occupation. These mobility matrices are measured separately for each social origin (father farmer or not), and for different ages. To preserve the representativeness of sub-samples, we compute these matrices by decennial age groups7. If a
complete work career lasts, say, 40 years, the total transition matrix (from the beginning up to the end of the career) is thus estimated as the product of four decennial matrices computed by age and social origin. We are then able to apply to any individual – whatever be his age and social origin- a residual intra-generational mobility and reconstruct his position at ‘occupational maturity’ (we discuss this latter concept further).
Note that we estimate the individuals’ future occupational transitions on the ground of observed transitions in the older cohorts. Our method thus relies on the assumption that intra-generational mobility is stable across time for a given age and social origin. This might be considered a weaker assumption than that of a “neutral” intra-generational mobility, i.e. intra-generational mobility being independent of father’s origin. We of course acknowledge that intra-generational mobility could have changed during the 1990s and could still change in the future, end even differently so in each country.
• Inactivity
As employment rates for each cohort vary from one country to another (see Table A.3 in Appendix), we have to take inactivity into account to avoid any bias in the comparisons. We define an inactive individual as an adult who did not work in the last twelve months. Inactivity thus includes long-term unemployment and studies. This kind of bias might particularly affect the relative position of Côte d’Ivoire where inactivity rates are the highest, especially in the youngest cohort (born after 1960). Two simple counterfactual analyses (not shown) where inactive people are either recoded as farmers or as non-farmers indeed reveal the sensitivity of the odds-ratios of Côte d’Ivoire and Guinea to the treatment of inactivity.
Descriptive analysis (not shown) reveals that younger inactive in Côte d’Ivoire and Guinea are very significantly more educated than non-agricultural workers, with a large difference of more than three years of schooling between the two groups. It is well-known that the economic crisis of the 1980s has particularly hit the non-agricultural employment of young skilled men, mainly because hiring in the public sector has brutally stopped. Most of inactive men at young ages therefore either carried on their studies or were unemployed and queued for a job in town. In order to take them into account, we include inactivity as a possible origin status for the first cohort, and compute (3,2) matrixes describing the transition during the first decade of individuals’ work careers.
As for older cohorts, inactive men are closer to the average population in terms of social origin and education, and they represent a more limited share of the sample. The selection bias due to retirement or to missing occupations is therefore rather limited.
7 The ten years ago occupation is derived from the answer to the following questions: “What job did you do before the one you have today?” and “For how long do you do your current occupation?” The occupation exerted ten years ago is taken as agricultural (resp. agricultural) if the respondent exerts his current occupation for more than ten years and this current occupation is agricultural (resp. non-agricultural), or if the respondent exerts his current occupation for less than ten years and the previous occupation is agricultural (resp. non-agricultural)..
• Intra-generational mobility and life-cycle effects
As we explained above, our intra-generational matrices represent the probability for an individual of any decennial age group to reach a given position within a period of ten years, and the first decennial matrix includes inactivity as a possible origin. Decennial matrixes are presented in Appendix C. Figure 2 focuses on the first (3,2) transition matrix and presents the probability to move from inactivity toward a non-agricultural occupation between 20-29 and 30-39 years old. The important rate of formerly inactive individuals who reach a non-agricultural occupation reflects the higher education of this group. This is all the more striking for farmers’ sons who emancipate from their occupational background after an early period of inactivity (from 49% in Madagascar up to 81% in Côte d’Ivoire, Madagascar being here again an exception). As expected, inactivity in the youngest cohort frequently reflects ongoing studies or queuing for non-agricultural jobs and opens doors to intergenerational mobility.
[Insert Figure 2 about here]
We now turn to transitions between sectors. The reconstructed probability for a farmer to switch to a non-agricultural occupation decreases over the life cycle.
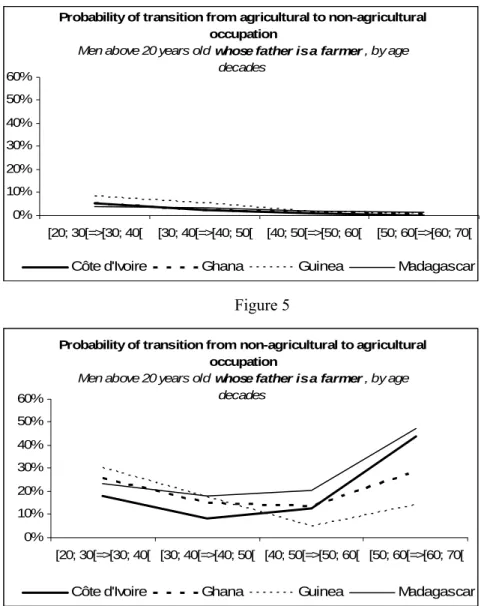
When the father is himself a farmer (see Figure 3), this probability is very low all along the life cycle (less than 10%). When the father is not a farmer (see Figure 4), the probability is high at the beginning of the work career (up to 59% in Guinea), and decreases progressively until about zero. Young workers are thus the most likely to switch from an agricultural occupation to a non-agricultural occupation, but this opportunity strongly depends on the father’s occupation. In Guinea and Côte d’Ivoire, the probability seems very high that a young farmer leaves agriculture early when his father himself is not a farmer, which increases social reproduction. In Ghana, the sons’ trajectories are more similar across social origins. Intragenerational mobility appears less determined by the father’s occupation than in the three former French colonies.
[Insert Figures 3 to 6 about here]
As for the reciprocal transitions toward agriculture, results show that they are not negligible at the beginning of the work career, but are the most likely at the very end (Figure 5). This might be caused by the need to go back to one’s village to inherit land or to take care of one’s goods and household. Having an agricultural background (i.e. having a father farmer) indeed increases the probability to come back to agriculture at old ages (compare Figures 5 and 6).
However, sons of non farmers also have a fairly high probability of transition toward agriculture at the end of their lives (Figure 6). This move thus appears as a form of retirement: due to the weakness of pension systems, and because of the importance of the agricultural sector in the countries we study, individuals get back to the village of their family at the end of their lives not only to inherit but also to earn subsistence revenue from agricultural activities.
Since (i) a significant share of our last age group (60-69) seems to retire, (ii) the sample size of this group is very limited, and (iii) there may be a bias arising from differential mortality according to social origin, we retain the 50-59 ages as the time of occupational maturity8.
We then compute the product of three decennial matrixes and obtain the occupational transition matrix for the whole work career, i.e. between 20-29 and 50-59 year old. The inequality of career opportunities between individuals of different origins appears clearly (Figures 7 and 8).
[Insert Figures 7 and 8 about here]
Ghana stands out as the country where the difference between origins is the smallest. The father’s occupation is a much stronger determinant of individual trajectories in the three former French colonies.
2.3. The impact of intra-generational mobility on intergenerational mobility
We are now able to correct our measures of intergenerational dualism by taking into account the impact of occupational transitions along the life cycle. We reconstruct the occupational structure of every cohort as if it had reached the occupational maturity, and compute the same set of odds-ratios as the one presented in Table 1.
The ratios of uncorrected and corrected odds-ratios are most often close to 1 (see Table 3). On the whole, taking intra-generational mobility into account slightly lowers the estimation of intergenerational mobility in Côte d’Ivoire and Madagascar (i.e. increases odds-ratios), whereas it raises it in Guinea and Ghana. As expected, transitions from inactivity at the beginning of careers tend to increase mobility. The correction is the largest in Côte d’Ivoire, where it lowers the odds-ratio by 8% for the youngest cohort (result not shown). However, after taking into account the other elements of prospective occupational mobility, the same odds-ratio ends up 6% higher than its uncorrected counterpart (Table 3), confirming that individual trajectories are strongly influenced by social origins all along the life cycle in this country.
[Insert Table 3 about here]
Figure 9 presents the corrected patterns of intergenerational mobility across time in the four countries, aside with Uganda which stays uncorrected due to data limitations. The intra-generational corrections reinforce the similarities between Côte d’Ivoire and Guinea, while clearly separating them from Madagascar. The gap between these countries and the two former British colonies is maintained.
[Insert Figure 9 about here]
The last two sections of this paper concentrate on these differences between countries and relate them with education and migration issues, these two correlates bearing the marks of the colonial policies implemented differently by the French and the British. To carry out these analyses properly, the sample size imposes to leave aside the issue of the evolution across time of intergenerational dualism. We also focus on the oldest cohorts (born between 1930 and 1959) and disregard the youngest (1960-69) whose intergenerational mobility profiles are the most sensitive to life-cycle effects.
3/ MIGRATION AND DIVERSIFICATION OF ACTIVITIES
Intergenerational entry into and exit from agriculture can be linked to migration flows between rural and urban areas on the one hand and to the diversification of occupations within localities on the other hand. The differences we observe in these latter features relate to the specificity of public investments that were made by the colonial powers and the economic institutions they established.
Table 4 gives the emigration rate of country residents outside their village or town of birth, among 1930-1959 cohorts. It reveals that Ghana is the country where internal emigration is the most frequent, followed by Côte d’Ivoire and Uganda. As the second row of Table 3 shows, internal emigration rates of Côte d’Ivoire natives, rather than residents9, are lower than in Ghana and Uganda for cohorts born
before 1950. Finally, in Guinea and Madagascar, migration is much less frequent than in the three other countries.
[Insert Table 4 about here]
Is migration correlated to intergenerational dualism? The first column of Table 5 presents the estimation of one logit model per country, where the left-hand side variable takes the value of one
9 Côte d’Ivoire stands out as a land of international immigration. Among men born between 1930 and 1959 and living in Côte d’Ivoire, 20% were born in foreign countries, mostly Mali (5%) and Burkina-Faso (9%); in other countries this rate never goes above 3%.
when the individual is staying in his village or town of birth, and zero when the individual has emigrated somewhere else. On the right-hand side, along with a father farmer dummy, we additionally introduce decennial cohort dummies. Estimation results reveal that having a father farmer raises the odds of staying in the locality of birth in every country except Ghana. In the three former French colonies, a farmer’s son is at least three times more likely to stay, while in Uganda this differential probability is half (1.7), Ghana showing no difference. Thus, internal migration is not only less frequent in former French colonies but it also more often selects non-farmer’s sons.
[Insert Table 5 about here]
The two other columns of Table 5 apply the same logit model to a dummy variable indicating whether the individual is working in agriculture, separately for migrants and non-migrants. The estimation reveals that a large share of between-country differences in intergenerational dualism must be attributed to non-migrants. Excepting Madagascar, the odds of becoming a farmer for a farmer’s son relatively to a non farmer’s son are similar throughout the countries, provided that he has left the village or town of birth, i.e. conditionally to having emigrated. Conversely, these odds are more contrasted between countries among non-migrants. Uganda displays a much higher level of intergenerational mobility among non-migrants. Ghana and Guinea come out as much similar from this point of view. Then comes Côte d’Ivoire, and Madagascar is again left far behind.
A double effect of migration reveals. First, a “selection” effect of migration separates our countries: farmers’ sons less often leave their locality of origin in the three former French colonies. Second the “discriminating power” effect of migration is different in the countries under study: in Côte d’Ivoire and Madagascar, those who stay are more likely to reproduce their father’s occupation, i.e. stay a farmer, than in Guinea and in the two former British colonies. The differences in intergenerational dualism between Ghana and Guinea seem to be essentially linked to the first effect, as, once migratory status is taken into account, the influence of having a father farmer is similar between the two countries. This latter assessment will be confirmed in section 5.
In contrast, the differences between Côte d’Ivoire and Ghana seem to persist even when migration is controlled for. This latter point may be documented further by considering the diversification of activities. Tables in Appendix D show that more than two fifths of people in Ghana and Uganda whose main occupation is not agricultural also work in agriculture as a secondary job, whereas only a little more than one tenth do the same in Guinea and Côte d’Ivoire. Conversely, around one fifth of farmers also have a non-agricultural secondary job in Ghana, Guinea and Uganda, versus only one tenth in Côte d’Ivoire. This latter observation suggests that the borders between occupations are more open in Ghana and Uganda in comparison with Côte d’Ivoire. It is consistent with the differences in the spatial polarization/diversification of activities that has just been observed among non-migrants. Under this new light, Madagascar still stands out as a special case: while the mixing of main and secondary jobs is as high as in Ghana and Uganda, the weight of father’s occupation carries over for migrants and for non-migrants as well.
These different patterns of migration and diversification of activities may be traced back to the colonial legacy. First, it is documented that infrastructure investments were different in the French colonies and in the British colonies: In 1960, the British colonial power had built more kilometers of railways and roads in Sub-Saharan Africa (Herbst 2000: 159-170). This may have reduced the cost attached to migration, making it more frequent and affordable to a wider range of people. This gap in the extension of road networks endures until recent times (see first row in Appendix E Table). Second, the administrative centralization inspired by the French government system fostered the concentration of business, wealth, infrastructures in the largest cities. Consequently, the non-agricultural activities were more often situated in rural areas or small towns in the former British colonies and were linked to the urban market by denser road networks. Indeed, as shown again in Appendix E (second row), the share of the population of the largest city is much higher on average in former French colonies, while the urbanization rate is hardly different from former British colonies (third row). Among our five countries, according to the population censuses, the largest city share of population was 8% in 1985 Ghana (Accra), against respectively 17 and 15% in 1988 Côte d’Ivoire (Abidjan) and 1983 Guinea
(Conakry) 10. French and British colonial powers thus shaped spatial structures differently through
their investments in infrastructures and administrative organizations. Our results reveal the long-term impact on the patterns of geographical mobility and, in turn, on intergenerational mobility.
4/ EDUCATIONAL MOBILITY AND INTERGENERATIONAL DUALISM
4.1. Colonial school policies and educational developments over time
Before introducing education into the analysis of intergenerational dualism, we examine here the educational development experience of each country and the intergenerational mobility matrices linking father’s occupation and education and son’s education.
Table 6 shows the Madagascar and Uganda early starts in primary schooling, due to the policies of Merina and Buganda kingdoms and in particular the openness to European missionaries. Yet this advantage does not give rise to a high proportion of individuals completing primary school and disappears completely at the secondary level when compared with Ghana. At the other extreme, Côte d’Ivoire and even more so, Guinea, are countries where primary education was reserved to a small minority during the 1930s. These features are in perfect keeping with the number of pupils recorded by historical statistics (Mitchell 2001). In fact, Madagascar makes an exception among French colonies: a continental overview confirms the British colonies’ large advantage in terms of school extension before 1960 (Benavot and Riddle 1988; see also: Brown 2000; Bertocchi and Canova 2002). These differences relate closely to the colonial policies that were implemented by the French and the British. Historians consider that the French schooling system was less expanded for a variety of reasons (Gifford and Weiskel 1971): teaching had to be performed in French, while British generally used vernacular languages in keeping with the Indirect Rule doctrine; as inspired by the schooling system of the French Third Republic, education was free of charge, which entailed the concentration of colonial expenditures on a limited number of schools; it also had to be secular, while British encouraged and subsidized Protestant missionary schools; overall, French colonial school policy was designed to provide excellent education to a small advanced elite rather than to educate masses (for a comparison between French and British colonial administrations and relationships to indigenous populations, see Firmin-Sellers 2000).
[Insert Table 6 about here]
The effects of these different colonial policies endured. The international databases show that the British advance on education and literacy has been maintained up to 2000, after forty years of continued educational expansion (see Appendix E Table, fourth and fifth rows) 11. Table 6 is again in
line with this point, as the countries’ ranks are unchanged when comparing the youngest cohorts educated after independence with the oldest, educated during the 1940s. The main change comes from Côte d’Ivoire which got further and further from Guinea while catching up with the other countries. While being still behind in terms of access to school in the 1970s, Côte d’Ivoire had overrun Madagascar and Uganda at the middle (“collège” in the French-origin systems) and secondary levels. Besides, it seems that expansion of the secondary level has lagged behind in Uganda since independence in 195812. Of course, any educational expansion does not necessarily translate into
higher equality of opportunity in favor of unprivileged children whose parents are poor or uneducated (see, e.g. Goux and Maurin 1997, on the example of France; Cogneau and Gignoux 2008, on Brazil; Pasquier-Doumer 2004, on Peru). The effect of social origin must therefore be analyzed precisely.
10 The corresponding rates were 5% for 1992 Uganda (Kampala) and 9% for 1993 Madagascar (Antananarivo).
11 However, they also reveal that this educational performance was not translated into a higher income per capita or a longer life expectancy (see two last rows of Table in Appendix E).
12 The Ghanaian education system before 1987 offered much longer schooling than elsewhere based on the “6-4-5-2” format: six years in primary school, four in middle school, five years in secondary school and two pre-university years. Since primary school had no system of repeating a failed year, half of the individuals had at least completed six years of schooling. Most of the other half had never attended school, with only a small minority having left school at primary level. In Madagascar and Uganda, two-thirds of individuals ages 20 and over had successfully completed one year of primary education, but very few had completed all five (Madagascar, “5-4-3”) or seven (Uganda, “7-4-2”) years of this level.
4.2. Educational intergenerational mobility
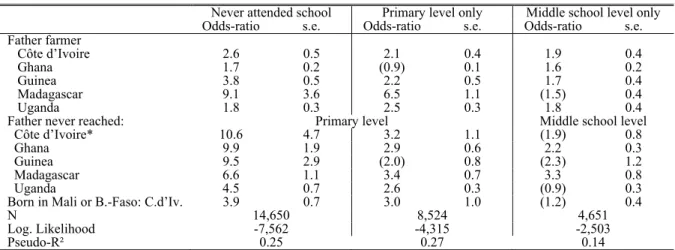
The differences in school expansion between our two sets of countries prove to actually translate into a difference in intergenerational educational mobility. For our five countries, Table 7 presents the estimation of three logit models per country explaining respectively the probability of having never attended school (see top panel of Table 6), of having reached primary level only (conditionally to having attended school), and of having reached middle school or ‘collège’ level only (conditionally to having attained primary level; see bottom panel of Table 6). The estimated coefficients presented in Table 7 compare the probabilities of access to each level of education for two sons with different social origins as characterized by the father farmer dummy and a variable indicating whether the father ever attended school or not (or reached primary level in the third column) 13.
[Insert Table 7 about here]
The first column of Table 7 shows that the intergenerational educational mobility for schooling alone is low in Côte d’Ivoire and in Guinea, in keeping with the low extension of primary schooling in these two countries. Both countries display higher odds-ratios than Uganda for the father farmer dummy as well as for the father school attendance dummy; when compared with Ghana, the father’s education level carries the same weight but the father’s occupation still has a (statistically significant) larger influence. Uganda, where primary education is the most widespread in the 1930-59 cohorts, displays the lowest discrimination in access to schooling. Ghana comes second and does not show more inequality of opportunity than Madagascar, even though primary schooling in this country was less frequent14.
The second and third series of odds-ratios establishes that, in the case whereby some sort of schooling was received, Madagascar presents the most discriminating educational heritage inequalities. The influence of these inequalities carries through to both middle school and secondary school. In the other two former French colonies, where schooling is less developed, the majority of the inequality of opportunity for education is concentrated in initial schooling factors. Lastly, the education systems in the two former British colonies are clearly less selective than the education system in former French colonies, at all levels of schooling. This latter result is strikingly in line with both our previous results regarding occupational intergenerational mobility and the different schooling institutions set up by the two colonial powers15.
5/ EDUCATION AND MIGRATION AS CORRELATES OF INTERGENERATIONAL DUALISM
This last section confronts our main results regarding intergenerational dualism with migration behaviors and educational developments that have just been examined. Table 8 presents the estimation results of three models per country, explaining the probability of working in agriculture as main occupation. In the left part of the table (Model I), the “father farmer” dummy is introduced alone, in the middle part (Model II) the migration variable introduced in section 3 is added; lastly, the right part (Model III) also adds the individual’s education studied in section 4.
Model I purely reproduces the “uncorrected” occupational odds-ratios described in section 2 with two differences: cohorts born before 1960 are now aggregated into a single one, and youngest cohorts are withdrawn. Results and tests shown in the bottom panel of the Table plainly confirm the countries’ rankings obtained above.
[Insert Table 8 about here]
13 The accuracy of comparisons involving Côte d’Ivoire should be taken with caution when father’s education is considered, as it is not measured like in the other countries, i.e. by the last degree obtained rather than by the higher level attained.
14 The difference in father’s education influence on school attendance may seem lower in Madagascar (6.6) than in Ghana (9.9), but it is not statistically significant at 10%, while it is in the case of father’s occupation (9.1 vs. 1.7). Other results not shown here about the younger cohorts (1960-69) suggest that equality of opportunity had even dramatically improved in Ghana, while staying at a very high level in Madagascar. This evolution has put Ghana at the level of Uganda. From that standpoint, the two former British colonies were showing the most advanced level of “democratisation” of access to school in the 1970s.
15 This ranking of countries in terms of educational intergenerational mobility is maintained when an ordered logit model is estimated in place of the three sequential logit models of Table 7, as adviced by Cameron and Heckman (1998).
Model II significantly improves Model I in terms of likelihood, by introducing the individual’s migratory status as an additional correlate for working in agriculture. Côte d’Ivoire and especially Guinea stand out as countries where emigration is largely a prerequisite for the access to non-agricultural jobs. This latter result is in line with both countries’ spatial polarization and occupational rigidity that have been already noticed in section 3. Migration alone does not help very much in explaining intergenerational dualism differences between countries, as the ranking of countries remains the same, except in the case of Ghana and Guinea who no longer appear as significantly different.
When the impact of father being a farmer on education is cancelled out in Model III, the odds-ratio corresponding to the father farmer dummy is significantly diminished in every case. As revealed by the tests in the bottom panel, Côte d’Ivoire and Guinea end up not being different from Ghana, while Uganda still stands in a lower position. At the other extreme of the spectrum, Madagascar still holds its first rank in terms of intergenerational reproduction, although not significantly so when compared with Côte d’Ivoire. As expected, the influence of education on occupational selection is large.
In sum, comparing our five countries highlights a double effect of education, similar to the one we pointed about migration: in Ghana, education is both less selective (of social origin) and less discriminating (of social destination). The lower level of selectivity, due to a more widespread and evenly distributed schooling system (see above), accounts for most of the difference between Ghana and Guinea. When turning to the comparison between Ghana and Côte d’Ivoire, part of the explanation is the same; however, a large remaining part must be attributed to differences in the importance of education for accessing non-agricultural occupations, which is smaller in Ghana than in Côte d’Ivoire. Other studies revealed that the monetary returns to education follow the same pattern when these two countries are compared (Schultz 1999).
Section 4 showed that countries where intergenerational occupational dualism is the most pronounced also exhibit lower levels of intergenerational educational mobility. In that sense, the uneven distribution of education contributes to the explanation of intergenerational dualism. However, the discriminating power (or returns) of education can be also different between countries, if only for explaining entry into and exits from agriculture. It combines with inequality of opportunity in access to school16.
These stylized facts constitute an operative pattern to account for a large share of between country differences. In comparison with the neighboring Ghana, Côte d’Ivoire can hence be depicted as a country where the social distance between occupations is maximal, whether it is measured by the spatial mixing of activities or by the education level attached to each job. However, the relatively high levels of internal migration and of post-colonial educational development compensate for these handicaps. Conversely, in Guinea, low migration rates and educational underdevelopment make satisfactory explanations for the high level of intergenerational dualism. In Ghana, both spatial distance and educational distance are minimal and combine with high migration rates and widespread post-primary education.
As for the two extremes in the spectrum of intergenerational dualism, Madagascar and Uganda, these explanations in terms of spatial distance and educational distance are only partial. Long-term history and political developments may complete the picture. In Madagascar, the persistence of caste-like distinctions probably makes part of the explanation for the outstanding level of intergenerational reproduction. In Uganda, the political violence which has particularly affected this country since the end of 1960s might have contributed to its record level of intergenerational mobility, through forced downward mobility, migration or even premature deaths.
16 Education accounts for almost all of the between countries differences in terms of access to white collar occupations: once education is introduced, the remaining effects of social origin appear very little on the propensity to reach a non-manual wage job. This latter result is not shown but available upon request from the authors.
6/ CONCLUSION
This paper sets down a first comparative measurement of the features and of the evolution across time of the intergenerational mobility of men in five countries of Sub-Saharan Africa. It focuses on intergenerational entry into and exit from agriculture, which is most important in countries where more than half of the population still today works in farms. Life cycle effects that determine intra-generational entry and exit flows are also considered.
The comparison establishes a large divide between two groups of countries. The two former British colonies, Ghana and Uganda, stand out by far with the lowest degree of intergenerational dualism and educational reproduction, which has strong consequences in terms of distributive justice. The social rigidity of the three former French colonies goes together with high cross-sectional inequalities in welfare, and translates in inequality of opportunity for income and living standards17.
The correlates we highlight with other forms of mobility, whether geographical or educational, provide a set of explanations for the levels of intergenerational mobility and appear to bear the marks of the colonial legacy. In the two former British colonies, both spatial and educational mobility are less selective and have less sorting power, which also means that the returns to education on the labor market are more limited. In contrast, in the three former French Western colonies, Côte d’Ivoire, Guinea and Madagascar, the opportunity structure of the society seems much less opened in all respects: migration and educational mobility appear as pre-requisites for the access to non-agricultural jobs, while being reserved to a selected minority. Madagascar cumulates this rigidity with specific social structures that originate in long-term history and make intergenerational mobility even lower. Alternative explanations for these between-country differences are not easy to find. Differences in initial development give no immediate clue: centralized pre-colonial kingdoms have ruled parts of Ghana and Uganda, but also Madagascar, and population density is roughly the same in all countries, when measured over arable land. Differences in modernization and economic development give no clue either: Côte d’Ivoire and Ghana are the most developed countries. Differences in political regimes hardly help as well: Guinea has been the most socialist country and Côte d’Ivoire the most economically liberal.
Colonial policies are thus a key to understand the different social structures in African countries. On one side, like all British colonies on average, Ghana and Uganda have benefited from higher educational investments during the colonial period and a denser transport network. They also have inherited a more decentralized State structure and perhaps a more competitive political field, even at the expense of post-colonial political stability. On the other side, francophone States’ policies have set high levels of income dualism and/or monetary returns to education, following the interests of a small educated urban class. Intergenerational mobility in contemporary Africa still reflects these contrasting colonial policies.
17 Appendix Table A.1 indeed suggests that former French colonies have a more unequal income distribution. About inequality of opportunity for income, see also Cogneau and Mesplé-Somps (2008).
Table 1 – Intergenerational dualism across time: Odds-ratios Birth cohort 1930-39 1940-49 1950-59 1960-69 Côte d'Ivoire [3.6;12.0] [5.6;18.2]6.6 10.1 [4.8;12.1]7.6 [8.3;20.0]12.8 Ghana [3.0;6.4] [3.8;7.3]4.4 5.3 [3.2;5.3]4.1 [4.9;7.6]6.1 Guinea [2.1;6.3] [5.9;15.9]3.6 9.7 [5.8;11.4]8.1 [12.9;28.4]19.1 Madagascar [11.3;47.5] [9.0;26.4]23.1 15.4 [14.2;31.8]21.2 [12.3;22.7]16.7 Uganda [1.7;4.2] [3.4;6.3]2.6 4.6 [3.3;5.4]4.2 [3.5;5.0]4.2
Coverage: Men ages 20-69 born between 1930 and 1970.
Reading: in Côte d’Ivoire, two men born in the 1930’s whose fathers were respectively a farmer and a non-farmer are
6.6 times more likely to reproduce their father’s position than to exchange them.
Note: Confidence intervals at 5% indicated between brackets.
Table 2 – Out of Africa: The five countries compared with Brazil, China and India
Odds-ratio Uganda 1992 4.2 Ghana 1988-92 4.8 Brazil 1996 8.0 China 1996 8.6 Côte d’Ivoire 1985-88 9.5 Guinea 1994 10.2 Madagascar 1993 16.5 India 1996 32.4
Coverage: Men ages 20-69, except for India: representative sample of male electorate.
Sources: For the five countries under review in this paper: computed from outflow tables of Appendix 2; for Brazil: authors’
computation from PNAD 1996 survey (see also Cogneau and Gignoux 2008); for China: authors’ computation from Table 3 in Wu and Treiman (2006); for India: authors’ computation from Tables 2 and 3 in Kumar, Heath and Heath (2002a & 2002b).
Table 3 – Intergenerational dualism across time: The impact of intra-generational mobility
Birth cohort 1930-39 1940-49 1950-59 1960-69 Côte d'Ivoire 6.7 9.2 8.4 13.8 1.0 0.9 1.1 1.1 Ghana 4.6 4.91.1 0.9 3.70.9 5.4 0.9 Guinea 3.7 8.31.0 0.9 6.20.8 12.4 0.7 Madagascar 21.4 17.80.9 1.2 25.81.2 21.2 1.3 Uganda 2.6 4.6- - 4.2- 4.2 -
Coverage: Men ages 20-69 born between 1930 and 1970.
Note: Second row indicates the ratio between the corrected and the uncorrected odds-ratios.
Reading: in Côte d’Ivoire, two men born in the 1950’s whose fathers were respectively a farmer and a non-farmer are
8.4 times more likely to reproduce their father’s position than to exchange them. Once corrected for intra-generational mobility according to our procedure, the odds-ratio raises to 1.1 times the level of the uncorrected odds-ratio.
Table 4 – Percentage of migrants outside the village or town of birth
Birth cohort 1930-39 1940-49 1950-59 1930-59 All: Côte d'Ivoire (incl. foreign born) 43.9 56.5 64.0 55.8 Côte d’Ivoire born in the country 31.1 42.1 55.0 44.1
Ghana 54.5 61.2 53.3 56.2
Guinea 19.1 26.2 37.3 28.7
Madagascar 30.1 36.3 36.4 35.0
Uganda 50.3 48.7 47.1 48.3
Coverage: Men ages 20-69 born between 1930 and 1960.
Reading: Percentage of people dwelling in the village/town of birth. For Côte d’Ivoire, the second row corresponds to the
migration rates computed over the population of individuals who were born in the country.
Table 5 – Sequential logit model for migration and occupation
Having stayed
in village/town of birth
Working in agriculture
Migrants Non-migrants
Odds-ratio s.e. Odds-ratio s.e. Odds-ratio s.e. Father Farmer Côte d’Ivoire 3.3 0.5 5.7 1.8 12.4 3.4 Ghana (1.2) 0.1 3.3 0.4 7.3 1.0 Guinea 4.0 0.5 (1.9) 0.9 7.8 1.7 Madagascar 3.4 0.5 9.3 2.4 37.6 10.1 Uganda 2.0 0.2 3.7 0.6 4.0 0.7 Born in Mali or Burkina-Faso
Côte d’Ivoire - 3.2 0.5
-N 13,852 7,279 6,573
Log. Likelihood -8,920 -4,113 -2,586
Pseudo-R² 0.07 0.17 0.15
Tests Father Farmer odds-ratio equality (prob>χ²):
C. d’Iv. = Ghana 0.000 0.088 0.087 C. d’Iv. = Uganda 0.013 0.194 0.001 Guinea = Ghana 0.000 0.273 0.800 Guinea = Uganda 0.000 0.195 0.016
Coverage: Men ages 20-69 born between 1930 and 1960 in the country, whose occupation is known.
Notes: Logit models for having stayed in the place of birth (1st column) or working in agriculture for a given migratory status
(2nd and 3rd); models include decennial cohorts’ dummy variables for each country (coefficients not shown). Unless noticed
by a parenthesis ( ), all odds-ratios are significantly different from one at 5%; s.e.: standard error.
Table 6 – Educational developments across time in the five countries
Birth cohort 1930-39 1940-49 1950-59 % Never attended school (or never achieved any level with success)
Côte d’Ivoire 81.2 62.5 39.3
Ghana 60.3 40.8 28.3
Guinea 94.1 84.7 61.4 Madagascar 48.5 33.5 23.3 Uganda 41.0 25.2 16.3 % Middle or secondary level
Côte d’Ivoire 3.2 17.2 36.7
Ghana 32.1 49.9 63.1
Guinea 3.1 10.1 26.8
Madagascar 6.9 16.3 20.8
Uganda 9.4 24.2 26.4
Table 7 – Intergenerational barriers in schooling attainments
Never attended school Primary level only Middle school level only
Odds-ratio s.e. Odds-ratio s.e. Odds-ratio s.e. Father farmer Côte d’Ivoire 2.6 0.5 2.1 0.4 1.9 0.4 Ghana 1.7 0.2 (0.9) 0.1 1.6 0.2 Guinea 3.8 0.5 2.2 0.5 1.7 0.4 Madagascar 9.1 3.6 6.5 1.1 (1.5) 0.4 Uganda 1.8 0.3 2.5 0.3 1.8 0.4 Father never reached: Primary level Middle school level Côte d’Ivoire* 10.6 4.7 3.2 1.1 (1.9) 0.8 Ghana 9.9 1.9 2.9 0.6 2.2 0.3 Guinea 9.5 2.9 (2.0) 0.8 (2.3) 1.2
Madagascar 6.6 1.1 3.4 0.7 3.3 0.8 Uganda 4.5 0.7 2.6 0.3 (0.9) 0.3
Born in Mali or B.-Faso: C.d’Iv. 3.9 0.7 3.0 1.0 (1.2) 0.4
N 14,650 8,524 4,651
Log. Likelihood -7,562 -4,315 -2,503
Pseudo-R² 0.25 0.27 0.14
Coverage: Men born between 1930 and 1960.
Notes: Logit models include decennial cohorts’ dummy variables for each country (coefficients not shown)
Unless noticed by a parenthesis ( ), all odds-ratios are significantly different from one at 5%; s.e.: standard error.
* 2 first columns: father never obtained primary level certificate (CEP); last column: father never obtained ‘collège’ level certificate (BEPC).
Table 8 – Intergenerational dualism, migration and education
Model I Model II Model III
Odds-ratio s.e. Odds-ratio s.e. Odds-ratio s.e.
Father farmer Côte d’Ivoire 7.9 1.4 8.3 2.0 5.2 1.3 Ghana 4.4 0.4 4.7 0.5 3.8 0.4 Guinea 6.8 1.2 6.3 1.4 4.5 1.1 Madagascar 19.9 3.6 18.6 3.9 8.6 2.0 Uganda 4.1 0.5 3.8 0.5 2.5 0.3
Stayed in town/village of birth
Côte d’Ivoire 30.7 4.1 27.7 4.2
Ghana 3.0 0.2 2.9 0.2
Guinea 55.7 12.0 54.8 11.8
Madagascar 5.8 0.9 3.8 0.6
Uganda 2.3 0.2 2.0 0.2
Born in Mali or Burkina-Faso
Côte d’Ivoire 3.2 0.5 1.8 0.3
Never reached primary level
Côte d’Ivoire 50.2 24.5
Ghana 13.3 2.4
Guinea 19.0 6.2
Madagascar 51.4 19.4
Uganda 49.0 16.7
Primary level only
Côte d’Ivoire 18.2 8.9
Ghana 12.9 2.8
Guinea 7.1 2.6
Madagascar 17.8 6.0
Uganda 27.9 9.0
Middle school level only
Côte d’Ivoire 5.8 3.0 Ghana 5.1 0.9 Guinea 3.7 1.6 Madagascar 4.7 1.8 Uganda 7.2 2.4 N 13,852 Log. Likelihood -7,948 -6,573 -5,898 Pseudo-R² 0.12 0.27 0.35
Tests of Father Farmer odds-ratio equality (prob>χ²):
C. d’Iv. = Ghana 0.004 0.026 0.261 C. d’Iv. = Uganda 0.003 0.003 0.010 C. d’Iv. = Madagascar 0.000 0.012 0.136 Guinea = Ghana 0.029 0.236 0.533 Guinea = Madagascar 0.000 0.000 0.050 Guinea = Uganda 0.018 0.043 0.030
Coverage: Men ages 20-29 born between 1930 and 1960 and employed.
Notes: Logit models for working in agriculture; models include decennial cohorts’ dummy variables for each
country (coefficients not shown). Unless noticed by a parenthesis ( ), all odds-ratios are significantly different from one at 5%%; s.e.: standard error.
Figure 1
Intergenerational mobility (Odd-ratios)
Men above 20 years old, by cohorts of birth Without any correction for intragenerational mobility
0 5 10 15 20 25 30 [1930; 1940[ [1940; 1950[ [1950; 1960[ [1960; 1970[
Côte d'Ivoire Ghana Guinea Madagascar Uganda
Figure 2
Probability of transition from inactivity to a non-agricultural occupation between ages 20-29 and 30-39
0% 10% 20% 30% 40% 50% 60% 70% 80% 90% 100%
Côte d'Ivoire Ghana Guinea Madagascar
Figure 3 Figure 4
Probability of transition from agricultural to non-agricultural occupation
Men above 20 years old whose father is a farmer , by age decades 0% 10% 20% 30% 40% 50% 60% [20; 30[=>[30; 40[ [30; 40[=>[40; 50[ [40; 50[=>[50; 60[ [50; 60[=>[60; 70[
Côte d'Ivoire Ghana Guinea Madagascar
Probability of transition from agricultural to non-agricultural occupation
Men above 20 years old whose father is not a farmer , by age decades 0% 10% 20% 30% 40% 50% 60% [20; 30[=>[30; 40[ [30; 40[=>[40; 50[ [40; 50[=>[50; 60[ [50; 60[=>[60; 70[
Côte d'Ivoire Ghana Guinea Madagascar
Figure 5 Figure 6
Probability of transition from non-agricultural to agricultural occupation
Men above 20 years old whose father is a farmer , by age decades 0% 10% 20% 30% 40% 50% 60% [20; 30[=>[30; 40[ [30; 40[=>[40; 50[ [40; 50[=>[50; 60[ [50; 60[=>[60; 70[
Côte d'Ivoire Ghana Guinea Madagascar
Probability of transition from non-agricultural to agricultural occupation
Men above 20 years old whose father is not a farmer , by age decades 0% 10% 20% 30% 40% 50% 60% [20; 30[=>[30; 40[ [30; 40[=>[40; 50[ [40; 50[=>[50; 60[ [50; 60[=>[60; 70[
Figure 7
Probability of transition from an agricultural occupation to a non-agricultural occupation along the whole life cycle
0% 20% 40% 60% 80%
Côte d'Ivoire Ghana Guinea Madagascar
Sons of farmers Sons of non farmers
Figure 8
Probability of transition from a non-agricultural occupation to an agricultural occupation along the whole life cycle
0% 20% 40% 60% 80%
Côte d'Ivoire Ghana Guinea Madagascar
21
Figure 9Intergenerational mobility (Odd-ratios)
Men above 20 years old, by cohorts of birth With correction for intragenerational mobility
0 5 10 15 20 25 30 [1930; 1940[ [1940; 1950[ [1950; 1960[ [1960; 1970[
Côte d'Ivoire Ghana
Guinea Madagascar
22
Appendix A: Main features of the five countries and of the surveys
Table A.1 - Development indicators
1988 1987 1994 1993 1992
Côte d’Ivoire Ghana Guinea Madagascar Uganda
Population
(millions) 11.8 14.2 7.3 13.1 19.0 Population density
(inhabitants per hectare of arable land) 4.9 5.7 8.9 4.7 3.8 GDP per capita (international $) 1,611 1,007 514 709 574 Gini index (consumption per capita) 0.37 / 0.43 0.34 / 0.38 0.55 0.49 0.39
Sources: World Development Indicators 2006 for population and population density; Maddison (2003) for GDP per capita in
Purchasing Power Parity; UNU/WIDER – UNDP(2000), World Income Inequality Database Version 1.0:
http://wider.unu.edu/wiid/wwwwiid.htm for Gini Index of consumption per capita: in this collection of income distribution indicators, two sources may give two different Gini indexes for the same country and period.
Table A.2 – Political regimes during the post-independence eras
1960 1970 1980 1990
Côte Ivoire (60) Liberal (P)
Ghana (57) Social.(A) Lib.(P) Military(A) Military (P)
Guinea (58) Socialism (A) Military (P) Madagascar(60) Liberal (P) Socialism (A)
Uganda (62) Socialism (A) Military (A) Instability
Reading: Côte d’Ivoire never experienced socialism. It only experienced (P=Pro-western) liberalism. Guinea experienced (A=Anti-western) socialism until the mid-eighties and the death of Sekou Toure. The number between parentheses is the date of independence: Madagascar became independent in 1960.
Table A.3 – Occupational structures for each country and cohort
Birth cohort 1930-39 1940-49 1950-59 1960-69* % not employed Côte d’Ivoire 6.0 2.3 8.7 24.3 Ghana 6.3 2.5 2.5 12.4 Guinea 10.0 2.9 4.0 15.0 Madagascar 5.1 1.6 0.8 4.9 Uganda 5.2 2.5 1.6 8.9
% in agriculture (among employed)
Côte d’Ivoire 74.4 56.1 44.8 53.8 Ghana 66.2 54.4 55.0 55.0 Guinea 79.3 65.5 55.0 55.0
Madagascar 85.1 73.1 71.3 79.7 Uganda 81.0 69.9 66.9 66.6
Coverage: Men ages 20-69 born between 1930 and 1970.
*: This last cohort is restricted to men ages 25-28, for the samples to be more comparable between the surveys that were implemented at different dates.
23
Table A.4 – Surveys
Country Name of the survey Period Men ages 20-69 born
between 1930 and 1970 Non-response rate
(c)
(%) Côte
d’Ivoire Côte d’Ivoire Living Standards Surveys (CILSS) Feb.85-Apr.89
(a) 4,803 7.8(d)
Ghana Ghana Living Standards Survey
(GLSS1 and GLSS3) Sep.91-Sep.92Sep.87-Jul.88(b) 2,556 3,010 5.8 (d)
Guinea Enquête intégrale sur les conditions de
vie des ménages (EIBC) Jan.94-Feb.95 4,454 18.3
(e)
Madagascar Enquête permanente auprès des
ménages (EPM) Apr.93-Apr.94 3,704 4.2 Uganda National Integrated Household Survey
(NHIS) Mar.92-Mar.93 7,176 4.6 (a): The four surveys approximately cover the whole period. In the first three years, half of the sample has been interviewed again the following year (panel data). For panelized households, only the most recent information was kept, so that the final stacked sample contains around 800 households for each year of the 1985-87 period and 1,600 for 1988-89.
(b): The two surveys were stacked to obtain a sample of 5,566 individuals.
(c): Over the initially planned household sample size. Refusal to answer is very rare; non-response most often corresponds to an address not found, or a vacant housing. Non-respondents were most often replaced by a substitute household.
(d): Côte d’Ivoire: information available only for the 1985 survey; Ghana: information available only for the GLLS1 (1987-88);
(e): Mainly due to a high rate of people who moved to another place since the 1990 counting that was used to draw the sample.
Appendix B: Outflow tables of intergenerational occupational mobility
Côte d'Ivoire Madagascar
Son's occupation Son's occupation
Agricultural Non-Agricultural Agricultural Non-Agricultural
Fa the r's occupation Agricultural 2064 1171 3234 Fa the r's occupation Agricultural 2500 408 2908 63.8 36.2 100.0 86.0 14.0 100.0 96.3 73.3 86.5 94.0 47.4 82.6
Non-Agricultural 15.6 84.479 426 100.0505 Non-Agricultural 26.2 73.8161 452 100.0613 3.7 26.7 13.5 6.0 52.6 17.4 Total 2143 1596 3739 Total 2661 860 3521 57.3 42.7 100.0 75.6 24.4 100.0 100.0 100.0 100.0 100.0 100.0 100.0
Ghana Uganda
Son's occupation Son's occupation
Agricultural Non-Agricultural Agricultural Non-Agricultural
Fa the r's occupation Agricultural 2566 1178 3744 Fa the r's occupation Agricultural 4016 1335 5351 68.5 31.5 100.0 75.1 24.9 100.0 85.6 55.9 73.3 87.2 61.8 79.1 Non-Agricultural 431 931 1362 Non-Agricultural 591 824 1415 31.6 68.4 100.0 41.8 58.2 100.0 14.4 44.1 26.7 12.8 38.2 20.9 Total 2997 2109 5106 Total 4607 2159 6766 58.7 41.3 100.0 68.1 31.9 100.0 100.0 100.0 100.0 100.0 100.0 100.0 Guinea Son's occupation
Agricultural Non-Agricultural
Fa the r's occupation Agricultural 2158 865 3023 71.4 28.6 100.0 93.8 61.2 81.4 Non-Agricultural 20.7 79.3143 548 100.0691 6.2 38.8 18.6 Total 2301 1413 3714 62.0 38.1 100.0 100.0 100.0 100.0