Assessing Joint Audit Efficiency: Evidence from
Impairment-Testing Disclosures
Luc Paugam, Jean-Fran¸cois Casta
To cite this version:
Luc Paugam, Jean-Fran¸cois Casta. Assessing Joint Audit Efficiency: Evidence from Impairment-Testing Disclosures. 2012. <halshs-00671613v1>
HAL Id: halshs-00671613
https://halshs.archives-ouvertes.fr/halshs-00671613v1
Submitted on 17 Feb 2012 (v1), last revised 19 Jan 2012 (v2)HAL is a multi-disciplinary open access archive for the deposit and dissemination of sci-entific research documents, whether they are pub-lished or not. The documents may come from teaching and research institutions in France or abroad, or from public or private research centers.
L’archive ouverte pluridisciplinaire HAL, est destin´ee au d´epˆot et `a la diffusion de documents scientifiques de niveau recherche, publi´es ou non, ´emanant des ´etablissements d’enseignement et de recherche fran¸cais ou ´etrangers, des laboratoires publics ou priv´es.
Assessing Joint Audit Efficiency:
Evidence from Impairment-Testing Disclosures
Luc Paugam
University Paris-Dauphine, [email protected] Jean-François Casta
University Paris-Dauphine, [email protected]
This version: February 13, 2012
Acknowledgements. The authors are member of Dauphine Recherche en Management (DRM), CNRS Unit, UMR 7088. We gratefully acknowledge the financial support of the FBF Chair in Corporate Finance.
Assessing Joint Audit Efficiency:
Evidence from Impairment-Testing Disclosures
Abstract:
We examine the consequences on impairment testing disclosures of auditor-pair choice made by French listed companies where two (joint) auditors are required by law. Managers are likely to manipulate impairment-testing disclosures since it relies on unverifiable fair value estimates (e.g., goodwill). Using a disclosure score for firms composing the French SBF 120 index from 2006 to 2009, we demonstrate that combination of Big 4 / non-Big 4 auditors generate higher impairment-related disclosures levels whereas the other combinations, i.e. two Big 4 or two non-Big 4, tend to decrease the level of impairment-related disclosures. We suggest that heterogeneous auditor pair is less likely to exhibit groupthinking. These results are robust to various controls variables (e.g., size, risk, year and firm fixed effects) and tend to partly challenge results from recent literature.
Keywords:
1.
Introduction
In France, publicly listed companies preparing consolidated financial statements are required to be audited by two unrelated auditors. Hence, the typical context of the choice between a Big 4 and a non-Big 4 auditor that prevails in most developed countries is more complex due to this requirement. We aim at assessing the consequences of the different possible combinations on disclosures that are likely to be manipulated by managers, i.e. impairment testing disclosures. Ramanna (2008), Ramanna and Watts (2009) and Li and Sloan (2011) demonstrate that goodwill impairments tend to be manipulated by managers because the procedure relies on unverifiable fair value estimates. Associated impairment-testing disclosures are also likely to be manipulated in order to support the tests’ results. Auditors play a central role in maintaining the objectivity and fairness of impairment tests and their associated disclosures.
Francis et al. (2009, 37) find that in France, “firms with one or two Big 4 auditors are less likely to have income-increasing abnormal accruals than other firms. […] firms audited by two Big 4 auditors are even less likely to have income-increasing accruals.” Relying on two Big 4 auditors appears to increase reported earnings’ quality. However, Big 4 audit procedures could be complementary with non-Big 4 auditors and redundant with other Big 4 auditors’ procedures. Furthermore, group decision making research supports that homogenous social background and ideology among members of a group can lead to poor decision making outcomes as individuals have a tendency to follow the beliefs of the group, i.e. exhibit groupthinking (Esser 1998).
Our research question is to determine if an association exists between auditor-pair choice and financial reporting quality using a different methodology than measuring accruals. We suggest testing the association between auditor-pair choice and impairment testing disclosures because such disclosures are usually manipulated and are notoriously related to public firms’ biggest individual asset for which fair value estimates are used, i.e. goodwill.
Our sample consists of non-financial French firms composing the SBF 120 index (120 biggest French market cap) from 2006 to 2009. Using a detailed hand-collected index composed of 55 items focusing on impairment testing disclosures from firms’ annual reports, we demonstrate that Big 4 auditors paired with non-Big 4 auditors generate higher levels of disclosures than other combinations, i.e. two Big 4 or two non-Big 4, which are significantly associated with lower levels of impairment related disclosures. Our explanation is that the group decision
making outcome is fostered by the heterogeneity among the members of the group, i.e. a Big 4 auditor paired with a non-Big 4 auditor.
We contribute to the literature at two levels. First, we deepen the understanding of the consequences of the French joint audit requirement on financial statements’ quality. Hence, auditor-pair choice matters in terms of financial statements’ quality. Second, we challenge the idea that two Big 4 auditors necessarily improve financial statements’ quality. we provide evidence that the relation between joint auditor’s size and financial statement’s quality may be more complex than two Big 4 are better than one which is better than none.
The remainder of this paper is organized as follows. We review related literature and present our hypotheses in section 2. Our methodology is described in section 3. We present the sample in section 4 and we show the results in section 5. We conclude in section 6.
2.
Overview of Related Literature and Hypotheses
Francis et al. (2009) analyze the consequences of France’s joint audit requirement on earnings quality on a sample of 261 observations and find that Big 4 auditor-pairs are associated with lower levels of income-increasing abnormal accruals. Big 4 auditors paired with non-Big 4 auditors are also associated with lower levels of income increasing abnormal accruals but to a lesser extent. Francis et al. (2009) conclude that a pecking order exists with regards to earnings quality and auditor-pair choices. We suggest examining this pecking order from a different angle by looking at other measures of financial reporting quality, i.e. disclosures. Impairments of assets are typically perceived as a negative asset pricing signal by market participants (Fields et al. 2001), which provides a primary incentive for firms to avoid booking or delaying impairment of assets. Multiple other incentives exist for managers to avoid or delay impairment recognition including debt and compensation contracts (Watts and Zimmerman 1986) or management reputation (Francis et al. 1996). Consequently Ramanna and Watts (2009) or Li and Sloan (2011) find that impairment of assets are subject to a high degree of manipulation by managers which benefit from a context of subjectivity permissible by the publication of recent standards, i.e. IAS 36 (IASB 2004) internationally and FAS 142 (FASB 2001) in the US. External auditors play an important role in maintaining the objectivity and fairness of impairment tests, particularly with regards to the accuracy and completeness of impairment-testing disclosures.
As the French Security Law1 requires that each joint auditor verifies the work undertaken by the other independent auditor leading to the joint audit report, the joint audit statement may be viewed as the outcome of a group decision making process. Group decision making can outperform individual audit decision making process if certain conditions are fulfilled. As Brodbeck et al. (2007, 459) explains that “Groups can be perceived as a vehicle for identifying and integrating individual viewpoints.” Benefits of conducting decision making in groups is that it can lead to high-quality decisions and improve creativity as well as innovation (Stasser and Birchmeier 2003). However one of the conditions a group needs to meet to improve the decision making outcome it that it must be composed of individuals with heterogeneous background and ideology (Esser 1998). If the group does not meet this condition it can lead to groupthink, i.e. “a dysfunctional pattern of interaction and thought during group decision making, which is characterized by pressures toward uniformity, closed-mindedness, overestimation of the group, and defective information processing” (Brodbeck et al. 2007, 470). It is likely that a pair of Big 4 auditors or a pair of non-Big 4 auditors exhibits more homogeneous background and ideology. Such similar backgrounds could be further amplified by standardized audit procedures that are usually followed in Big 4 audit firms. This situation is unlikely to happen in a heterogeneous auditor-pair such as a Big 4 – non-Big 4 auditor pair.
Considering these arguments and the nature of impairment-testing disclosures, we make the following hypotheses:
H1: Firms with a heterogeneous auditor pair produce a higher level of impairment-testing
disclosures than other firms.
H2: Firms with a homogeneous auditor pair produce a lower level of impairment-testing
disclosures than other firms.
In the next section we describe the methodology employed to test these hypotheses.
1
French Financial Security Law (2003). « Loi No 2003-706 du 1 août 2003 de sécurité financière, version consolidée au 1er avril 2006 », available at http://www.legifrance.gouv.fr. Francis et al. (2009, 38) provide details on the specificity of the audit market in France.
3.
Methodology
3.1. Measuring the Level of Impairment-Testing Disclosures
Standard IAS 36 “Impairment of assets” (IASB 2004) prescribes the procedures and disclosures required to perform impairment tests. Standard IAS 36 covers a large range of assets from tangible to intangible assets, including goodwill. Impairments are required to be reported in profit or loss if the net book value of an asset is higher than the recoverable value being the highest of fair value or value in use. If impossible to determine the recoverable amount for an individual asset, the standard prescribes to determine recoverable amount for groups of assets known as cash generating units. In order to include individual assets in a specific cash generating unit, the associated cash flows must be independent from cash flows stemming from other cash generating units. Goodwill is typically allocated to one or several cash generating units and tested indirectly within the cash generating unit. The fair value estimate of the cash generating unit is typically based either on a discounted cash flow approach or on a relative valuation method.
Impairments of assets are based on management estimates. Managers usually acknowledge that they use specific assumptions for impairment testing purposes. For example in Alcatel-Lucent’s 2008 annual report (p. 245) the management states: “The recoverable values of our goodwill and intangible assets, as determined for the impairment tests performed by the Group, are based on key assumptions which could have a significant impact on the consolidated financial statements. These key assumptions include, among other things, the following elements: discount rate; and projected cash-flows […].”
For French listed firms, disclosures with regards to these impairment testing procedures vary greatly from a firm to another. For instance the French pharmaceutical company Stallergenes in its 2006 annual report’s “main accounting methods” section (p. 41), provides only minimal narrative information with regard to impairment tests such as “A writedown is recorded once a year or more frequently if events or changes in circumstances indicate the likelihood of impairment for that acquisition goodwill” and “If an impairment is identified, the recoverable of the CGU to which the acquisition goodwill belongs is assessed. An impairment is recognised as soon as the book value of the CGU to which the acquisition goodwill belongs exceeds the recoverable value.” No further information concerning impairment tests is provided in the notes, although the firm owns a substantial amount of intangibles assets for which impairment tests are required to be performed at least once a year.
On the opposite, France Telecom’s 2008 annual report contains a much greater amount of information regarding impairment-testing procedures. In its note 6 (p. 287-289), the company dedicates almost three pages to its impairment tests and provide a wide range of information. The management explains the level at which goodwill is tested, and provides in tables the key assumptions used in the estimation of recoverable amounts (e.g., growth rate to perpetuity, main cash generating units and groups of cash generating units, post and pre-tax discount rates used), as well as narrative explanations for specific countries.
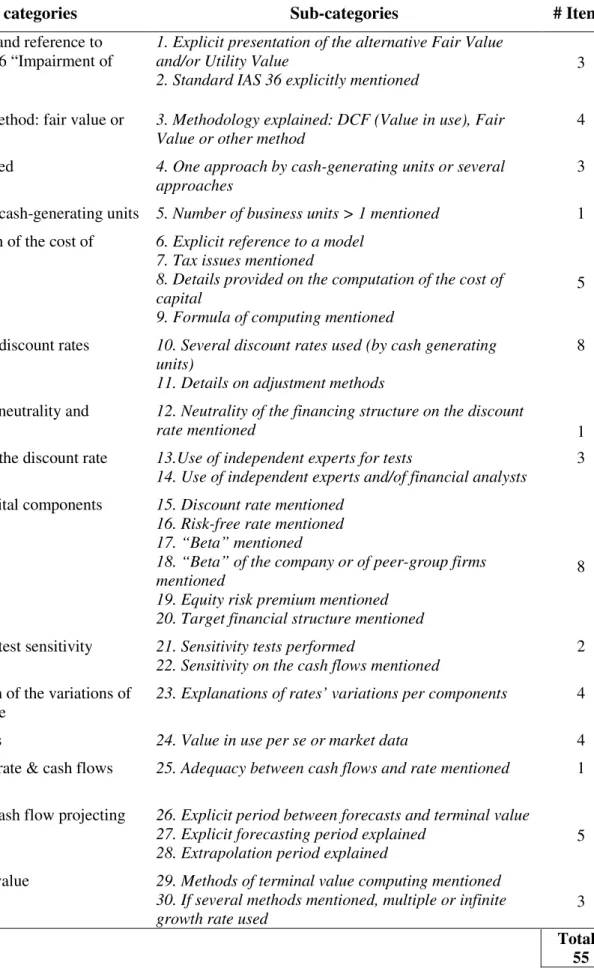
Considering this various disclosure levels and the incentives to manipulate impairment-testing disclosures, we examine every annual report produced by French non-financial 120 top-listed firms (SBF 120 index) from 2006 to 2009. We look for 55 items covering the main aspects of impairment-testing disclosures. Table 1 exhibits the main categories, sub-categories and number of items in each sub-category covered by our disclosure score.
[Insert Table 1 About Here]
By attributing one point by item that shows up in firm i’s annual report for year t, the resulting score is computed as:
ܵܿݎ݁,௧ =55 ܫݐ݁݉1 ,௧∗ 100 ହହ
ୀଵ
(1)
We divide the sum of the items by the maximum number of points and multiply it by 100 in order to obtain the dependent variable Score ranging from 0 to 100.
As presented in Table 1, our disclosure score is quite comprehensive as it covers technical valuation aspects of impairment tests (e.g., discount rates, neutrality of the financing structure, terminal value issues) as well as qualitative aspects (e.g., presentation of the alternative fair value or value in use, use of independent experts).
In the next paragraph we explain our methodology to test the association between impairment-testing disclosures and auditor pair choice.
3.2. Auditor-Pair Choice and Association with Impairment-Testing Disclosures
To determine if the joint audit pair has an impact on the level of disclosures, we estimate model (2) using firm and year fixed effects, where Auditor_Pair is the main variable of interest:
ܵܿݎ݁,௧ = ܿ + ߤ+ ܾଵ∗ ܣݑ݀݅ݐݎ_ܲܽ݅ݎ,௧+ ܾଶ∗ ܫ݉,௧+ ܾଷ∗ ܴ݅ݏ݇,௧+ ܾସ∗ ܵ݅ݖ݁,௧+
ܾହ∗ ܨ݈ܽݐ,௧+ ܻ݁ܽݎ௧+ ߝ (2)
Where for firm i and year t:
• Scorei,tis my self-constructed score for firms’ impairment related disclosures;
• Auditor_Pairi,t is one of the three following dummy variables:
- Big4_Big4i,t equaling 1 if both firm’s external auditors are among the four
largest audit companies;
- Big4_Smalli,t equaling 1 if one of the two external auditors is among the four
largest audit companies and the other is not;
- Small_Smalli,t equaling 1 if both firm’s external auditors are not among the
four largest audit companies;
• Impi,t is a dummy variable equaling 1 when the firm has an impairment of intangible
asset;
• Riski,t is the firm’s 5-year beta;
• Sizei,t is the natural logarithm of the firm’s market value of equity;
• Floati,tis the percentage of firm’s publicly exchanged equity (free float).
We expect the following relationships between the dependent and independent variables: • a negative relationship between Scorei,t and Auditor_Pairi,t when it is defined as
Big4_Big4i,t or Small_Smalli,t., because homogenous auditor-pair could be associated
to lower levels of impairment-testing disclosures due to groupthink (consistent with hypothesis H2);
• a positive relationship when Auditor_Pairi,t is defined as Big4_Smalli,t as a
heterogeneous auditor-pair could lead to a higher level of impairment-testing disclosures (consistent with hypothesis H1);
• a positive relationship with Impi,t as the occurrence of an impairment could trigger
additional disclosures explaining the impact and potential reasons for this bad news; • a positive relationship is expected with Riski,t as risky firms need to reduce the
external perception of their riskiness by producing additional disclosures;
• a positive relationship with Sizei,t is expected as firm’s size allows to dedicate more
• a positive relationship is expected with Floati,t as outside investors are the primary
users of annual reports. This increase the likelihood of finding additional disclosures in the annual report when free float represent a large portion of the equity.
We present the sample in the next section.
4.
Sample
We start our sample with the 120 firms composting the SBF 120 index over the period 2006 to 2009. We remove the 10 financial firms composing the index due to the specificity of the industry’s disclosures. Due to missing variables for some firms, our final sample is composed of 94 firms and 355 firm-year observations.
The dispersion and evolution of the disclosure score is exhibited in Figure 1. [Insert Figure 1 About Here]
The dispersion of the firms’ scores in the sample is relatively high and firms improve their impairment-testing disclosures over the period 2006-2009.
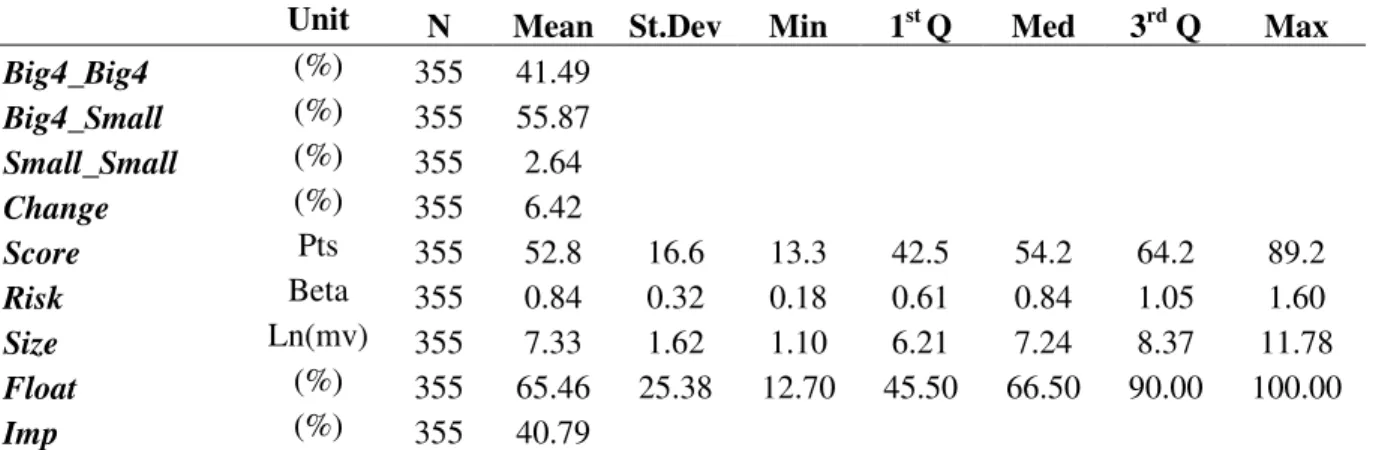
Table 2 presents some descriptive statistics of the sample. [Insert Table 2 About Here]
From Table 2, Panel A, it appears that 41% of the firms are audited by a Big 4 auditor-pair over the period, 56% of firms are audited by a Big 4 paired with a non-Big 4 auditor and the remaining 3% are audited by a pair of non-Big 4 auditors. Changes of either one or two auditors during a year does not occur frequently, i.e. only 6% of the time.
The mean (median) impairment-testing disclosure score for the four-year period is 53 points (54 points) and range from a minimum of 13 points and a maximum of 89 points over the period. The mean (median) risk of firms in the sample as proxied by 5-year beta is 0.84 (0.84), the mean (median) size is 7.33 (7.24). The mean (median) percentage of firms’ shareholder’s equity that is publicly traded (free float) is 65% (67%). Finally impairment of assets occurs on average 41% of the time during the period 2006 to 2009.
From Table 2, Panel B, we can see that Score is negatively correlated with Big4_Big4 and Small_Small but positively correlated with Big4_Small.
5.
Results
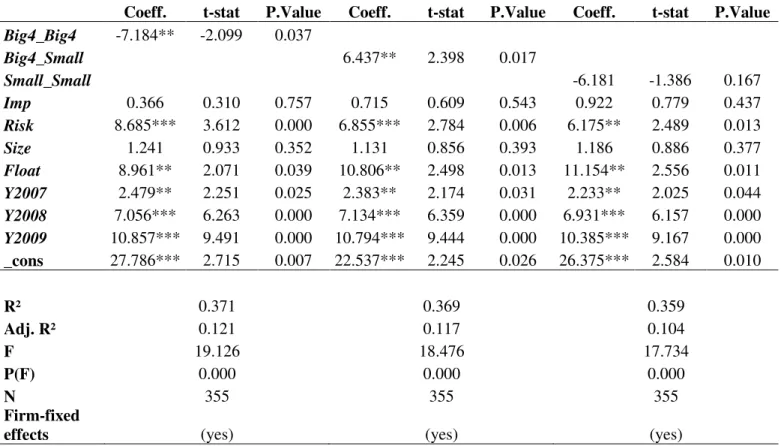
The association between auditor-pair choice and impairment-related disclosures is tested with model (2). Table 3 exhibits the results of the panel estimation.
[Insert Table 3 About Here]
From Table 3, the main results are that pairs of Big 4 auditors significantly decrease the level of impairment related disclosures with a magnitude of approximately 7 points, whereas Big 4 auditors paired with non-Big 4 auditors increases the level of disclosures provided of approximately 6 points. The results are significant at the 5% level using standard two-tails t-tests. Pairs of non-Big 4 auditors (Small_Small) are associated with lower level of disclosures (negative sign on the coefficient) but the relation is not significant. However this case represents only 3% of the sample’s observations.
From the control variables presented in Table 3, it appears that Risk and Float significantly increase the level of impairment-testing disclosures. The score is increasing through time as the coefficient on the year dummies rises for years 2008 and 2009 confirming what was observed on Figure 1. Size and Imp variables do not appear to be significantly related with impairment-testing disclosures which are mandatory even in the absence of an impairment of asset.
6.
Conclusion
Recent literature (e.g., Li and Sloan (2011), Ramanna (2008) and(Ramanna and Watts 2009)) demonstrate that recent standard publications allowing the use of unverifiable fair value estimates, i.e. FAS 142 (FASB 2001) and IAS 36 (IASB 2004), led to manipulation and delaying of impairment of assets. Impairment-testing disclosures are also likely to be distorted in order to enable managers to manipulate the outcome of their tests. In that context external auditors play a key role in ensuring that impairment tests are objectively conducted. French unique requirement of a joint audit is an opportunity to improve the decision making process around disclosures of impairment-testing procedures.
Francis et al. (2009)’s results support the idea that Big 4 auditor paired with other Big 4 auditors are associated with higher earnings quality than only one Big 4 auditor paired with a non-Big 4 auditor, or than two non-Big 4 auditors. We test this pecking order in the context of impairment-testing disclosures on the grounds that homogeneity among auditor-pairs can lead
to poor decision making outcome due to members exhibiting groupthinking (Esser 1998). On a sample of French top-listed firms, we found that heterogeneous auditor-pairs lead to significantly increasing impairment-testing disclosures whereas Big 4 auditor-pairs generate significantly lower levels of impairment-testing disclosures.
One could argue that these results may be specific to impairment-testing disclosures. The relationship between auditor-pair choice and financial reporting quality could be tested with other type of disclosures or other proxy for financial reporting quality. France’s unique setting offers a great field to test for costs and benefits associated with the joint audit requirement.
References
Brodbeck, F. C., R. Kerschreiter, A. Mojzisch, and S. Schulz-Hardt. 2007. Group decision making under conditions of distributed knowledge: The information asymmetries model. Academy of Management Review 32 (2): 459-479.
Esser, J. K. 1998. Alive and well after 25 years: A review of groupthink research. Organizational Behavior & Human Decision Processes 73 (2/3): 116-141.
FASB. 2001. Statement of financial accounting standards (SFAS) no. 142: Goodwill and other intangible assets. Norwalk, CT: Financial Accounting Standards Board.
Fields, T. D., T. Z. Lys, and L. Vincent. 2001. Empirical research on accounting choice. Journal of Accounting & Economics 31 (1-3): 255-307.
Francis, J., J. D. Hanna, and L. Vincent. 1996. Causes and effects of discretionary asset write-offs. Journal of Accounting Research 34 (3): 117-134.
Francis, J. R., C. Richard, and A. Vanstraelen. 2009. Assessing france's joint audit requirement: Are two heads better than one? Auditing 28 (2): 35-63.
IASB. 2004. International accounting standard (IAS) no. 36: Impairment of assets. London: IASC Foundation Publications Department.
Li, K. K., and R. G. Sloan. 2011. Has goodwill accounting gone bad? Canadian Academic Accounting Association Annual Meeting, Toronto.
Ramanna, K. 2008. The implications of unverifiable fair-value accounting: Evidence from the political economy of goodwill accounting. Journal of Accounting and Economics 45: 253-281.
Ramanna, K., and R. L. Watts. 2009. Evidence from goodwill non-impairments on the effects of using unverifiable estimates in financial reporting. Working Papers -- Harvard Business School Division of Research: 1-41.
Stasser, G., and Z. Birchmeier. 2003. Group creativity and collective choice. New-York: Oxford University Press.
Figure 1 – Repartition of the Impairment-Testing Disclosure Score from 2006 to 2009 0 10 20 30 40 50 60 [0-20] ]20-40] ]40-60] ]60-80] ]80-100] 2006 2007 2008 2009
Table 1 – Summary of the Major Items composing the Impairment Testing Disclosure Index
Main categories Sub-categories # Items
I. Presentation and reference to Standard IAS 36 “Impairment of assets”
1. Explicit presentation of the alternative Fair Value and/or Utility Value
2. Standard IAS 36 explicitly mentioned
3
II. Valuation method: fair value or value-in-use
3. Methodology explained: DCF (Value in use), Fair Value or other method
4 III. Methods used 4. One approach by cash-generating units or several
approaches
3 IV. Number of cash-generating units 5. Number of business units > 1 mentioned 1 V. Computation of the cost of
capital
6. Explicit reference to a model 7. Tax issues mentioned
8. Details provided on the computation of the cost of capital
9. Formula of computing mentioned
5
VI. Number of discount rates 10. Several discount rates used (by cash generating units)
11. Details on adjustment methods
8
VII. Financing neutrality and discount rate
12. Neutrality of the financing structure on the discount
rate mentioned 1
VIII. Origin of the discount rate 13.Use of independent experts for tests
14. Use of independent experts and/of financial analysts
3 IX. Cost of capital components 15. Discount rate mentioned
16. Risk-free rate mentioned 17. “Beta” mentioned
18. “Beta” of the company or of peer-group firms mentioned
19. Equity risk premium mentioned 20. Target financial structure mentioned
8
X. Impairment test sensitivity 21. Sensitivity tests performed
22. Sensitivity on the cash flows mentioned
2 XI. Explanation of the variations of
the discount rate
23. Explanations of rates’ variations per components 4
XII. Cash flows 24. Value in use per se or market data 4
XIII. Discount rate & cash flows adequacy
25. Adequacy between cash flows and rate mentioned 1
XIV. Explicit cash flow projecting period
26. Explicit period between forecasts and terminal value 27. Explicit forecasting period explained
28. Extrapolation period explained
5 XV. Terminal value 29. Methods of terminal value computing mentioned
30. If several methods mentioned, multiple or infinite growth rate used
3 Total :
Table 2 – Descriptive Statistics of the Sample
Panel A – Univariate Statistics
Unit N Mean St.Dev Min 1st
Q Med 3rd Q Max Big4_Big4 (%) 355 41.49 Big4_Small (%) 355 55.87 Small_Small (%) 355 2.64 Change (%) 355 6.42 Score Pts 355 52.8 16.6 13.3 42.5 54.2 64.2 89.2 Risk Beta 355 0.84 0.32 0.18 0.61 0.84 1.05 1.60 Size Ln(mv) 355 7.33 1.62 1.10 6.21 7.24 8.37 11.78 Float (%) 355 65.46 25.38 12.70 45.50 66.50 90.00 100.00 Imp (%) 355 40.79
Big4_Big4 is a dummy variable equaling 1 if both firm’s external auditors are among the four largest
audit companies. Big4_Small is a dummy variable equaling 1 if one of the two external auditors is among the four largest audit companies and the other is not. Small_Small is a dummy variable equaling 1 if both firm’s external auditor are not among the four largest audit companies. Change is a dummy variable equaling 1 if the firm changes external auditor during the fiscal year. Score is our self-constructed index for firms’ impairment related disclosure. Risk is the firm’s 5-year beta. Size is the natural logarithm of market value of equity. Float is the percentage of the publicly exchanged part of the firm’s equity. Imp is a dummy variable equaling 1 when the firm has an impairment of intangible asset.
Panel B – Correlation Matrix between Variables (P-Value are indicated in parenthesis)
Big4_Big4 Big4_Small Small_Small Change Score Risk Size Float Imp Big4_Big4 1.000 Big4_Small -0.944 1.000 (0.000) Small_Small -0.143 -0.191 1.000 (0.005) (0.000) Change 0.001 -0.070 0.211 1.000 (0.985) (0.229) (0.000) Score 0.065 -0.076 -0.032 -0.012 1.000 (0.188) (0.133) (0.532) (0.840) Risk 0.198 -0.219 0.005 -0.048 0.281 1.000 (0.000) (0.000) (0.925) (0.415) (0.000) Size 0.316 -0.271 -0.171 0.003 0.134 0.213 1.000 (0.000) (0.000) (0.001) (0.965) (0.010) (0.000) Float 0.022 0.006 -0.010 0.045 0.150 0.340 0.042 1.000 (0.668) (0.901) (0.847) (0.445) (0.003) (0.000) (0.422) Imp 0.079 -0.148 0.105 0.042 0.148 0.199 0.084 0.075 1.000 (0.113) (0.003) (0.037) (0.468) (0.003) (0.000) (0.104) (0.135)
Big4_Big4 is a dummy variable equaling 1 if both firm’s external auditors are among the four largest audit companies. Big4_Small is a dummy variable equaling 1 if one of the two external auditors is among the four largest audit companies and the other is not. Small_Small is a dummy variable equaling 1 if both firm’s external auditor are not among the four largest audit companies. Change is a dummy variable equaling 1 if the firm changes external auditor during the fiscal year. Score is our self-constructed index for firms’ impairment related disclosure. Risk is the firm’s 5-year beta. Size is the natural logarithm of market value of equity. Float is the percentage of the publicly exchanged part of the firm’s equity. Imp is a dummy variable equaling 1 when the firm has an impairment of intangible asset.
Table 3 – Joint Audit Pair and Impairment-Testing Disclosures
Coeff. t-stat P.Value Coeff. t-stat P.Value Coeff. t-stat P.Value
Big4_Big4 -7.184** -2.099 0.037 Big4_Small 6.437** 2.398 0.017 Small_Small -6.181 -1.386 0.167 Imp 0.366 0.310 0.757 0.715 0.609 0.543 0.922 0.779 0.437 Risk 8.685*** 3.612 0.000 6.855*** 2.784 0.006 6.175** 2.489 0.013 Size 1.241 0.933 0.352 1.131 0.856 0.393 1.186 0.886 0.377 Float 8.961** 2.071 0.039 10.806** 2.498 0.013 11.154** 2.556 0.011 Y2007 2.479** 2.251 0.025 2.383** 2.174 0.031 2.233** 2.025 0.044 Y2008 7.056*** 6.263 0.000 7.134*** 6.359 0.000 6.931*** 6.157 0.000 Y2009 10.857*** 9.491 0.000 10.794*** 9.444 0.000 10.385*** 9.167 0.000 _cons 27.786*** 2.715 0.007 22.537*** 2.245 0.026 26.375*** 2.584 0.010 R² 0.371 0.369 0.359 Adj. R² 0.121 0.117 0.104 F 19.126 18.476 17.734 P(F) 0.000 0.000 0.000 N 355 355 355 Firm-fixed
effects (yes) (yes) (yes)
![Figure 1 – Repartition of the Impairment-Testing Disclosure Score from 2006 to 2009 0102030405060 [0-20] ]20-40] ]40-60] ]60-80] ]80-100] 2006200720082009](https://thumb-eu.123doks.com/thumbv2/123doknet/2480502.50369/14.892.110.788.122.593/figure-repartition-impairment-testing-disclosure-score.webp)