Université du Québec
Institut National de la Recherche Scientifique Centre Énergie, Matériaux et Télécommunications
Synthesis and Characterization of Semiconductor Nanocrystals for
Solar Technologies
Par Yufeng Zhou
Thèse présentée pour l’obtention du grade de Philosophiae doctor (Ph.D.)
en sciences de l’énergie et des matériaux
Jury d’évaluation
Président du jury et
examinateur interne Emanuele Orgiu
INRS-EMT, Université du Québec
Examinateur externe Tomislav Friščić
McGill University
Examinateur externe Rafik Naccache
Concordia University
Directeur de recherche Federico Rosei
INRS-EMT, Université du Québec
Codirecteur de recherche Dongling Ma
INRS-EMT, Université du Québec
Abstract
Semiconductor nanocrystals (NCs) have been widely investigated in recent decades due to their unique optical, electrical properties and various applications in solar technologies, such as solar cells, luminescent solar concentrators (LSCs) and solar-driven water splitting. Among these semiconductor NCs, colloidal semiconducting quantum dots (QDs), are regarded as promising candidates for LSCs applications, with size/composition- tunable optical properties (including high photoluminescence quantum yield (PLQY), broad absorption, high photo/chemical stability,
etc. However, it is still challenging to synthesize colloidal QDs with large Stokes shift, high PLQY
and broad absorption spectrum, which are the criteria for large-area high efficient LSCs fabrications. In addition, ultra-thin semiconducting nanoplatelets (NPLs) with high carrier mobility, narrow emission spectrum and high PLQY, have been investigated and used for light emitting diodes, solar-driven hydrogen generation applications. To broaden the absorption range of ultra-thin NPLs for solar technologies, it is demanding to synthesize near infrared (NIR) NPLs with high QY and colloidal photo/chemical stability.
I firstly synthesized mixed-halide perovskite CsPb(BrxI1−x)3 QDs with different ratios of Br/I
precursors via hot-injection method, which show tunable absorption and emission spectra. The mixed-halide perovskite CsPb(Br0.2I0.8)3 QDs exhibit high PLQY of ~60%, small overlap of
absorption and emission, broad absorption ranging from 300-650 nm, which is a promising material as PL emitters in LSCs applications. The optical performance of LSCs based on perovskite CsPb(Br0.2I0.8)3 QDs was investigated and an external optical efficiency of 2% with a
geometrical (G) gain factor of 45 has been achieved. In addition, the LSCs exhibit long-term stability without any noticeable variations in PL emissions and lifetimes under ultraviolet (UV,
To extend the light absorption spectrum of QDs, near infrared (NIR) PbS/CdS core/shell QDs have been synthesized with various core sizes and shell thicknesses. Specifically, the bare PbS QDs was prepared via hot-injection method with different capping ligands. An engineered Stokes shift in NIR core/shell PbS/CdS QDs was achieved via a cation exchange approach by varying the core size and shell thickness through the refined reaction parameters, such as reaction time, temperature, precursor molar ratio, etc. The as-synthesized core/shell QDs with high PLQY and excellent chemical/photo- stability exhibit a large Stokes shift with respect to the bare PbS QDs due to the strong core-to-shell electrons leakage. The large-area planar LSC based on core/shell QDs exhibits the higher value (6.1% with a G factor of 10) for optical efficiency than that of the bare NIR QD-based LSCs and other reported NIR QD-based LSCs. The suppression of reabsorption loss and the broad absorption of PbS/CdS QDs offer a promising pathway to integrate LSCs and photovoltaic devices with well spectral matching.
Compared to conventional inorganic QDs which act as PL emitters in LSCs, carbon dots (C-dots) have superior advantages of non-toxicity, environmental friendliness, low-cost and simple preparation using abundant carbon based feedstock. We synthesized colloidal C-dots via solvothermal method using different solvents, surfactants and carbon sources. We further demonstrated large-area LSCs (up to 100 cm2) using colloidal C-dots. Two types of LSCs were
fabricated by either incorporating oil-soluble oleylamine-treated C-dots into photo-polymerized poly(laurylmethacrylate) (PLMA) or spin-coating the water-soluble C-dots/polyvinylpyrrolidone (PVP) mixture on the glass substrate. The LSCs based on C-dots/PLMA exhibit an internal quantum efficiency of 4% (G factor of 38), and an optical efficiency of 1.1% (100 cm2, G factor of 12.5) of tandem thin-film LSCs based on C-dots/PVP was achieved under one sun illumination. The optical performance is comparable to those of LSCs based on inorganic QDs with similar G
factor. The LSCs based on C-dots are highly air-stable without any noticeable variations in PL emissions under UV illumination (1.3 W/cm2) for over 12 h. These large-area LSCs based on
C-dots exhibit a highly transparency (over 90% for wavelengths longer than 500 nm) with low reabsorption losses, excellent optical performance including high optical efficiency and very good photostability.
Aside from the fabrication of QDs based LSCs, we developed a cation exchange route to synthesize ultrasmall lead chalcogenides NIR PbSe1–xSx NPLs. Basically, the as-prepared PbSe1–xSx NPLs
with small lateral dimensions, controlled thickness of ~2 nm, and different compositions were obtained via a cation exchange process on template CdSe or alloyed CdSe1–xSx NPLs using various
Pb precursors. The NIR NPLs exhibit continuously tunable PL emission ranging from 1180 to 1380 nm thanks to the variation of the S/Se ratio, which cannot be achieved in binary NPLs, and a high PLQY up to ~60%. Theoretical simulations of the bandgap as a function of thickness, geometry, and lateral size show that ultrasmall NPLs exhibit strong 3D quantum confinement, compared to 1D confinement in larger sized NPLs with similar thickness. As a proof-of-concept, we used the NPLs as photosensitizers for solar-driven hydrogen generation. After surface treatment with Cd, a saturated photocurrent density of ~5 mA/cm2 at 1.0 V vs RHE was obtained using NIR NPLs based photoanode under one sun illumination.
Acknowledgements
I would first like to thank my supervisor Prof. Federico Rosei for the insightful suggestions and supports throughout my PhD study. I want to thank my co-supervisor Prof. Dongling Ma for her useful advice and encouragement. And I acknowledge the UNESCO Chair in Materials and Technologies for Energy Conversion, Saving and Storage (MATECSS) for a PhD Excellence Scholarship.
I would particularly like to single out my group leader Prof. Haiguang Zhao for the continuous support of my research, for his patience, motivation and immense knowledge. In addition, I would like to thank our collaborator Prof. Alberto Vomiero for the meaningful comments and guidance, Prof. Alexander O. Govorov, Prof. François Vidal, Prof. Margherita Zavelani-Rossi and Dr. Mert Celikin for their helps and supports.
I would like to thank my colleagues, Daniele Benetti and Xin Tong for excellent and inspiring discussions, and constant supports. Thanks to my colleagues Dr. Gurpreet Singh Selopal, Dr. Fabiola Navarro-Pardo, Dr. Adhikari Rajesh, Lei Jin, Kaustubh Basu, Rusoma Akilimali, Wei Huang, Jiabin Liu, Daling Cui, Joyprokash Chakrabartty, Kanghong Wang and other colleagues for their helps and suggestions.
I would like to share my appreciates to my friends at INRS-EMT center, Yanqing Fu, Qiliang Wei, Fan Yan, Yanlong Liu, Miao Wang and Nathanael Komba for all the fun we had in the past four years. I also thank to our nice technicians and staffs at INRS-EMT, particularly Louise Hudon, Christophe Chabanier, Georges Lamoureux and Helene Sabourin. Besides, I am grateful to Jean-Philippe Masse for TEM measurement.
Last but not the least, I would like to thank my parents and Bingyu Sun for supporting me spiritually throughout my life.
Contents
Chapter 1 Introduction ... 1
1.1 Clean and renewable energy ... 1
1.2 Utilization and storage of solar energy ... 2
1.3 Semiconductor nanocrystals for solar technologies ... 5
1.4 Quantum dots based luminescent solar concentrators ... 8
1.5 Nanoplatelets based photoanode for solar-driven hydrogen generation ... 9
1.6 Thesis objectives and contributions of this work ... 11
1.7 Thesis organization ... 12
Chapter 2 Synthesis and characterization of perovskite quantum dots based luminescent solar concentrator ... 15
2.1 Synthesis and characterization of perovskite quantum dots ... 15
2.1.1 Synthesis of perovskite quantum dots ... 15
2.1.2 Structure and optical properties... 16
2.2 Fabrication and measurement of perovskite quantum dots based luminescent solar concentrators ... 22
2.2.1 Fabrication of perovskite quantum dots based luminescent solar concentrators ... 22
2.2.2 Optical performance measurement and simulation of perovskite quantum dots based luminescent solar concentrators ... 25
2.3 Summary ... 35
Chapter 3 Synthesis and characterization of PbS/CdS core/shell quantum dots based luminescent solar concentrator ... 36
3.1 Synthesis and characterization of PbS/CdS core/shell quantum dots... 36
3.1.1 Synthesis of PbS/CdS core/shell quantum dots ... 37
3.1.2 Structure and engineered Stokes shift in PbS/CdS core/shell quantum dots ... 39
3.1.3 Optical properties and theoretical calculation ... 40
3.2 Fabrication and measurement of PbS/CdS core/shell quantum dots based luminescent solar concentrators... 44
3.2.1 Fabrication of PbS/CdS core/shell quantum dots based luminescent solar concentrators ... 44
3.2.2 Optical performance measurements of PbS/CdS core/shell quantum dots based luminescent solar concentrators ... 45
3.3 Summary ... 53
Chapter 4 Synthesis and characterization of carbon dots based luminescent solar concentrator ... 54
4.1 Synthesis and characterization of carbon dots ... 54
4.1.1 Synthesis of carbon quantum dots ... 55
4.1.2 Surface modification of carbon dots ... 57
4.1.3 Structure and optical properties... 57
4.2 Fabrication and optical measurement of carbon dots based luminescent solar concentrators ... 61
4.2.1 Fabrication and characterizations of carbon dots based luminescent solar concentrators ... 61
4.2.2 Optical performance measurement and simulation of carbon dots based luminescent solar concentrators ... 65
4.3 Summary ... 74
Chapter 5 Synthesis and characterization of PbSe1-xSx nanoplatelets based photoanode for solar-driven hydrogen generation ... 76
5.1 Synthesis and characterization of PbSe1-xSx nanoplatelets ... 76
5.1.1 Synthesis of CdSe1-xSx nanoplatelets ... 78
5.1.1.1 Effect of reaction molar ratio... 80
5.1.2 Synthesis of PbSe1-xSx nanoplatelets ... 81
5.1.2.1 Effect of lead precursors ... 82
5.1.3 Optical properties and theoretical simulation ... 85
5.2 Fabrication and measurement of PbSe1-xSx nanoplatelets based photoanode for solar-driven hydrogen generation ... 92
5.2.1 PbSe1-xSx nanoplatelets based photoanode ... 92
5.2.1.1 Surface treatment of PbSe1-xSx nanoplatelets ... 93
5.2.1.2 Preparation of PbSe1-xSx nanoplatelets based photoanode ... 95
5.2.1.3 Post-treatment of PbSe1-xSx nanoplatelets based photoanode ... 96
5.2.2 Performance of PbSe1-xSx nanoplatelets based photoanode for solar-driven hydrogen generation ... 97
5.3 Summary ... 100
Chapter 6 Conclusions and perspectives ... 101
6.1 Conclusions ... 101
6.2 Perspectives ... 103
Bibliography: ... 106
List of Figures
Figure 1.1 The world’s energy consumption from different resources.4 ... 1 Figure 1.2 Scheme of a DSSC with a marked electron flow.21 ... 3 Figure 1.3 Schematic representation of an LSC window composed of a polymer matrix incorporating reabsorption-free QDs.22 ... 4 Figure 1.4 Schematic diagram illustrating the representation of the electronic density of states depending on dimensions.37 ... 6 Figure 1.5 (a) Emission maxima and sizes of QDs of different composition. Inset: representative emission spectra for some materials.40 (b) Size tunable PL spectra of CdSe/ZnS QDs.41 (c) Schematic representation of the energy-level alignment in different core/shell systems realized with semiconductor NCs to date. The upper and lower edges of the rectangles correspond to the positions of the conduction- and valence-band edge of the core (center) and shell materials, respectively.42... 7 Figure 1.6 Schematic representation of a QD-based LSC. (a) LSC is obtained by embedding the QDs in a transparent polymer matrix. The numbers indicate the typical processes of energy loss in an LSC. (1) Unabsorbed light; (2) Light reflects from the top surface; (3) The light was absorbed by the QDs, but there is partial loss due to the non-unity of fluorescence QY; (4) Re-emitted incident light escapes from the surface due to the escape cone (the angle smaller than the critical angle). (5) Light is reabsorbed by another QD.51... 8 Figure 1.7 (a) Schemetic demonstration of a water-splitting cell.52 (b) Band positions of several semiconductors in contact with aqueous electrolyte at pH 1. On the right side the standard potentials of several redox couples are presented against the standard hydrogen electrode potential. The energy scale is indicated in electron volts using either the normal hydrogen electrode (NHE) or the vacuum level as a reference.53 ... 11 Figure 2.1 (a) Scheme of a typical LSC configuration. (b) Cubic structure of mixed-halide perovskite QDs of CsPb(BrxI1-x)3... 15
Figure 2.2 Representative TEM images of CsPb(BrxI1-x)3 QDs (a-e). (a) A large-area TEM image
and corresponding SAED pattern (inset) of CsPb(Br0.4I0.6)3 QDs. HRTEM images of
(b): a HRTEM image of an individual perovskite QD. (f) Concentration of Br as a function of feeding ratio of Br/(Br+I) precursors. ... 17 Figure 2.3 Size distribution of perovskite QDs of (a) CsPbBr3 QDs (8.5 0.3 nm), (b) CsPbI3
QDs (7.9 0.3 nm) and (c) CsPb(Br0.4I0.6)3 QDs (12.9 1.7 nm). ... 18
Figure 2.4 EDX of an individual CsPb(Br0.4I0.6)3 QD. ... 19
Figure 2.5 (a) Absorption and PL spectra of CsPb(BrxI1-x)3 QDs with various chemical
compositions (x = 0-1). (b) QY and Stokes shift variations with various Br concentration. Fluorescence decays (c) and lifetimes (d) of CsPb(BrxI1-x)3 QDs of various chemical compositions
in toluene. The excitation wavelength is ex=444 nm. The values of the apparent Stokes shift are obtained from the difference in the positions of the lowest-energy minimum in the second derivative of the absorption spectrum and the PL peak position. ... 22 Figure 2.6 Overlap between absorption and emission spectra of the CsPbBr3 and CsPb(I0.8Br0.2)3
QDs with similar concentration. ... 24 Figure 2.7 Photographs of the LSC comprising CsPb(Br0.2I0.8)3 QDs (red light) and CsPbBr3 QDs
(green light) under ambient (a), one sun (100 mW/cm2) (b), and UV illumination (c). LSC dimensions, 6 × 6 × 0.2 cm3. (d) Absorption and PL spectra measured at different optical paths for the CsPb(Br0.2I0.8)3 QD and CsPbBr3 QDs based LSCs. (e) PL decay curves for CsPb(Br0.2I0.8)3
QDs in toluene and polymer matrix (excitation at 440 nm). (f) Integrated PL area of CsPb(Br0.2I0.8)3
QDs and CsPbBr3 QDs based LSCs at different optical paths. ... 24
Figure 2.8 PL spectra measured at different optical paths for the LSCs based on CsPb(Br0.1I0.9)3
(a), CsPb(Br0.3I0.7)3 (b) and CsPb(Br0.5I0.5)3 (c). ... 26
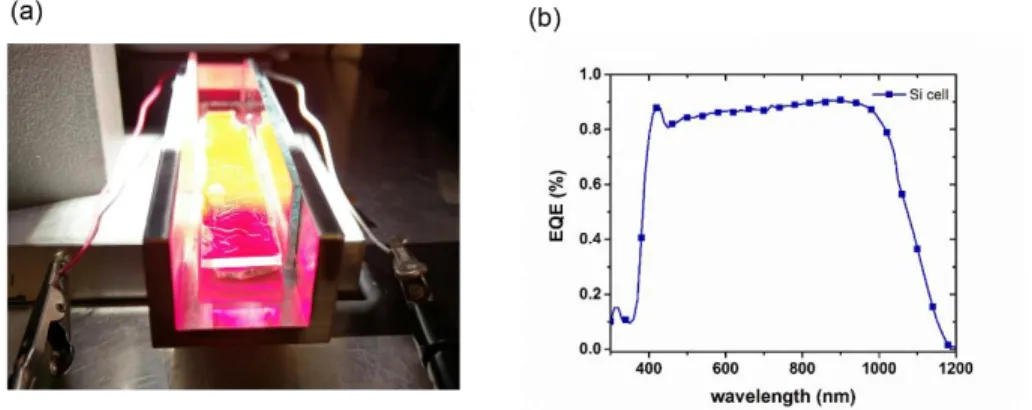
Figure 2.9 (a) Photograph of a perovskite QD based LSC during optical power conversion efficiency measurements with illumination from a solar simulator (1.5 AM global, 100 mW/cm2).
A silicon solar cell (1.50.3 cm2) is coupled with one edge of the LSC. (b) External Quantum Efficiency (EQE) of the Silicon cell used for testing the LSC efficiency. ... 27 Figure 2.10 External optical efficiency (a) and Internal Quantum Efficiency (b) of CsPb(Br0.2I0.8)3
based LSC with the QY varied from 0.6 to 1. The square points are the experimental data obtained with the electro-optical method of comparing the Isc. The dotted lines are calculated for QDs with
QY=0.75 and QF =20 (red dashed line), QY=0.6 and QF =50 (green dashed line). ... 28
Figure 2. 11 Calculated and experimental concentration factor as a function of G factor for QDs with QY=0.6, 0.75 and 1. ... 32
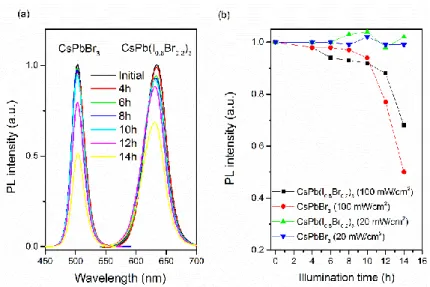
Figure 2.12 PL spectra (a) and PL intensity (b) of CsPbBr3 (b) and CsPb(Br0.2I0.8)3 (c) QDs based
LSCs upon UV exposure for different hours. ... 34 Figure 2.13 PL decay curves of CsPbBr3 (a) and CsPb(Br0.2I0.8)3 (b) QDs based LSCs without or
with UV exposure (100 mW/cm2) for four hours. ... 34 Figure 3.1 (a) Illustration of QD-based LSC incorporated with a PV device, including the typical processes of energy loss in an LSC. (1) Unabsorbed (transmitted) light; (2) Light reflected from the top surface; (3) Light absorbed by the QDs, but partial energy loss due to fluorescence QY below 100%; (4) Re-emitted incident light escaping from the surface, due to the escape cone. (5) Light re-absorbed by another QD. (b-c) Normalized absorption and PL spectra of QDs with core radius of 1.5 nm (b) and 2.3 nm (c) with tunable CdS shell thickness (H, 0~0.7 nm). (d) Representative TEM image of the core/shell PbS/CdS QDs. The inset shows the structure diagram of a core/shell PbS/CdS QD. (e) PL spectra of the core/shell QDs with various core sizes and shell thicknesses. ... 40 Figure 3.2 (a) Stokes shift of QDs with various shell thicknesses as a function of the PL peak position (related to core size of diameter from 3 to 6 nm). (b) Approximate electronic band structure of a core/shell PbS/CdS QD. (c) PL lifetime of QDs with various shell thicknesses as a function of the PL peak position (related to core size of diameter from 3to 6 nm). (d) Radial distribution functions for 1S electron of a PbS QD with the core size of 3.0 nm in diameter and tunable shell thickness of 0~0.6 nm. ... 41 Figure 3.3 (a-b) Fluorescence decays of PbS QDs and corresponding core/shell PbS/CdS QDs in solution with absorption energy of 0.94 eV (a) and 1.29 eV (b). The excitation is at 2.79 eV. ... 44 Figure 3.4 (a-b) PL decays of the large sized PbS QDs (PbS_L) (a) and the small sized core/shell QDs (C@S_S) (b) in solution or in polymer. (c-f) Absorption (red/black) and PL (green/blue) spectra of QDs in solution and in polymer for the PbS_L (c), the small sized PbS QDs (PbS_S) (d), the C@S_L (e) and the C@S_S (f). ... 46 Figure 3.5 (a-b) Normalized absorption and PL spectra measured at different optical paths for the samples of the PbS_L QDs (a) and the C@S_S QDs (b). (c-d) Optical efficiency of C@S_S QD-based LSC (#1) coupled with Si diode as a function of side length (c) or geometric factor (G factor) (d). (e) Photograph of a QD-polymer-based LSC (#1, dimension: 10 cm × 1.5 cm × 0.2 cm) comprising C@S_S QDs in ambient light. Scale bar is 1 cm. ... 47
Figure 3.6 (a-c) Spectral integrated PL area (a), PL peak position in eV (b) and FWHM ratios (c) plotted as a function of an optical path for the investigated samples. ... 48 Figure 3.7 (a-b) Normalized absorption and PL spectra measured at different optical paths for the PbS_S QD-based LSCs (a) and the C@S_L QD-based LSCs (b). ... 48 Figure 3.8 (a-b) Absorption spectra (a) and transmission spectra (b) of C@S_S QD-based LSC samples with concentration of QDs increasing from sample #1 to #3. ... 49 Figure 3.9 Photostability of LSC under UV light illumination (λ=365 nm) at 1300 mW/cm2. The
time was recorded after the QDs were buried into the polymer. ... 53 Figure 4.1 (a) Schematic illustration of surface modification of C-dots before and after phase transfer. (b, c) Photographs of visible C-dots in methanol and in hexane under room light (b) and UV light (c). ... 57 Figure 4.2 TEM and HRTEM images of the freshly synthesized C-dots (a) and the OLA-modified C-dots (b). The inset of (a) is a HRTEM image of C-dots. ... 58 Figure 4.3 (a) Absorption and PL spectra of C-dots under different surface treatments (excitation wavelength at 400 nm) with same concentration in different solvent. (b) PL decay curves collected at emission peak of 540 nm for C-dots under different surface treatments (excitation wavelength at 440 nm). ... 59 Figure 4.4 PL spectra of (a) the freshly prepared C-dots in methanol and (b) the OLA-modified C-dots in hexane at different excitation wavelengths. ... 60 Figure 4.5 PL spectra of the C-dots under different conditions. Excitation wavelength is 440 nm. ... 60 Figure 4.6 (a) Schematic demonstration of C-dot based LSCs integrated with PV device. (b) PL decay curves collected at emission peak of 540 nm for the OLA-modified C-dots in hexane and polymer matrix (excitation at 440 nm). (c) Absorption and PL spectra measured at different optical paths for the OLA-modified C-dot based LSCs. (d, e) PL peak position (d) and PL FWHM ratio (e) of the OLA-modified C-dot based LSCs as a function of optical path. ... 62 Figure 4.7 (a) Schemes of tandem thin-film LSCs based on UV C-dots (top) and visible C-dots (bottom). (b) The absorption and emission spectra of UV C-dots (#1, top) and visible NaOH treated C-dots (#2, bottom) based thin-film LSCs and absorption spectrum of PVP on a glass substrate. ... 64
Figure 4.8 (a, b) Photographs of thin-film LSCs based on C-dots#1 (a) and C-dots#2 (b) under ambient light. (c-f) Photographs of tandem thin-film LSCs based C-dots LSCs under UV illumination (c) and one sun AM 1.5G illumination (f), and thin-film LSCs based on C-dots#1 (d) and C-dots#2 (e) under one sun AM 1.5G illumination. The dimensional size of LSCs is 1010 cm2. ... 64
Figure 4.9 Normalized PL spectra measured at different optical paths for the thin-film LSCs based on UV and visible C-dots. ... 65 Figure 4.10 (a, b) Photographs of colorless large-area OLA-modified C-dot based LSCs with dimension of 0.2 × 10 × 10 cm3 under ambient (a) and UV illumination (b). (c, d) External optical
efficiency (c) and internal quantum efficiency (d) of LSCs with different concentration of the OLA-modified C-dots. (e, f) PL spectra of C-dots based LSC (e) and PL intensity of different types of QDs based LSCs (f) upon UV exposure (1.3 W/cm2) for several hours. ... 66 Figure 4.11 (a) Absorption spectra of OLA-modified C-dots in methanol solution with different concentrations (C0, 0.5 C0 and 0.25 C0). Inset is the Beer’s law relationship between absorbance
at 564 nm and concentration of C-dots. The concentration is defined as C0 = 2.8 mg/L when A =
0.12 @ 564 nm. (b) Absorption coefficient spectrum of OLA-modified C-dots in methanol solution. The C-dots show a similar absorption coefficient to that of inorganic QD.132 ... 67 Figure 4.12 Integrated PL area of the OLA-modified C-dot based LSCs as a function of optical path. The PL spectra are taken from Figure 4.6c. ... 68 Figure 4.13 PL decay curves collected at 540 nm wavelength of the OLA-modified C-dot based LSCs (G = 10) without or with UV exposure (1.3 W/cm2) for four hours. ... 70 Figure 4.14 Stability of the QD-polymer composites. PL spectra of CdSe/CdPbS core/thick-shell QDs (a) and PbS/CdS core/shell QDs (b) based LSCs upon UV exposure (1.3 W/cm2) for several hours. ... 70 Figure 4.15 Analytical model of the performance of OLA-modified C-dot based LSC with 0.5 C0.
(a) Overlap between absorption and emission of the C-dots at different concentrations. (b) External optical efficiency of 0.5 C0 C-dot based LSC with the PLQY varied from 0.25 to 1. The square
points are the experimental data obtained with the electro-optical method of comparing the Jsc. (c)
External optical efficiency of 0.5 C0 C-dot based LSC with PLQY=1 when varied the quality factor
from 0.4 (the value measured) up to 100 (d) Internal quantum efficiency of 0.5 C0 LSCs with
line), PLQY=0.75 and QF =10 (green dashed line). The square points are the experimental data
obtained with the method of comparing the different Isc. ... 72
Figure 5.1 Scheme of the formation of NIR NPLs through cation exchange using visible NPLs as template and 1D to 3D transition of quantum confinement from NPLs to ultra-small NPLs. ... 76
Figure 5.2 TEM Bright-field Images (BFI) of CdSe1-xSx NPLs (Se:S = 3:1). ... 80
Figure 5.3 XRD spectrum of CdSe1-xSx NPLs (Se:S = 3:1). ... 81
Figure 5.4 EDS spectra of CdSe1-xSx NPLs with different ratios of Se/S and reaction time. ... 81
Figure 5.5 TEM Bright-field Images (BFI) of PbSe1-xSx NPLs using different Pb precursors (Se:S=3:1), PbBr2 (a) and PbCl2 (b); PbI2 (c) and Pb(oleate)2 (d). ... 83
Figure 5.6 HR-TEM image of CdSe1-xSx NPLs, Se:S=3:1. ... 83
Figure 5.7 XRD and SAED patterns of rock salt structure PbSe1-xSx NPLs (JCPDS No. 05-0592 for PbS, JCPDS No. 06-0354 for PbSe). Se:S=3:1. Lead precursor: PbBr2. ... 83
Figure 5.8 EDS (a) and XPS (b, c) spectra of PbSe1-xSx NPLs (Se:S=3:1, PbBr2 precursor). .... 84
Figure 5.9 TEM images of obtained PbSe1-xSx NPLs using different CdSe1-xSx NPLs templates. Se:S=1:0 (a,b); Se:S=1:1, reaction time: 10 min (c) and 15 min (d). ... 85
Figure 5.10 (a) Absorption and PL spectra of parent CdSe1-xSx NPLs (top) and PbSe1-xSx NPLs after cation exchange (bottom). (b) Typical PL decay curves and fitting curves (solid lines) for PbSe1-xSx NPLs with various reaction conditions measured at the emission peak in toluene, shown on a semi-logarithmic scale. The excitation wavelength was set at 450 nm. ... 86
Figure 5.11 Schematic presentation of PbSe1-xSx QDs and cylindrical (cyl) NPLs (on the left), experimental and simulated bandgap of PbS(Se) NPLs or QDs as a function of PbS size in diameter or thickness of NPLs (on the right). The dashed lines are guides to the eye. Experimental results for binary and ternary NPLs are also reported. ... 89
Figure 5.12 ΔT/T data for PbSe (black lines), PbSe1-xSx 1:1 10 min (red lines), PbSe1-xSx 1:1 15 min (blue lines) and PbSe1-xSx 3:1 (magenta lines) NPLs for 𝑁0 = 0.2. (a, top) Normalized ΔT/T spectra for 0.3 ps probe time delay; (a, bottom) Normalized ΔT/T spectra for 500 ps pump-probe time delay; (b) ΔT/T dynamics (solid lines) pump-probed at the maximum of the PB with the respective biexponential fitting curve (dashed lines)... 90
Figure 5.13 ΔT/T dynamics of at the peak of PB at 𝑁0 =2 for different PbSe1-xSx NPLs. ... 92
Figure 5.14 Accurate band alignment of PEC system. The band energy level of TiO2 and NPL were estimated based on the UPS measurement. ... 93
Figure 5.15 Absorption spectra of NIR NPLs and NPLs after Cd post-treatment (Cd-NPLs), Se:S = 3:1, reaction time for CdSe1-xSx template is 15 min. ... 94
Figure 5.16 TEM images of Cd capped PbSe1-xSx NPLs (a) and Cd-PbSe1-xSx NPLs (b) obtained
after further cation exchange. CdSe1-xSx NPLs templates preparation parameters: Se:S=3:1,
reaction time: 15min. ... 94 Figure 5.17 XPS (a), high resolution XPS (b, c) and EDS (d) spectra of Cd-NPLs. ... 95 Figure 5.18 (a) Cross-sectional Scanning Electron Microscope (SEM) image of Cd-NPLs-sensitized photoanode. (b-h) EDS mapping analysis of all the related elements in TiO2/ Cd-PbSe 1-xSx/ZnS photoelectrode including Ti (b), O (c), Zn (d), Cd (e), Pb (f), S (g) and Se (h). ... 96
Figure 5.19 (a) Current density-potential dependence of TiO2/NPLs/ZnS, TiO2/PbS/CdS
QDs/ZnS and TiO2/Cd-NPLs/ZnS (with ligand exchange and post-annealing treatment) film
photoanode in dark and under AM 1.5G illumination (100 mW/cm2). (b) Measured current density ratio vs. illumination time at 0.8 V vs. RHE under AM 1.5G illumination (100 mW/cm2) for the photoanodes mentioned in b. ... 98 Figure 5.20 Absorption spectrum of PbS/CdS core/shell QDs. ... 98 Figure 5.21 IPCE at 1.0 V versus RHE for the sample of TiO2/ NPLs treated with ZnS. ... 100
List of Tables
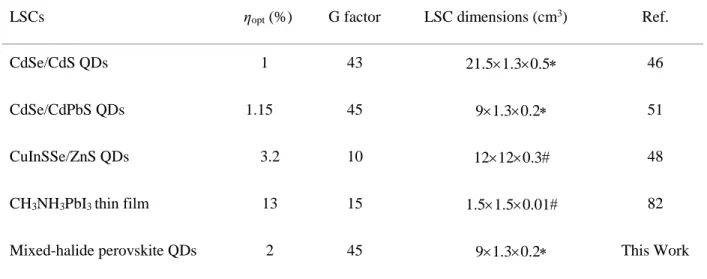
Table 2.1 D-spacings of perovskite QDs with variations of Br concentration. ... 19 Table 2.2 External optical efficiencies for different LSCs based on QDs and perovskite thin films at different G factors under one sun illumination (100 mW/cm2). ... 29 Table 3.1 Relevant parameters of the investigated PbS and PbS/CdS QDs with thin shell (shell thickness of 0.1~0.2 nm) or thick shell (shell thickness of 0.5~0.7 nm). Energies corresponding to PL maximum for QDs in toluene and average lifetime and QY of QDs in toluene are reported. 42 Table 3.2 Optical characterizations of C@S_S QD-based LSCs with different concentrations of QDs and PbS QD-based LSCs. ... 51 Table 4.1 Optical performance of QDs based LSCs. ... 69 Table 4.2 External optical efficiency of 0.5 C0 C-dot based LSC for different values of the QY.
... 71 Table 4.3 External optical efficiency of thin film C-dots based LSCs with lateral area (10×10 cm2). #1: UV C-dots; #2: visible NaOH treated C-dots. ... 74 Table 5.1 Optical properties of as-prepared PbSe1-xSx NPLs. The used Pb precursors are PbBr2 for
sample 1-4, PbCl2 for sample 5, PbI2 for sample 6 and Pb(oleate)2 for sample 7. Reaction time for
CdSe1-xSx NPLs template is 10 mina) and 15 minb). Samples 8 and 9 refer to PbS and PbS/CdS
NPLs reported in ref. 150... 87
Table 5.2 ΔT/T properties of PbSe1-xSx NPLs. ... 91
Table 5.3 Optimization of PEC photoanodes. 1T and 1S mentioned represent 1 transparent layer and 1 scattering layer of TiO2 film, respectively. ... 99
Chapter 1 Introduction
1.1 Clean and renewable energy
Generating power directly or indirectly from sustainable resources, such as solar radiation, provides an attractive approach towards addressing the increasing demands for clean and renewable energy, with minimal environmental impacts caused by the excessive carbon emissions.1,2 In order to address these issues, many possible solutions have been explored and put in place today. For instance, efficient energy products, such as light emitting diodes (LED), are applied to replace traditional bulbs, which will use less watts of electricity and last longer.3 If most
of people across the globe adopt these products, the demand for electricity would be lowered, alleviating the energy crisis. However, for the moment, they have not been widely adopted and practical. In Figure 1.1, during the last several decades, the global energy consumption from non-renewable resource rises very fast and in 2017 accounts for over 80% of whole energy consumption.4
An alternative approach is to utilize clean and renewable energies for global energy consumption. To date, renewable energy includes solar, wind, biomass, heat and hydropower etc.5-8 Hydropower
is clean power collected from the energy of falling water or fast running water, which can be used for electricity generation or irrigation. In some regions, such as Quebec Province in Canada, more than 95% of electricity used (which is equal to 40% of total energy consumption) since 2011 is generated from hydropower.9 Additionally, the electricity derived from traditional biomass holds half of energy generated from renewable sources.10 Among these clean and renewable energy
resources, solar energy provides enormous potentials to fulfill the global energy consumptions.11 Every hour, radiation impinging from the sun would be sufficient to power the whole planet for one year. However, the electricity generated from solar energy is only ~ 1.3% of total energy consumption so far.4 Efficient conversion of solar radiation into electrical/chemical energy and their storage are quite demanding and challenging in recent years.
1.2 Utilization and storage of solar energy
Solar energy is regarded as an important clean and renewable resource, which can be directly or indirectly converted into electricity or chemical energy based on solar technologies without significantly environmental pollution. Solar cells (SCs) are photovoltaic (PV) devices that harvest the solar radiation and convert it into electricity.12 In the past decades, silicon (Si) solar cells have been widely explored and commercialized due to their relatively high power conversion efficiency (PCE) and long-term stability (after 30-year use, only 20% drops in PCE was observed). The PCE of crystalline Si solar cells can be improved to ~20-40% with varied architectures. Additionally, the PCE of thin-film (CdTe, CuInGaSe, a-Si) solar cells has been enhanced to > 20%.13 However, the fabrication of Si and thin-film solar cell is complicated and requires skilled people and high-cost equipments.14 Current research directives in solar energy conversion are investigating new
methods, and, in particular, new materials and processes that will render integrated and more efficient power harvesters.15,16
Third-generation solar cells (also called excitonic solar cell) are a class of emerging PV devices. They include dye-sensitized solar cells (DSSCs), organic solar cells, perovskite solar cells, polymer solar cell and quantum dots (QDs) sensitized solar cells (QDSCs).17-20 A typical structure of DSSC is illustrated in Figure 1.2.21 Basically, incident photons are absorbed by organic dyes upon solar illumination, and exciton pairs (electron-hole pairs) are generated and separated. The electrons are injected into TiO2 nanocrystals further flows out through an external circuit, while
the holes are transferred to the counter electrode via a redox reaction.
Figure 1.2 Scheme of a DSSC with a marked electron flow.21
In general, the fabrication of third-generation solar cells is much simpler and more cost-effective compare to Si solar cells.17-20 However, commercial DSSCs products can work only for a few years and the PCE is still lower than 10%, which gives the ample room for the development and the use of luminescent solar concentrators (LSCs).20
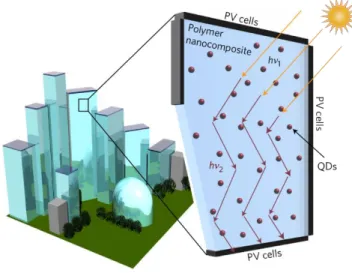
LSC is another technology which can generate electricity with low cost and high efficiency. Typically, an LSC consists of a planar plastic waveguide embedded with fluorophores, such as quantum dots and organic dyes (Figure 1.3).22,23 Upon the illumination on the top surface of LSCs, the photon is absorbed by fluorophores and reemitted at a longer wavelength, then guided through the edges of LSCs where a PV device is coupled with it. This approach will largely reduce the active area and the cost of PV devices and boost the PCE of solar cells. Besides, LSCs can be also applied for building-integrated PVs and lighting objects.24,25
Figure 1.3 Schematic representation of an LSC window composed of a polymer matrix incorporating
reabsorption-free QDs.22
In recent years, organic dyes with high PL quantum yield (PLQY) have been investigated as PL emitters for LSCs fabrications.26-28 However, the spectral overlap between absorption and emission of organic dyes such as Rhodamine with QY less than 100% is intrinsically large, which causes reabsorption issues and hampers the fabrication of large-area high optical efficiency (𝜂𝑜𝑝𝑡, defined as the ratio of output power (Pout) coming from the edges of LSC and the input power (Pin) through
the top surface of LSC) LSCs.29 Moreover, organic dyes suffer from the photodegradation due to the direct interaction of dyes and sunlight, or the attack on the dyes by an active species formed
by residue molecule in polymer matrix, resulting in poor photo/chemical stability.30,31 Semiconducting nanocrystals, for instance, QDs are promising PL emitters for LSCs due to their excellent photo/chemical stability and engineered large Stokes shift (defined as the difference in wavelength between positions of the band maxima of absorption and emission spectra). Compared to organic dyes, QDs have huge potentials for large-area highly efficient and stable LSCs fabrications.32,33
Solar energy is not a constant stream of energy, which makes the storage of solar energy significant. For example, the electricity can be generated from sun radiation and stored in battery.34 Thermal energy storage allows excess thermal energy to be collected from sunlight for later use.35 Similarly, the incident photon absorbed by semiconductors can be applied for solar-driven water splitting via photoelectrochemical (PEC) system.36 The clean chemical energy sources hydrogen can be stored and transported for appropriate usages. Typically, in a PEC system, upon sun illumination, semiconductor nanocrystals act as light absorbers and sensitizers. The photogenerated carriers are separated and transferred into photoanode and photocathode for oxygen and hydrogen generation reactions, respectively.36 The metal oxides such as ZnO and TiO2
are widely investigated for solar-driven hydrogen generation. However, the optimal materials with appropriate bandgap (usually forbidden d-d transitions) for solar-driven hydrogen generation have very small optical absorption coefficient. On the other hand, the mobilities of carriers in metal oxides are quite low, resulting in short carrier diffusion lengths. Until now, the solar-to-hydrogen (STH) conversion efficiency in PEC cell is still low, which needs to be further boosted. To enhance the long-term photostability (PEC performance vs time) of photoelectrodes and lower their cost are also very challenging for practical realizations.
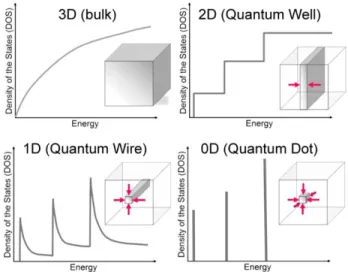
Semiconductor nanocrystals are small fluorescent particles with typical dimensions in the range of 1-100 nanometer (nm) with respect to bulk semiconductor, exhibiting size-dependent optical and electronic properties. In Figure 1.4, the electronic density of states in bulk semiconductor is continuous, and the corresponding bandgap energy of semiconductor is composition-dependent.37 The exciton is formed in semiconductor nanocrystals when the photon with energy larger than bandgap energy is absorbed. Basically, the excited electron will be recombined with the hole in the valence band, emitting a photon via radiative recombination.38 When one or more dimensional
sizes of semiconductor nanocrystals are decreased to the same magnitude of exciton Bohr radius, which is defined as the distance in an electron-hole pair, the charge carriers will be spatially confined.39 The unique properties of semiconductor nanocrystals provide enormous potential for the application in solar technologies.
Figure 1.4 Schematic diagram illustrating the representation of the electronic density of states depending
on dimensions.37
Semiconductor QDs are 3-dimensionally (3D) quantum confined (Figure 1.5a).40 Generally, when
the size of QDs increases, the corresponding bandgap decreases accompanied with a red-shift PL emission. Figure 1.5b dispalys tunable PL spectra of core/shell CdSe/ZnS QDs with various core
sizes.41 Due to quantum confinement effect of QDs, their electronic band structures can be designed and engineered by controlling the core size, shell thickness, and the choose of materials and chemical composition. Based on the bandgap and the relative position of electronic energy levels of core or shell materials, the band alignment of core/shell QDs can be generally classified into Type I, Type II and reverse Type I, shown in Figure 1.5c.42
Figure 1.5 (a) Emission maxima and sizes of QDs of different composition. Inset: representative emission
spectra for some materials.40 (b) Size tunable PL spectra of CdSe/ZnS QDs.41 (c)Schematic representation of
the energy-level alignment in different core/shell systems realized with semiconductor NCs to date. The upper and lower edges of the rectangles correspond to the positions of the conduction- and valence-band edge of the core (center) and shell materials, respectively.42
Compared to traditional organic dyes, QDs shows superior optical properties, such as broad absorption spectrum covering ultraviolet (UV), Visible (Vis) and near infrared (NIR) range, tunable absorption/emission spectra, large absorption coefficient and high long-term photostability.43 With high PLQY of QDs in polymer based device, it can be used to fabricate high efficiency LED. The QDs with high PLQY and large Stokes shift is favorable in the fabrication of QDs based LSCs. Additionally, QDs with high carrier mobility and appropriate band structures can be applied to the related solar technologies, including QDSCs, and QDs based solar-driven water splitting.44-47
1.4 Quantum dots based luminescent solar concentrators
As introduced in section 1.2, QDs can be used as highly efficient PL emitters in LSCs. Recently, highly efficient LSCs based on various types of colloidal QDs, e.g. CdSe/CdS QDs, CuInSeS/ZnS QDs and Si QDs have been widely investigated.22,46,48-50 A typical structure of QDs based LSC is showed in Figure 1.6.51 Light can be lost in different ways (processes (1) to (5) in the scheme). (1)
Only a fraction of incident light can be absorbed due to the limited overlap between the QD’s absorption spectrum and solar spectrum; (2) part of the light is reflected at the top surface of the LSC; (3) light is lost during nonradiative recombination, because the typical PLQY is below 100%; (4) if the emission angle of a re-emitted photon is smaller than that of the critical angle, this photon will be escaped from the so-called escape cone and cannot undergo total internal reflection inside the waveguide; (5) part of the light is lost due to re-absorption. Other minor light losses could be due to the absorption of emitted light by the polymer matrix.
Figure 1.6 Schematic representation of a QD-based LSC. (a) LSC is obtained by embedding the QDs in a
transparent polymer matrix. The numbers indicate the typical processes of energy loss in an LSC. (1) Unabsorbed light; (2) Light reflects from the top surface; (3) The light was absorbed by the QDs, but there is partial loss due to the non-unity of fluorescence QY; (4) Re-emitted incident light escapes from the surface due to the escape cone (the angle smaller than the critical angle). (5) Light is reabsorbed by another QD.51
The theoretically optical efficiency of an LSC can be specifically calculated from Equation 1.1:23
where R is the reflection of solar light from the waveguide surface, PTIR is the total internal
reflection efficiency, ηabs is the fraction of solar light that is absorbed by the emitter, PLQY is the
PLQY of QDs, Stokes is the energy loss due to heat generation during the absorption and emission
event, host is the transport efficiency of the wave-guided photons through the waveguide, TIR is
the reflection efficiency of the waveguide, and self is related to re-absorption of the emitted
photons by another fluorophore in the waveguide.33
How to avoid the energy loss because of the reabsorption (5) is the key to realizing high efficiency LSCs. Ideally, if a QY of QDs is 100%, the energy loss mainly depends on the critical angle θC ,as
the re-emitted photons still can escape from the LSC (process 4). Whilethere would be no energy loss through process 3. In the real case, the QY of colloidal QDs is typically lower than 100% and there is a spectral overlap between the absorption and emission spectra of QDs. Energy losses from re-absorption of the QDs occur repetitively, because photons traveling within the waveguide may be absorbed and re-emitted by other QDs with similar energy band edges multiple times before reaching an edge. In practical LSC implementations, optical path lengths may reach a meter or more, and even very small overlap between absorption and emission spectra would result in strong energy losses. Thus, the synthesis of QDs with high QY, large Stokes shift, broad absorption spectrum matching with solar radiation, and high stability becomes one of the most critical issues in fabricating large-area high efficiency LSCs. And these issues can be further addressed by design and synthesis of QDs with controllable size and chemical composition to precisely tune optical transitions for application of LSCs.22,46,48,49
Besides using semiconducting nanocrystals for LSCs, they can also be employed as light absorbers and sensitizers in PEC devices for solar-driven H2 production or water splitting application. In a
PEC system, oxygen and hydrogen from water can be generated in a light-induced water splitting reaction, illustrated in Figure 1.7a.52 In this set-up, light impinges on an electrode (for example the photoanode, made from a photocatalytic material such as titanium oxide, TiO2), generating
negatively charged electrons (e−) and positively charged ‘holes’ (h+). Electrons excited in the conduction band from photoanode are drained away through external circuit and flow to counter electrode for hydrogen generation. The holes remaining at the photoanode react with water to form oxygen. If the hole scavenger is used in this system, the generated holes are consumed without oxygen generation. In Figure 1.7b, the band alignments of conventional semiconductor materials (such as TiO2, WO2 etc) used for photoanodes in PEC system are reported.53 To date, the STH
conversion efficiency is still low due to the limit harvest of solar radiation, and lower carrier separation and transport efficiencies in PEC system. In this case, two-dimensional semiconductor NPLs shows encouraging features for hydrogen generation, with the advantages of tunable absorption spectrum matching with solar spectrum, large surface area that can offer more active catalytic sites, which can also mimic the photosynthetic process within a leaf by splitting water to produce hydrogen or oxygen fuels.54-58 For example, Bi
2S3 sensitized WO3 NPLs arrays shows
enhanced PEC performance with photocurrent density of ~8.0 mA/cm-2 at -0.1 V vs Ag/AgCl reference electrode,59 which is active under visible light.59
Figure 1.7 (a) Schemetic demonstration of a water-splitting cell.52 (b) Band positions of several semiconductors
in contact with aqueous electrolyte at pH 1. On the right side the standard potentials of several redox couples are presented against the standard hydrogen electrode potential. The energy scale is indicated in electron volts using either the normal hydrogen electrode (NHE) or the vacuum level as a reference.53
Moreover, ultrathin NPLs (for example In2S3 porous sheets58 and CdS nanosheets60) have been
widely studied and applied for hydrogen generation (or water splitting) in PEC system, exhibiting excellent photocatalytic performance, such as high carrier mobility and transfer rate, relatively high photocurrent density at certain applied potential for hydrogen generation reaction. Therefore, the synthesis of ultrathin NPLs with broad absorption spectrum could be an efficient approach to enhance solar-to-hydrogen efficiency and stability. In this thesis, I will focus on the preparation of photoanodes based on nanoplatelets (NPLs) for hydrogen generation.
1.6 Thesis objectives and contributions of this work
As described in the introduction of LSCs (Chapter 1.4), it is quite challenging to fabricate highly efficient, stable and environment friendly large-area QDs based LSCs. Specifically, the design and synthesis of efficient emitter is of significant importance for LSCs application. Efficient emitter requires the following features, (1) relatively high QY; (2) broad absorption spectrum matching with solar radiation; (3) small or zero overlap between absorption and emission spectra; (4) heavy
metal-free materials; (5) high and long-term stability in polymer matrix under illumination and ambient condition; (6) simple and green synthesis method.
To address the above issues, I plan to synthesize efficient PL emitters (semiconductor QDs) for LSCs, and fabricate large-area LSCs based on as-prepared QDs.
1. Synthesize high-QY emitter (perovskite QDs) with tailored Stokes shift, and characterize perovskite QDs based LSCs.
2. Synthesize NIR PbS/CdS QDs with large Stokes shift for LSCs fabrication, and characterize PbS/CdS QDs based LSCs.
3. Use of “green” carbon quantum dots (C-dots) for LSCs fabrication via simple method, and characterize C-dots QDs based LSCs.
The synthesis of ultrathin NPLs with wide absorption spectrum is also demanding for the hydrogen generation application, enhancing the solar-to-hydrogen conversion efficiency and long-term stability.
I plan to synthesis ultrathin NPLs with broad absorption spectrum for solar-driven hydrogen generation.The objectives of my projects are in the following:
1. Synthesis of ultrathin NIR NPLs with broad absorption and high photostability.
2. Apply the as-obtained NIR NPLs as light absorbers and sensitizers for photoanode fabrication in solar-driven hydrogen generation application.
1.7 Thesis organization
This thesis is divided into six parts and organized as follows:
Chapter 2 presents the synthesis and characterization of high-QY mixed-halide perovskite CsPb(BrxI1-x)3 QDs with tunable Stokes shift via varying concentration ratio of Br/I precursors,
and investigate the optical performance (optical efficiency, quantum efficiency and stability) of LSCs based on mixed-halide perovskite CsPb(BrxI1-x)3 QDs.61 The publication related to this
chapter is:
61. H. Zhao, Y. Zhou, Benetti, D.; Ma, D.; Rosei, F. Nano Energy 2017, 37, 214. (: equal contribution)
Chapter 3 presents the synthesis and characterization of core/shell PbS/CdS QDs with engineered Stokes shift by tailoring core size and shell thickness, and discuss the optical performance (optical efficiency, quantum efficiency and stability) of LSCs based on core/shell PbS/CdS QDs.62 The publication related to this chapter is:
62. Zhou, Y.; Benetti, D.; Fan, Z.; Zhao, H.; Ma, D.; Govorov, A. O.; Vomiero, A.; Rosei, F. Adv.
Energy Mater. 2016, 6, 1501913.
Chapter 4 presents the synthesis of non-toxicity, low-cost C-dots fabrication via simple method using relatively earth-abundant carbon based feedstock. In addition, I investigate optical properties of surface modified C-dots and the optical performance of large-area C-dots based LSCs.63 The publication related to this chapter is:
63. Zhou, Y.; Benetti, D.; Tong, X.; Jin, L.; Wang, Z. M.; Ma, D.; Zhao, H.; Rosei, F. Nano Energy 2018, 44, 378.
Chapter 5 presents the synthesis of NIR ultrathin PbSe1-xSx NPLs via cation exchange using
of PbSe1-xSx NPLs. Finally, we study the performance of PbSe1-xSx NPLs based photoanode in
application solar-driven hydrogen generation.64 The publication related to this chapter is:
64.Zhou, Y.; Celikin, M.; Camellini, A.; Sirigu, G.; Tong, X.; Jin, L.; Basu, K.; Tong, X.; Barba, D.; Ma, D.; Sun, S.; Vidal, F.; Zavelani-Rossi, M.; Wang, Z. M.; Zhao, H.; Vomiero, A.; Rosei, F.
Adv. Energy Mater. 2017, 7, 1602728.
Chapter 6 briefly summarizes important contributions of this work and states future challenges in this field.
Following the main body of thesis is an appendix providing a summary of this thesis in French as per INRS requirements.
Chapter 2 Synthesis and characterization of perovskite
quantum dots based luminescent solar concentrator
In this chapter, I discuss the synthesis and optical properties of inorganic mixed-halide perovskite CsPb(BrxI1-x)3 QDs with different feeding ratios of Br/I. The resulting perovskite QDs with high
PLQY of over 60% and small overlap of absorption and emission spectra has been applied as emitter for LSC application (Figure 2.1). Additionally, the optical performance and photostability of LSCs under long-term UV illumination have been investigated.
Figure 2.1 (a) Scheme of a typical LSC configuration. (b) Cubic structure of mixed-halide perovskite QDs of
CsPb(BrxI1-x)3.
2.1 Synthesis and characterization of perovskite quantum dots
Colloidal hybrid organic-inorganic and inorganic perovskite QDs have been synthesized and used as building blocks in a variety of devices.65-72 Among various kinds of perovskite QDs, inorganic CsPbX3 (X = Cl, Br, I) QDs have been widely studied for optoelectronic applications in view of
their size/compositional dependent absorption and emission spectra, wide absorption spectrum, high brightness with a PLQY up to 90% or unity, narrow emission linewidth, easy solution phase synthesis and good photostability.65,66,68,69 Inorganic perovskite QDs may represent a new
A hot injection synthetic method was used to synthesize colloidal perovskite QDs according to procedures found in the literature.70,71 Firstly, the precursor Cs-oleate was synthesized.
Specifically, a solution of oleic acid (OA, 0.6 mL) and Cs2CO3 (0.2 g) in 7.5 mL of 1-octadecene
(ODE) was stirred and heated to 200 °C until the Cs2CO3 was completely dissolved. Then the
mixture was kept at 130 °C for one hour under vacuum. The temperature of the Cs-oleate mixture was kept at least at 80 °C to avoid precipitation.
Mixed-halide perovskites of CsPb(BrxI1-x)3 were synthesized by using a hot injection approach.
Typically, in a 100 mL round-bottom flask, OA (2 mL), oleylamine (OLA, 2 mL), ODE (20 mL) and 290 mg of PbBr2 (or 368 mg PbI2) were degassed at 100 C for 30 min. The reaction flask was
re-stored with N2 and heated to 130 °C for 30 min under vacuum. The temperature was further
increased to 160 °C, followed by the rapid injection of 1.8 mL of Cs-oleate solution. The reaction was kept at 160 °C for 5 seconds and then the solution was rapidly cooled by the water bath. For the synthesis of the mixed-halide perovskite QDs, a mixture of PbBr2/ PbI2 with different molar
ratios (1:9, 2:8, 3:7, 4:6 and 5:5) was used as halide precursors. All other reaction conditions, such as injection temperature and reaction time are the same with the synthesis of CsPbBr3 or CsPbI3
QDs. Butanol was added, then the suspension was centrifuged and the supernatant was removed. The QDs were then re-dispersed in toluene for further characterization. The as-prepared QDs are very sensitive to moisture and need to be kept in a desiccator or a refrigerator at -10 C.
2.1.2 Structure and optical properties
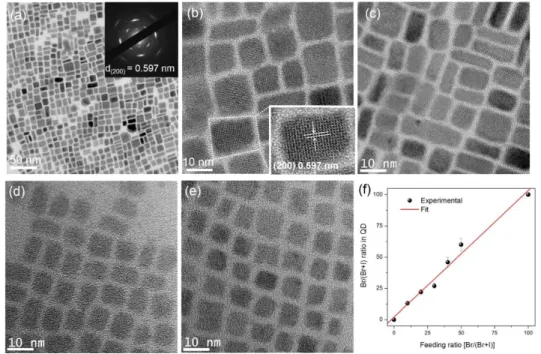
Transmission electron microscopy (TEM) was used to characterize sizes and morphologies of as-synthesized QDs (Figure 2.2). As shown in Figures 2.2a,b,c, mixed-halide CsPb(BrxI1-x)3 QDs
show a typical cubic/cuboidal shape with size between 11-15 nm. For example, CsPb(Br0.4I0.6)3
CsPbI3 and CsPbBr3 QDs show a cubic shape with more uniform size of 7.9 0.3 nm and 8.5
0.3 nm ( < 7%) respectively (Figures 2.2d,e and 2.3a,b). The crystal lattice is clearly visible by high resolution TEM (HRTEM) imaging (Figures 2.2b-e). The inset in Figure 2.1b displays a micrograph of an individual CsPb(Br0.4I0.6)3 QD with a lattice spacing of ~0.597 nm which is well
indexed to the (200) plane of the cubic phase, consistently with previous reports.70,71
Figure 2.2 Representative TEM images of CsPb(BrxI1-x)3 QDs (a-e). (a) A large-area TEM image and
corresponding SAED pattern (inset) of CsPb(Br0.4I0.6)3 QDs. HRTEM images of CsPb(Br0.4I0.6)3 QDs (b),
CsPb(Br0.5I0.5)3 QDs (c), CsPbI3 QDs (d), and CsPbBr3 QDs (e). Inset of (b): a HRTEM image of an individual
Figure 2.3 Size distribution of perovskite QDs of (a) CsPbBr3 QDs (8.5 0.3 nm), (b) CsPbI3 QDs (7.9 0.3
nm) and (c) CsPb(Br0.4I0.6)3 QDs (12.9 1.7 nm).
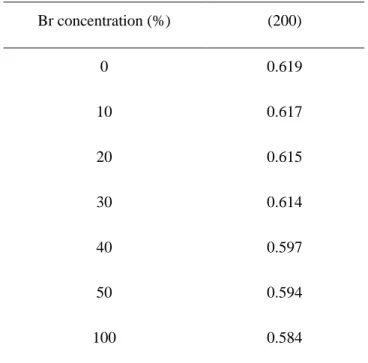
The typical cubic structure of mixed-halide perovskite is shown in Figure 2.2b. The lattice distances further measured by selected area electron diffraction (SAED) patterns of CsPb(Br0.4I0.6)3
(inset image of Figure 2.2a) and other perovskite QDs are well indexed to the (200) planes of cubic phase. The measured lattice spacing of (200) decreases with the increase of Br concentration, due to the larger lattice spacing in CsPbI3 compared to CsPbBr3 (Table 2.1).The corresponding
energy-dispersive X-ray spectroscopy (EDX) spectrum of an individual CsPb(BrxI1-x)3 QD with feeding
ratio of 40% (Br/[Br+I]) confirms the presence of elemental Cs, Pb, Br/I and 1:1:3 atomic ratio for CsPbX3 (Figure 2.4). Based on the EDX analysis, with increase of feeding ratio of Br/(Br+I), the
real concentration of Br in BrxI1-x increases linearly, indicating the successful control of the
Table 2.1 D-spacings of perovskite QDs with variations of Br concentration.
Figure 2.4 EDX of an individual CsPb(Br0.4I0.6)3 QD.
The absorption and PL spectra of colloidal CsPb(BrxI1-x)3 QDs with various chemical compositions
are reported in Figure 2.5a. The absorption spectrum acquired from perovskite QDs can be tuned over the entire window of visible wavelength (300-700 nm) by adjusting their chemical composition (ratio of halide precursors), which allows an efficient capture of solar radiation in this
Br concentration (%) (200) 0 0.619 10 0.617 20 0.615 30 0.614 40 0.597 50 0.594 100 0.584
spectral range. The first-excitonic absorption peak shifts to red gradually with the decrease of Br concentration, consistently with the red-shift of the PL peak. Compared to CsPbX3 (X= Br, I) QDs
with PL full width at half maximum (FWHM) of ~17-20 nm, the broadening in the FWHM in mixed-halide perovskite QDs (~35 nm) is due to their lower size uniformity (Figure 2.3). The as-synthesized CsPbI3 QDs show a typical QY of ~20 2% after purification. This is much lower
compared to values of 40-70% reported in the literature,65,66,68,69 which is possibly due to their sensitivity to moisture, since the purification procedure was carried out under normal ambient conditions with average humidity of ~40%.69 In contrast, mixed-halide QDs exhibit higher QYs
compared to CsPbI3 QDs. When x is over 10%, the QYs of QDs exceed 60%. The CsPbBr3 QDs
show a highest QY of 90%. In addition, mixed-halide QDs or CsPbBr3 QDs exhibit a very good
stability compared to CsPbI3 QDs. There is no significant QY variation after keeping the
CsPb(BrxI1-x)3 samples in -10 C or in a desiccator (20 C) for 3 months. Compared to CsPbBr3
QDs or CsPbI3 QDs, the mixed-halide perovskite CsPb(BrxI1-x)3 QDs (x=0.1, 0.2, 0.3, 0.4)
represent a better separation between the absorption and emission spectra (Figure 2.5a). This feature has been associated with a Stokes shift as mentioned above. As shown in Figure 2.5b, mixed-halide perovskite QDs exhibit a two-fold larger Stokes shift compared to CsPbX3 (X=Br,
I) QDs, which could reduce the energy loss in large-area LSCs. The large Stokes shift has also been found in small-sized CsPbI3 QDs (< 5 nm) synthesized via a non-injection approach.69 In
colloidal QDs, typically a Stokes shift arises from a combination of the effects of band-edge fine-structure splitting, phonon-assisted emission and size polydispersity.73,74 Herein, the larger Stokes shift in mixed-halide QDs may originate from their larger size distribution compared to single perovskite QDs. As shown in Figure 2.3, the standard deviation ( ~15%) of mixed-halide QDs is two-fold of that of pure perovskite QDs ( ~7%). The larger size distribution leads to the
self-quenching of the PL as high energy photons emitted by smaller QDs may be absorbed by larger QDs with a narrower bandgap.73 This effect leads to the red-shift of PL peaks and the decrease in
PLQY. Because the absorption peak does not change, the red-shifted PL peak leads to a larger Stokes-shift in mixed halide QDs.73 This self PL quenching also leads to a decrease of QY due to the reabsorption energy loss (Figure 2.5b) in mixed-halide QDs compared to CsPbBr3 QDs. PL
decay curves of perovskite QDs with different Br concentrations are shown in Figure 2.5c,d. The PL lifetime of CsPbBr3 QDs is around 9 ns and that of mixed-halide QDs is in the range of 18-21
ns, which are consistent with the reported values for high-QY perovskite QDs.68 Typically, the PL lifetime of CsPbI3 QDs is longer than those of both CsPbBr3 QDs and mixed-halide QDs. In our
case, although the QY of CsPbI3 QDs is lower (~ 20%) which is mainly due to the increase of
non-radiative decay rate induced by traps/defects,48,68,69,71 resulting in shorter PL lifetime, the observed PL lifetime of CsPbI3 QDs (26 ns) is still longer than those of both CsPbBr3 QDs and mixed-halide
Figure 2.5 (a) Absorption and PL spectra of CsPb(BrxI1-x)3 QDs with various chemical compositions (x = 0-1).
(b) QY and Stokes shift variations with various Br concentration. Fluorescence decays (c) and lifetimes (d) of CsPb(BrxI1-x)3 QDs of various chemical compositions in toluene. The excitation wavelength is ex=444 nm. The
values of the apparent Stokes shift are obtained from the difference in the positions of the lowest-energy minimum in the second derivative of the absorption spectrum and the PL peak position.
2.2
Fabrication and measurement of perovskite quantum dots based
luminescent solar concentrators
By tuning the ratio of Br/I, the Stokes shift engineered perovskite QDs have been synthesized, exhibiting high PLQY (60-90%). In next step, I focus on the fabrication of large-area LSCs using CsPbBr3 and mixed-halide perovskite QDs with different Stokes shifts and PLQYs, and investigate
their optical performance and long-term photostability.
2.2.1 Fabrication of perovskite quantum dots based luminescent solar concentrators
We quantify the reabsorption by introduction of a parameter of quality factor (QF, defined as the
absorption coefficient (α2) at the emission peak) as shown in Figure 2.6.75 This parameter (QF) is
four in CsPb(Br0.8I0.2)3 QDs, which is four times higher than that of CsPbBr3 QDs (QF = 0.97).
This is consistent with the larger Stokes shift in mixed-halide QDs, indicating a small overlap of absorption and emission spectra in mixed halide QDs.75 The as-synthesized perovskite QDs were dispersed into monomers of lauryl methacrylate and crosslinking agent of ethylene glycol dimethacrylate (wt% of 5:1) and a UV initiator (diphenyl(2,4,6-trimethylbenzoyl)phosphine oxide.22,51,62 Crosslinked poly(lauryl methacrylate) (PLMA) has long side chains that can interact
with surface long-chain ligands to prevent agglomeration of the QDs during polymerization.22,48,51,62 In addition, by carefully controlling the polymerization conditions, such as molar ratio between the monomer and cross-linker, crosslinked PLMA exhibits high-optical-quality, such as high-transparency in the visible and NIR range (> 95%, better than PMMA).22,46,62 The high quality of PLMA with less unconverted monomers has been widely used as polymer matrix in high efficiency LSCs based on colloidal QDs.22,46,51,62 As perovskite QDs are very sensitive to moisture, the monomers lauryl methacrylate and ethylene glycol dimethacrylate have to be pumped to remove moisture before mixing with perovskite QDs. After polymerization, perovskite QDs are embedded into crosslinked PLMA-EGDA polymer matrix. As shown in Figure 2.7a, the square large-area LSC (0.2 × 6 × 6 cm3) appears semi-transparent in ambient
environment, and a clear concentrated red light can be seen from the edges (Figure 2.7b), when the top surface of the LSC is partially placed under one sun illumination (100 mW/cm2). Figure 2.7c presents a photograph of two overlapping LSCs using CsPbBr3 QDs (green) and
CsPb(Br0.2I0.8)3 (red) QDs under UV illumination, in which both bright green and red emission are
clearly visible, indicating the possible fabrication of tandem semi-transparent LSCs using perovskite QDs.76
Figure 2.6 Overlap between absorption and emission spectra of the CsPbBr3 and CsPb(I0.8Br0.2)3 QDs with
similar concentration.
Figure 2.7 Photographs of the LSC comprising CsPb(Br0.2I0.8)3 QDs (red light) and CsPbBr3 QDs (green light)
under ambient (a), one sun (100 mW/cm2) (b), and UV illumination (c). LSC dimensions, 6 × 6 × 0.2 cm3. (d)
Absorption and PL spectra measured at different optical paths for the CsPb(Br0.2I0.8)3 QD and CsPbBr3 QDs
based LSCs. (e) PL decay curves for CsPb(Br0.2I0.8)3 QDs in toluene and polymer matrix (excitation at 440 nm).
2.2.2 Optical performance measurement and simulation of perovskite quantum dots based luminescent solar concentrators
LSCs based on mixed-halide perovskite QDs exhibit an absorption spectrum in the wavelength range 300~650 nm (Figure 2.7d). No significant changes in the PL peak positions or FWHM have been found for the investigated samples before (in solution) and after embedding the QDs into the polymer matrix (Figure 2.7c,d). We estimated the relative QYs of QDs in polymer matrix by considering the variations in lifetime.46,62
The QY can be expressed as: 𝑄𝑌 = 𝑘rad
𝑘nr+𝑘rad (2.1)
Where krad and knr are the radiative and the non-radiative decay rate, respectively.
The measured lifetime is equal to:
𝜏 = 1
𝑘rad+𝑘nr (2.2)
The absence of additional non-radiative decay channels (knr) in the CsPb(BrxI1-x)3 QDs/polymer
are confirmed by PL decay measurements, which show identical dynamics for the CsPb(BrxI1-x)3
in toluene and after encapsulation in the polymer (Figure 2.7e), indicating that the preparation process does not lead to the formation of a significant density of surface-defects/traps.46,77 The
polymerization process only affects knr of QDs.46 Since the measured lifetime of investigated
CsPb(BrxI1-x)3 QDs does not change after embedding them in the polymer, we can deduce that the
factor (krad + knr) does not change either.46 This is a clear indication that the mixed-halide QDs
embedded in the polymer keep almost the same QY as in solution.78,79 These results clearly confirm that the mixed-halide CsPb(BrxI1-x)3 QDs present a better photostability under high dose UV
illumination (~40 W/cm2). The PL does not vary significantly during the further storage of LSCs under ambient condition for 5 months due to the protection of polymer which can protect the QDs from exposure to moisture or oxygen.48,67,78-80
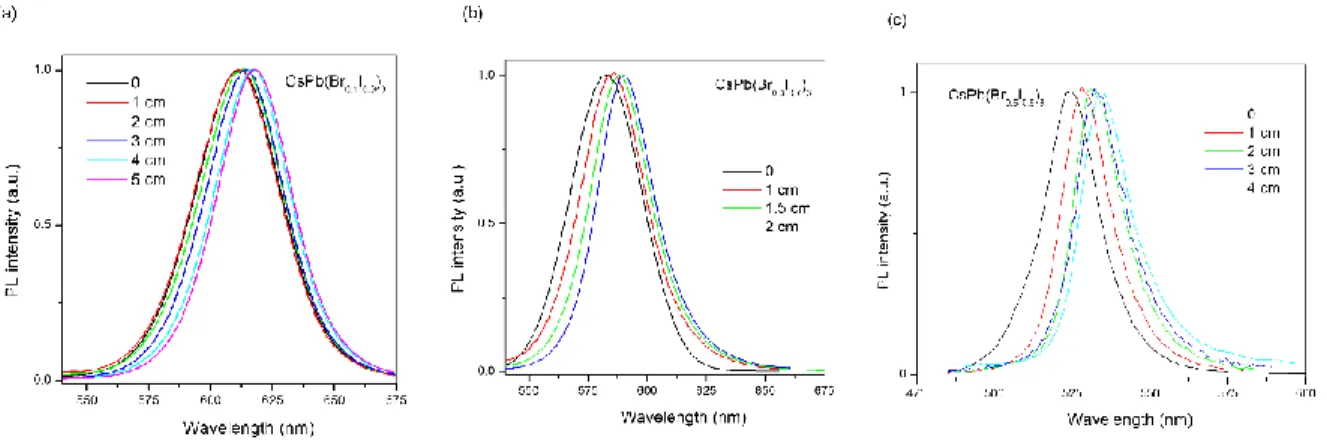
Figure 2.8 PL spectra measured at different optical paths for the LSCs based on CsPb(Br0.1I0.9)3 (a),
CsPb(Br0.3I0.7)3 (b) and CsPb(Br0.5I0.5)3 (c).
We further measured the absorption and PL spectra of perovskite QD based LSCs at different optical paths for the mixed-halide CsPb(BrxI1-x)3 and CsPbBr3 QD based LSCs (Figures 2.7d, 2.8).
The overlap between absorption and emission spectra is significantly larger in CsPbBr3 compared
to CsPb(Br0.2I1-0.8)3. Specifically, the PL signals from the LSC are recorded at a certain distance
between the edge and vertically illuminated spot at excitation wavelength of 440 nm (Figure 2.8). We plotted the integrated PL area as a function of the optical paths. As shown in Figure 2.7f, the integrated PL area ratio of CsPb(Br0.2I1-0.8)3 QDs remains 0.5 in 6-cm LSC, which is higher than
0.3 in 6-cm LSC based on CsPbBr3 QDs due to the escaped and reabsorbed energy loss. The
normalized PL spectra are shown in Figure 2.7d. Without reabsorption in QDs based LSC, the PL spectra will not change by increasing the optical path.22 The change in the PL signal with respect to PL FWHM and PL peak position can only occur due to spectral distortion because of light reabsorption by the perovskite QDs.48 In our case, by increasing the optical path, the PL spectra of
both types of QDs exhibit a red-shift up to 8 nm with a narrowing of the PL FWHM which confirms the energy loss due to light reabsorption (Figures 2.7d, 2.8). In future work, we plan to investigate the mechanisms of energy loss in LSCs.81 The reduced reabsorption loss and high external optical efficiency make mixed-halide perovskite QDs potentially excellent candidates for fabricating large-area high-efficiency LSCs.
Standardization of efficiency measurements in LSCs are still an open issue. For this reason, to allow a fair comparison of our results with previous achievements in the literature, in this study we used the set-up described in literature (Figure 2.9).46,51,62 The LSC (dimension: 0.2 × 1.5 × 11 cm3) was illuminated perpendicular to its surface by a 1.5 AM global solar simulator (100 mW/cm2). In the photograph (Figure 2.9a), a standard silicon solar cell with known external quantum efficiency (Figure 2.9b), also called incident photon-to-electron conversion efficiency (IPCE) was coupled with one of the edges of the LSC. Other three edges were coupled by optical mirrors.
Figure 2.9 (a) Photograph of a perovskite QD based LSC during optical power conversion efficiency
measurements with illumination from a solar simulator (1.5 AM global, 100 mW/cm2). A silicon solar cell
(1.50.3 cm2) is coupled with one edge of the LSC. (b) External Quantum Efficiency (EQE) of the Silicon cell