UNIVERSITÉ DE SHERBROOKE
Faculté de génie
Département de génie chimique et de génie biotechnologie
SUIVI DES CONCENTRATIONS DE POUDRES
PHARMACEUTIQUES LORS DE LA
COMPRESSION PAR SPECTROSCOPIE PROCHE
INFRAROUGE ET IMAGERIE SPECTRALE
Monitoring pharmaceutical powder concentrations inside a tablet press using
near-infrared spectroscopy and spectral imaging
Mémoire de doctorat
Spécialité: Génie chimique
Himmat Madhukar DALVI
Sherbrooke (Québec) Canada
Août 2018
MEMBRES DU JURY
Ryan GOSSELIN
(Directeur)Nicolas ABATZOGLOU
(Co-directeur)François GITZHOFER
(Évaluateur & Rapporteur)Lauren BRIENS
(Évaluatrice)Jean-Maxime GUAY
iii
To,
i
ABSTRACT
Pharmaceutical manufacturing has been undergoing a paradigm shift from ‘quality by testing’ to ‘quality by design’ in recent years. In the new scenario, along with a thorough understanding of product and process parameters, continuous monitoring of critical process parameters and critical quality attributes has paramount importance in order to ensure consistent product quality. Process analytical technology (PAT) tools e.g. Near-infrared spectroscopy (NIRS) are rapidly being developed for the purpose of monitoring product attributes during different stages of product manufacturing. With the advent of real-time release testing (RTRt) concept in the pharmaceutical industry, the need for monitoring all of the critical manufacturing steps is even more intensified. Consequently, there is a growing need to develop innovative and robust PAT tools for process understanding, monitoring, and control.
This Ph.D. work is directed to monitoring powder blend concentrations inside the feed frame during the tablet compression process. More specifically, near-infrared chemical imaging (NIR CI) has been introduced as a new PAT tool for feed frame monitoring comparing with NIRS as the reference method. NIR CI (‘area scan’-using discrete wavelength filter in front of NIR camera and ‘line scan’-using spectrograph in front of NIR camera) is capable of providing spectral and spatial information, both at the same time. This thesis also substantially contributes to increasing the available knowledge base on NIRS-based PAT methods for feed frame monitoring.
In the present work, the feasibility of NIR CI as a new PAT method for feed frame monitoring is verified in a 2 wheel feed frame of (Manesty Novapress) tablet compression machine both off-line and in-line. Following the optimization of sample presentation and data acquisition, the suitability of NIR CI (area scan) for feed frame concentration monitoring is evaluated in a simple composition comprising single active and 2 non-active ingredients. NIR CI is also evaluated for detecting segregation potential of the powder blends, in addition to concentration prediction (alone and in combination with NIRS). The initial off-line feasibility study led to the evaluation of in-line concentration monitoring in a pharmaceutically relevant tablet blend (single active and 5 non-active ingredients). Feed frame concentrations are compared with compressed tablets tested in-line and off-line with NIRS. Stratified tablet samples collected during the compression are also tested with ultraviolet (UV) spectroscopic
analysis for assay comparison. Finally concentration monitoring for a complex pharmaceutical blend containing 2 actives and 5 non-active ingredients) is evaluated using NIR CI (line scan) and NIRS.
NIR CI (area scan) has been found to be suitable for concentration monitoring in comparison to NIRS. NIR CI has 5x larger tested sample volume than NIRS in imaging conditions (NIR light penetration, sample area covered by NIR CI, sample density) applied in the present work. NIR CI (area scan) has been found to be suitable to detect the presence of powder blend segregation inside the feed frame. In comparatively complex pharmaceutical blend compositions, NIR CI (area scan) captures gross concentration changes as low as 2% w/w but with slightly lower signal-to-noise ratio in comparison to NIRS. Feed frame concentrations as predicted by NIRS and NIR CI closely match with compressed tablet concentrations when tested by NIRS as well as UV assay. The geometry of feed frame and placement of PAT tools inside the feed frame govern the delay in onset of concurrent concentration change in the tablets.
NIR CI (line scan) has been found successful to monitor the concentration of 2 active ingredients in a complex powder blend with a higher signal-to-noise ratio as compared to NIR CI (area scan). NIRS and NIR CI (line scan) predicted concentrations of both the actives at a similar spatial location inside the feed frame matched closely indicating similar concentration monitoring performance of these PAT tools. Capturing the entire area of the powder inside feed frame, NIR CI (line scan) gives data equivalent to multiple NIRS probes placed side by side inside the feed frame. This is certainly an advantage over NIRS since side by side placement of multiple NIR probes is not feasible considering the geometry of feed frame. Off-line calibration models have been successfully transferred to in-Off-line monitoring; such an approach can potentially offer high material and human resource savings when monitoring newer formulations.
Overall this Ph.D. thesis successfully demonstrates the feasibility and advantages of NIR CI for feed frame monitoring in comparison to NIRS. It has the potential to become a PAT workhorse alone or along with the NIRS methods for pharmaceutical process monitoring.
Keywords: PAT; NIRS; NIR CI; RTRt; segregation; concentration monitoring; in-line;
iii
RÉSUMÉ
Ces dernières années, la fabrication des produits pharmaceutiques a connu un changement de paradigme passant de la « qualité par le contrôle » à la « qualité par la conception ». Dans le nouveau modèle de pensée, le contrôle continu des paramètres critiques de procédé et des attributs critiques de la qualité, de même que la compréhension approfondie des paramètres de produit et de procédé, revêt une importance primordiale afin d’assurer une qualité cohérente du produit pharmaceutique. Les outils de technologie analytique des procédés (PAT), par exemple la spectroscopie proche infrarouge (NIRS), se développent rapidement dans le but de surveiller les attributs qualité du produit au cours des différentes étapes de fabrication. Avec l’arrivée de concept de test de libération en temps réel (RTRt) dans l’industrie pharmaceutique, le besoin de surveiller toutes les étapes critiques de la fabrication se renforce. C’est pourquoi il est de plus en plus nécessaire de développer des outils PAT innovants et robustes pour la compréhension, le contrôle et la maîtrise des procédés.
Ce travail de doctorat vise à contrôler les concentrations de mélanges de poudre à l’intérieur de la trémie d’alimentation pendant le procédé de compression des comprimés. Plus précisément, l’imagerie chimique en proche infrarouge (NIR CI) est introduite comme un nouvel outil PAT pour le contrôle du système d’alimentation, en comparaison avec la NIRS, méthode de référence. La NIR CI est capable de fournir des informations spectrales et spatiales, et celles-ci en même temps. Cette thèse contribue également à l’augmentation considérable de la connaissance sur les méthodes PAT basées sur la NIRS pour le contrôle du système d’alimentation.
Dans ce travail, la faisabilité de la NIR CI en tant que nouvelle méthode PAT pour la surveillance du système d’alimentation est vérifiée hors-ligne et en ligne, dans une trémie d’alimentation à deux roues de la machine de compression (Manesty Novapress). Après l’optimisation de la préparation des échantillons et de l’acquisition des données, la pertinence de la NIR CI pour le contrôle de la concentration dans la trémie d’alimentation est évaluée à partir d’un mélange simple comprenant un principe actif et deux excipients inertes. La NIR CI est également évaluée pour son potentiel de détection de la ségrégation des mélanges de poudres, en plus de la prévision de la concentration (seul et en combinaison avec la NIRS). L’étude initiale de faisabilité, effectuée hors ligne, a conduit à l’évaluation du contrôle de la concentration en ligne dans un mélange approprié de comprimés pharmaceutiques (1 principe
actif et 5 excipients inertes). Les concentrations dans la trémie d’alimentation sont comparées aux comprimés testés par NIRS en ligne et hors ligne. Des échantillons de comprimés stratifiés collectés pendant la compression sont également testés par spectroscopiques UV pour la comparaison des dosages. Enfin, la surveillance de la concentration d’un mélange pharmaceutique complexe contenant 2 principes actifs et 5 excipients inertes est faite par NIR CI (balayage linéaire) et NIRS.
La NIR CI (d’image globale), en comparaison à la NIRS, est réputée adaptée au contrôle de la concentration. La NIR CI permet de tester un volume d’échantillon 5 fois supérieur à la NIRS, dans les conditions d’imagerie appliquées (entrée de lumière NIR, surface d’échantillon couverte par NIR CI, densité d’échantillon) des travaux actuels. La NIR CI est réputée appropriée pour détecter la ségrégation d’un mélange de poudres dans la trémie d’alimentation. Dans des mélanges pharmaceutiques relativement complexes, la NIR CI détecte des variations de concentrations brutes aussi faibles que 2 % w/w, mais avec un rapport signal/bruit légèrement plus faible que la NIRS. Les concentrations dans la trémie d’alimentation prédite par la NIRS et la NIR CI correspondent de près aux concentrations des comprimés lorsqu’elles sont testées par NIRS, ainsi que par dosage UV. La géométrie de la trémie d’alimentation et la mise en place d’outils PAT à l’intérieur du système d’alimentation déterminent le délai de début du changement simultané de la concentration dans les comprimés.
Le balayage linéaire NIR CI est connu pour contrôler avec succès la concentration de 2 ingrédients actifs dans un mélange de poudre complexe avec un rapport signal sur bruit plus élevé par rapport à la NIR CI à filtre unique. La NIRS et NIR CI (balayage linéaire) prévoient des concentrations des deux actifs aux emplacements spacieux similaires à l’intérieur de la trémie d’alimentation correspondent étroitement indiquant une performance de surveillance de la concentration similaire de ces outils PAT.
Capturant la totalité de la surface de la poudre dans la trémie d’alimentation, la NIR CI (balayage linéaire) fournit des données équivalentes à plusieurs sondes NIRS placées côte à côte à l’intérieur du système d’alimentation. Ceci est certainement un avantage par rapport à la NIRS, car un tel placement de sondes NIR n’est pas réalisable compte tenu de la géométrie de la trémie d’alimentation. Les modèles d’étalonnage hors ligne ont été remplacés avec succès
v
par des modèles en ligne ; une telle approche peut potentiellement offrir des économies importantes en matériel et en ressources humaines lors du contrôle de nouvelles formulations.
Dans l’ensemble, cette thèse de doctorat démontre avec succès la faisabilité et les avantages de la NIR CI par rapport à la NIRS pour le contrôle dans la trémie d’alimentation. Elle a le potentiel de devenir un outil PAT fiable, seul ou avec les méthodes NIRS, pour la surveillance des procédés pharmaceutiques.
Mots-clés : PAT; spectroscopie proche infrarouge (NIRS); l’imagerie chimique en proche
infrarouge (NIR CI); test de libération en temps réel (RTRt); contrôler des concentrations; en ligne; hors ligne
v
ACKNOWLEDGMENTS
Completing doctoral studies had been my long cherished dream. Indeed, this has been a memorable phase of my life and I solemnly express my gratitude to all the people who have directly and indirectly contributed to realizing my dream!
First of all, I would like to thank my research director Prof. Ryan Gosselin for showing confidence in me and offering me this opportunity. I still remember your reply to my first email and your prompt replies ever since! I am also grateful to my research co-director Prof. Nicolas Abatzoglou, you both have been great personal and professional supporters. I will always cherish the learnings and time spent with you.
I am grateful to Jean-Sébastien (Pfizer, Canada) along with Prof. Nicolas Abatzoglou and Prof. Ryan Gosselin for management of Pfizer PAT research chair and allowing me becoming a part of the team.
I would like to thank Jean Maxime Guay for helping me with arranging experimental equipment and materials as well as for all the useful discussions during the development of this work. I would also like to thank all other colleagues from Pfizer including Antoine Cournoyer, Chi-Shi Chen, Pierre Philippe Lapointe Garant, Pierre Luc Bélanger and Alyssa Langlet for their timely help.
I will be always thankful to Marc Couture, Jacques Gagné, Serge Gagnon for their cooperation in the preparation of my experimental setup and other logistics. I am grateful for your availability and accommodating my all ‘urgent’ requests. Marc, I will never forget the patience you showed when I used to practice my French with you- Merci beaucoup! I am also thankful to Sylvie Lebrun and France Auclair for your timely help and guidance in all administrative matters. Huge thanks to Fatiha and Amine for helping me with french translation.
vi
I am grateful to members of the jury (Ryan Gosselin, Nicolas Abatzoglou, Jean-Maxime Guay, Lauren Briens and François Gitzhofer for agreeing to assess my work as well as for their valuable time.
Last 3 years have been very memorable in the research lab due to all the nice colleagues I got to interact. Pedro Durão -thanks for helping me in my initial settlement as well as later working in the laboratory. Clémence and Oumaima -thank you for all your support especially to meet health care and childcare needs of my family. Francis and Philippe- thank you for your help with Matlab and all nice discussions we had. Marie José -thank you for reviewing my writings and all guidance. I am also thankful to other colleagues-Charlotte, Barbara, Azher, Yuwei for making this journey memorable. Along with the laboratory work, I spent most of my time in office with Mounia, Mauricio, Amine, and Frank -thank you for all nice discussions and friendship.
I would also like to thank my friends outside of the university campus- Pavitran, Rajesh, Veeresh, Machindra, Michel, Kiran, Roopesh, Rajani, Charith, Diwakar, Shrivatsa, and all others (the list is truly long!). I would always cherish the memories we made together.
On the family side, I really appreciate all the sacrifices, companionship and support shown by my better half- Priyanka. I am sure; I would not have made my stay possible in Canada without you. While I had ups and downs in the laboratory work, you always sensed them very appropriately and helped me to sail through. I can’t forget to mention the little princes- Ananya who always made me rejoice and forget the unwanted at the end of each day. You both have been really a great driving force for me.
While I am writing this part of my thesis, I remember all the efforts my parents put together to make me successful in my life. I could not have achieved this Ph.D. dream without your support and understanding when I choose to move far away from home. I would always owe you for every success in my life.
vii
CONTENTS
RÉSUMÉ ... iii ACKNOWLEDGMENTS ... v LIST OF TABLES ... xv LEXICON ... xviiLIST OF ACRONYMS ... xxi
CHAPTER 1 INTRODUCTION ... 1
1.1 Context and problem to solve ... 1
1.1.1 Pharmaceutical manufacturing regulations ... 2
1.1.2 Process analytical technology (PAT) initiative ... 4
1.1.3 Pfizer research chair in PAT ... 5
1.1.4 PAT in tablet manufacturing process ... 6
1.1.5 Role of feed frame in tablet compression ... 7
1.2 NIR chemical imaging (NIR CI) ... 8
1.2.1 NIR CI acquisition ... 8
1.2.2 NIR CI set up ... 10
1.2.3 Spectral transformation of NIR images ... 12
1.3 NIR spectroscopy ... 13
1.3.1 NIRS brief theoretical background ... 13
1.3.2 NIRS data collection and pre-treatments ... 15
1.4 Definition of a current research project ... 16
1.5 The objective of the research work... 19
1.6 Original contributions ... 20
1.7 Document plan ... 22
CHAPTER 2 STATE OF THE ART ... 25
2.1 Criticality of feed frame operation ... 25
2.2 NIRS suitability for PAT ... 27
2.3 Pharmaceutical PAT applications of NIRS ... 27
2.4 NIRS PAT applications for feed frame monitoring... 29
2.5 Pharmaceutical PAT applications of NIR CI ... 32
CONTENTS viii
2.6.1 Univariate methods ... 33
2.6.2 Multivariate methods ... 34
CHAPTER 3 Concentration monitoring with NIR CI (area scan) in a tableting press ... 41
3.1 Introduction ... 45
3.1.1 NIRS as PAT tool for tablet manufacturing ... 45
3.1.2 Near-infrared chemical imaging (NIR CI) in feed frame monitoring ... 46
3.2 Materials ... 47
3.3 Methods ... 47
3.3.1 NIR penetration in samples ... 47
3.3.2 Feed frame set-up ... 48
3.3.3 Data acquisition inside the feed frame ... 49
3.3.3.1 NIR probe ... 49
3.3.3.2 NIR camera ... 50
3.3.4 Formulations ... 51
3.3.5 Data acquisition ... 52
3.3.5.1 NIRS ... 52
3.3.5.2 NIR CI (area scan) ... 53
3.3.6 Data treatment ... 53
3.3.7 Data analysis by PCA and PLS ... 55
3.4 Results and discussion ... 56
3.4.1 Sample volume ... 56
3.4.2 Qualitative NIRS analysis ... 58
3.4.3 Qualitative NIR CI (area scan) analysis ... 58
3.4.4 Quantitative analysis ... 60
3.4.5 Average sample image analysis ... 64
3.5 Conclusion ... 66
CHAPTER 4 In-line monitoring of Ibuprofen during and after the tablet compression using NIRS………….. ... 69
4.1 Introduction ... 73
4.1.1 PAT for in-line feed frame monitoring ... 73
ix
4.1.3 PAT for combined feed frame and tablet monitoring ... 75
4.2 Materials ... 76
4.2.1 Formulation composition ... 76
4.3 Equipment and Methods ... 77
4.3.1 Feed frame monitoring (in-line) ... 78
4.3.2 Tablet-monitoring (in-line) ... 79
4.3.3 Tablet testing (off-line) ... 79
4.3.4 NIRS data acquisition and pre-treatment... 80
4.3.5 NIRS wavelength selection ... 81
4.3.6 PCA and PLS analysis ... 83
4.3.7 Kinetics ... 84
4.3.8 Sample volume inside the feed frame... 85
4.4 Results and discussion ... 86
4.4.1 Tablet off-line testing ... 86
4.4.1.1 UV assay testing of tablet sub-samples ... 86
4.4.1.2 NIRS testing of tablet sub-samples ... 86
4.4.2 In-line NIRS qualitative testing inside the feed frame and tablets ... 88
4.4.2.1 Qualitative testing inside the feed frame ... 89
4.4.2.2 Qualitative testing of tablets ... 91
4.4.3 In-line NIRS quantitative testing inside the feed frame and in tablets ... 91
4.4.3.1 Quantitative analysis inside the feed frame ... 91
4.4.3.2 Quantitative tablet testing ... 93
4.4.3.3 Comparison of off-line and in-line PLS in tablet monitoring ... 94
4.4.4 In-line concentration change kinetics ... 95
4.4.4.1 Kinetics inside the feed frame ... 95
4.4.4.2 Kinetics in tablets ... 96
4.4.4.3 Comparison of kinetics inside the feed frame and inside the tablets... 98
4.4.5 Sample volume inside the feed frame... 98
4.5 Conclusion ... 99
CHAPTER 5 In-line concentration monitoring in a multicomponent blend inside the tablet press using NIR CI (area scan) ... 101
CONTENTS x
5.1 Introduction ... 105
5.1.1 NIR CI in feed frame monitoring ... 105
5.2 Materials ... 105
5.3 Methods ... 105
5.3.1 Selection of suitable bandpass NIR filter ... 106
5.3.2 Data Acquisition ... 108
5.3.3 Data treatment and analysis ... 109
5.4 Results and discussion ... 109
5.4.1 Comparison of NIR CI (area scan) and NIRS PLS models ... 109
5.4.2 Comparison of NIR CI (area scan) predicted concentrations with tablet assay ... 112
5.5 Conclusion ... 113
CHAPTER 6 Simultaneous multiple components concentration monitoring inside the tablet press using NIRS and NIR CI (line scan) ... 115
6.1 Introduction ... 119
6.1.1 RTRt in tablet manufacturing ... 119
6.1.2 NIRS in feed frame monitoring ... 120
6.1.3 NIR CI in feed frame monitoring ... 120
6.1.4 NIRS and NIRCI for concentration monitoring inside feed frame ... 121
6.2 Materials and methods ... 122
6.2.1 Materials ... 122
6.2.1.1 Formulation composition ... 122
6.2.2 Equipment and Methods ... 124
6.2.2.1 Feed frame monitoring (In-line) ... 124
6.2.2.2 NIRS data acquisition and pre-treatment ... 125
6.2.2.3 NIR CI (line scan) data acquisition and pre-treatment ... 126
6.2.2.4 NIRS Wavelength selection ... 127
6.2.2.5 PLS calibration and validation models ... 129
6.2.2.6 Comparison of NIRS and NIR CI (line scan) predictions inside feed frame ... 130
6.2.2.7 Sample volume inside feed frame ... 130
6.3 Results and discussion ... 131
xi
6.3.2 Off-line NIR CI (line scan) PLS calibration models ... 132
6.3.3 Comparison of NIRS and NIR CI (line scan) for concentration prediction ... 134
6.3.4 Calibration model transfer off-line (lab) to in-line (production) ... 136
6.3.5 Comparison of NIRS and NIR CI (line scan) predictions inside feed frame ... 137
6.4 Conclusion ... 139
CHAPTER 7 CONCLUSION ... 141
CHAPTER 8 FUTURE PLAN ... 145
ANNEXES ... 147
xii
LIST OF FIGURES
Figure 1.1 : Schematic presentation of a feed frame with 2 paddle wheel ... 8
Figure 1.2 : Schematic reflection of NIR CI [22] ... 10
Figure 1.3 : Schematic representation of hyperspectral NIR CI [20] ... 11
Figure 1.4: Schematic representation of unfolding hyperspectral image [20] ... 13
Figure 1.5: Different functional groups and their NIR absorbance range [27] ... 14
Figure 1.6: Chemical structure of Ibuprofen and Ascorbic acid [28][29] ... 15
Figure 1.7: NIR CI using a single filter (A) and spectrograph (B) ... 18
Figure 2.1: Experimental NIR set up at feed frame [16] ... 31
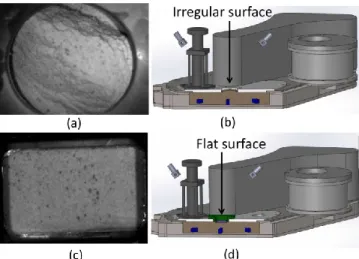
Figure 3.1: Sample tray (a) complete view, and (b) cross-section ... 48
Figure 3.2: Feed frame set-up: (a) Material flow, and (b) NIRS and NIR CI (area scan) locations ... 49
Figure 3.3: NIR CI (area scan) inside the feed frame: without a flat insert (a-top view, b-schematic vertical cross-section), and with a flat surface (c-top view, d-b-schematic vertical cross-section) ... 51
Figure 3.4: (a) NIR reflectance spectra of individual components and composite samples, (b) SG second derivative pretreated spectra of individual components and composite samples ... 54
Figure 3.5: Histogram of a binary image ... 55
Figure 3.6: NIR penetration in samples: (a) PCA score plot NIRS, and (b) NIR CI (area scan) histogram ... 57
Figure 3.7: PCA score plots of NIRS data (Markers with different color represent % w/w content of ascorbic acid in the respective sample) ... 58
Figure 3.8: Pixel intensity histograms of calibration samples (Color represents % w/w content of ascorbic acid in the respective sample) ... 59
Figure 3.9: PCA score plot of NIR CI (area scan) (Markers with different color represent % w/w content of ascorbic acid in the respective sample) ... 60
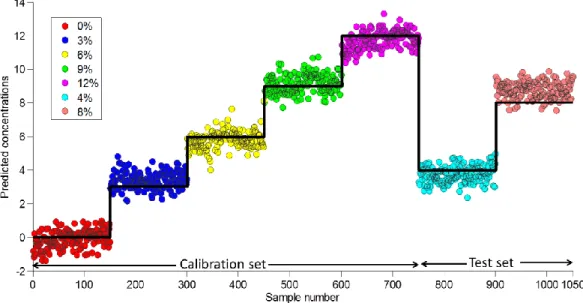
Figure 3.10: Predicted concentrations versus sample in test I with the combined NIRS/NIR CI (area scan) model (Color represents % w/w content of ascorbic acid in the respective sample) ... 63
xiii
Figure 3.11: Trial 2 average sample images (a-f represent the average image of 3%, 4%, 6%, 8%, 9%, and 12% w/w ascorbic acid samples respectively, The blue to red color bar
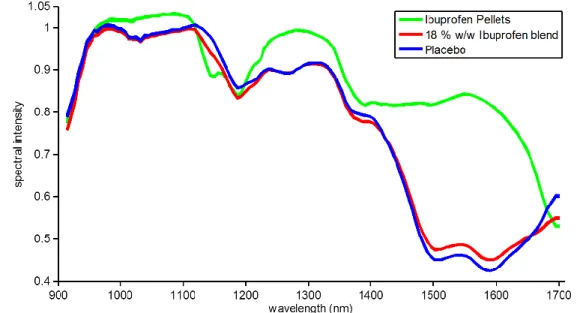
represents decreasing pixel intensity) ... 65 Figure 3.12: Subsections of the image used in the PLS analysis ... 65 Figure 4.1: NIRS location on the feed frame... 78 Figure 4.2: Raw NIR reflectance spectra of Ibuprofen pellets, placebo, and 18 % w/w
Ibuprofen blend compositions ... 81 Figure 4.3: MSC treated full NIR spectra and a selected range of 1100-1250 nm for off-line tablet analysis (a-b), feed frame analysis (c-d) and in-line tablet analysis (e-f) respectively. . 82 Figure 4.4: Plot of UV assay results versus off-line NIRS-predicted Ibuprofen concentrations in tablet sub-samples ... 88 Figure 4.5: (a) Score plot of PC1 for PCA using full NIR spectra (1100-1701 nm). (b) Score plot of PC1 for PCA using selected NIR spectra (1100-1250 nm) inside the feed frame ... 90 Figure 4.6: PC1 values for all tablets using NIR spectra in the 1101-1250-nm range ... 91 Figure 4.7: NIRS PLS-predicted concentrations inside the feed frame and UV assay of tablet sub-samples ... 92 Figure 4.8: NIRS PLS-predicted Ibuprofen concentrations in tablets (average of 28) and UV assay values (no averaging was performed) of tablet sub-samples ... 93 Figure 4.9: PLS-predicted tablet concentrations with off-line and in-line NIRS ... 94 Figure 4.10: Differences in feed frame depth at the first and second wheel ... 97 Figure 4.11: Ibuprofen concentration comparison inside the feed frame and tablets with expected concentration as well as UV assay values of tablet sub-samples ... 98 Figure 5.1: NIR CI (area scan) of 18% w/w Ibuprofen powder blends taken with different bandpass filters ... 106 Figure 5.2: NIR CI (area scan) showing different pixel intensities as a function of different Ibuprofen concentration ... 108 Figure 5.3: NIR CI (area scan) predicted Ibuprofen concentrations inside the feed frame, the expected and NIRS predicted concentrations ... 110 Figure 5.4: Variance in NIRS and NIR CI (area scan) predicted Ibuprofen concentrations inside the feed frame ... 112 Figure 6.1 : NIRS and NIR CI (line scan) location on the feed frame ... 124
LISTE OF FIGURES xiv
Figure 6.2: a) Location of the observation window on the feed frame, b) NIR CI (line scan)
output image and c) NIR spectra obtained by averaging all of the image pixels. ... 127
Figure 6.3: Savitzky-Golay second derivative spectra of Ibuprofen and Ascorbic acid ... 128
Figure 6.4: a) NIRS spectra of key ingredients of the tablet composition and b) NIRS spectra c) NIR CI (line scan) spectra of all blends in off-line trial ... 129
Figure 6.5: NIRS PLS predicted a) Ibuprofen and b) Ascorbic acid concentrations in calibration and validation samples ... 132
Figure 6.6: NIR CI (line scan) PLS predicted a) Ibuprofen and b) Ascorbic acid concentrations in calibration and validation samples ... 133
Figure 6.7: Variance in predicted Ibuprofen concentrations comparing NIR CI (line scan) and NIRS PLS models ... 135
Figure 6.8: Variance in predicted Ascorbic acid concentrations comparing NIR CI (line scan) and NIRS PLS models ... 136
Figure 6.9: a) Plot of NIR CI (line scan) (in the middle section) and NIRS predicted concentrations for Ibuprofen b) Plot of NIR CI (line scan) (in middle sections) and NIRS predicted concentrations for Ascorbic acid ... 138
Figure A.8.1: MicroNIR in SS housing ... 147
Figure A.8.2: Working principle of the linear variable filter (LVF) ... 147
Figure A.8.3: Schematic representations of LVF principle ... 148
Figure A.8.4: Schematic representations of NIR CI scanning and output ... 150
Figure A.8.5: Spectrograph side view ... 150
xv
LIST OF TABLES
Table 2.1 : Representative applications of NIRS-based Chemometric techniques during tablet
manufacturing process ... 37
Table 3.1: Sample compositions in trials 1 and 2 ... 52
Table 3.2: Summary of PLS performance indicators ... 61
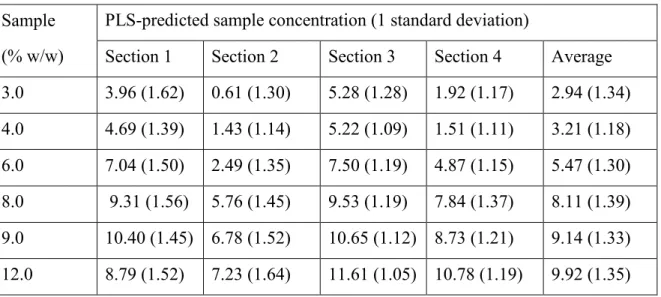
Table 3.3: Summary of PLS-predicted concentrations ... 62
Table 3.4 : Average predicted concentrations in different image sections ... 66
Table 4.1: Formulation composition with five different Ibuprofen levels (all concentration values are in % w/w) ... 77
Table 4.2: NIR spectral acquisition parameters ... 78
Table 4.3: Summary of different PLS models ... 84
Table 4.4: RMSE values at selected wavelength ranges ... 87
Table 4.5: Standard deviation of tablet concentrations by NIRS and UV assay ... 95
Table 4.6: Kinetics of blend concentrations inside the feed frame ... 96
Table 4.7: Kinetics of blend concentrations in tablets ... 97
Table 8: Mean and standard deviation of NIR CI (area scan) and NIRS model predicted concentrations ... 111
xvii
LEXICON
Term Definition Tablet Tablet press Hopper Feed Frame Turret Die Paddle wheel SegregationA pharmaceutical solid dosage form containing a medicament or medicaments with or without suitable excipients which is prepared by compression of the defined powder blend
An equipment used to make the tablets using a defined powder blend
A piece of equipment which holds bulk powder above the tablet press and delivers it to feed frame to fill the dies
Part of the tablet press that receives the powder coming from the hopper and distributes to the dies
A set of 3 concentric wheels which are used to install upper punches, dies and lower punches A cavity on die table/turret in which the powder coming from the feed frame enters to be compressed. It decides the size and shape of the tablet.
A circular wheel with peripherally attached small paddles that keeps the powder circulating inside the feed frame in order to fill into the dies
It is the tendency of particles to separate from bulk according to their individual physical properties such as size, shape, density, etc.
xix
LIST OF SYMBOLS
Symbol Definition Units
Ia Ib Is Ib R ŷ 𝑦0 A k t R B C
Measured intensity of reflected light
Reflectance measured from high reflectance standard Measured intensity of light reflected from the sample Measured instrument response in the dark
Measured diffuse reflectance Predicted relative concentration Initial Concentration
Theoretical Concentration Difference First-Order Rate Constant
Time
NIRS Sample Area NIRS Penetration Depth Sample Bulk Density
gray levels gray level gray level gray level gray level % w/w % w/w % w/w % w/w per min min cm2 mm g/mL
xxi
LIST OF ACRONYMS
Acronym Definition US FDA EMEA MHRA MHLW WHO ICH PAT CGMP CQA CPP QbD NIRS NIR CI MVDA UV DEM SNV MSC API PLS PCA PCR FPA PCs RTRt AA DCP MCC R2adj RMSEC RMSECV RMSEP SG LIF RGB rpm RMSE NIPALSUnited States Food and Drugs Administration European Medicines Evaluation Agency
Medicines and Healthcare Products Regulatory Agency Ministry of Health, Labour, and Welfare
World Health Organization
International Conference on Harmonization Process Analytical Technology
Current good manufacturing practices Critical Quality Attributes
Critical Process Parameters Quality by Design
Near-infrared spectroscopy Near-infrared chemical imaging Multivariate Data Analysis Ultra-violet
Discrete Element Method Standard Normal Variate
Multiplicative Scatter Correction Active Pharmaceutical Ingredient Partial Least Squares
Principal Component Analysis Principal Component Regression Focal Plane Arrays
Principal Components Real Time Release Testing Ascorbic Acid
Dicalcium Phosphate Dihydrate Microcrystalline Cellulose
Adjusted Coefficient of Determination Root Mean Square Error in Calibration Root Mean Square Error in Cross-Validation Root Mean Square Error in Prediction Savitzky-Golay
Light-Induced Fluorescence Red-Green-Blue
Revolutions per Minute Root Mean Square Error
1
CHAPTER 1 INTRODUCTION
1.1 Context and problem to solve
The availability of safe and efficacious medications is nothing less than the basic needs ofe all human beings. Consequently, regulatory authorities at regional, national and international levels have been established to govern the quality, safety, efficacy and availability aspects of the medicinal preparations all over the world. United States Food and Drugs Administration (US FDA), European Medicines Evaluation Agency (EMEA), Health Canada, Medicines and Healthcare Products Regulatory Agency (MHRA) and Ministry of Health, Labour and Welfare (MHLW-Japan) are among the leading regulatory bodies which have pioneered the way medicinal preparations are made available to respective regional populations. In addition to these regional agencies, international bodies such as World Health Organization (WHO), International Conference on Harmonization (ICH), play a vital role in different aspects of pharmaceutical regulations related to drug product research and development, registration, manufacturing, and distribution.
The pharmaceutical industry has become highly regulated as a result of the collective efforts of these regulatory authorities. From time to time, different regulations have been enforced with the intent of having a positive impact on the quality of medications but certain numbers of associated disadvantages were also noticed over the years, e.g., as a part of regulatory framework, manufacturers are required to validate manufacturing process on 3 consecutive batches and follow the same process during routine manufacturing to ensure consistent quality of pharmaceuticals. Any change in the manufacturing process after the process validation would call for the regulatory submissions and review depending on the extent of change [1]. This being a time consuming and resource intensive process, historically pharmaceutical manufactures had been reluctant to introduce new changes or improvements in the manufacturing process following the first regulatory approval. However, this hesitancy to introduce improvements/innovations in pharmaceutical manufacturing is undesirable for the purpose of availing safe and efficacious medications. Consequently, in order to promote voluntary innovation in product and process development, process analysis and process control; the FDA has recently undertaken different initiatives such as quality by design, process analytical technologies [2] and at the same time introduced real-time release concept
2
[3] to reward manufacturers for their efforts for implementing innovation in the product development and manufacturing.
The mutually beneficial nature of these regulatory initiatives has changed the mindset of pharmaceutical manufacturers which has triggered a paradigm shift in pharmaceutical research and development as well as manufacturing. One aspect manufacturing process improvement is implementing process analytical technologies (PAT) for better understanding, monitoring, and control of different stages of pharmaceutical manufacturing. Development of a PAT application for a particular manufacturing process requires through preparatory work comprising but not limited to activities such as assessing feasibility of suitable PAT tool depending upon physical nature of materials during manufacturing process, sample presentation to data collection tool, development and validation of chemometric models, analyzing results for understanding the process dynamics, etc. The context of present work lies in such preparatory work, which is aimed at developing PAT application for in-line concentration monitoring inside a tableting feed frame.
1.1.1 Pharmaceutical manufacturing regulations
Historically, the quality of pharmaceutical drug products was overseen by most of the drug regulatory authorities, including United States Food and Drug Administration (US FDA), using a two-way strategy [4]. That is: (a) assessment of the information submitted by pharmaceutical manufacturers in the drug approval application and (b) inspecting the manufacturing facility for conformance with the current good manufacturing practices (CGMPs).
Conventional pharmaceutical manufacturing is generally accomplished using batch processing with laboratory testing conducted on collected samples to evaluate quality. This conventional approach has been successful in providing quality pharmaceuticals to the public. However, significant opportunities now exist for improving pharmaceutical development, manufacturing, and quality assurance through innovation in product and process development, process analysis and control. Unfortunately, the pharmaceutical industry has generally been hesitant to introduce innovative systems into the manufacturing sector for a number of reasons. One reason often cited is regulatory uncertainty, which may result from the perception that the existing regulatory system is rigid and unfavorable to the introduction of innovative systems [2]. The industry’s hesitancy to broadly embracing innovation in
3 pharmaceutical manufacturing is undesirable from a public health perspective. However, to exploit scientific innovations and technological advances in last few years, FDA reinforced drug approval and quality assessment process in August 2002 by launching a new initiative entitled “Pharmaceutical CGMPs for the 21st Century: science-based policies and standards in the drug regulatory approach [5].
Around the same time, the International Council on Harmonization (ICH) of technical requirements for registration of pharmaceuticals for human use published series of guidelines detailing the change in the regulatory expectations for new product registration applications. ICH Q8 (R2) suggested the contents of pharmaceutical development section [3] of the product registration dossier, which is intended to provide information and understanding gained on product and its manufacturing process to the regulatory agencies. A more scientific approach to drug product development over the earlier empirical development was expected on the part of pharmaceutical manufacturers. Further emphasis on product and process understanding in terms of critical quality attributes (CQAs) and critical process parameters (CPPs) was introduced in 2007 as a part of quality by design (QbD) philosophy. A systematic approach to mitigate quality risks were outlined in quality risk management ICH Q9 [6] while effective quality management to enhance the quality and availability of medicines around the world in the interest of public health was outlined in ICH Q10 [7]. These regulatory changes throughout the product lifecycle were expected to facilitate innovation and continual improvement and strengthen the link between pharmaceutical development and manufacturing activities.
In line with QbD philosophy US FDA issued Guidance for Industry; PAT -A framework for innovative pharmaceutical development, manufacturing, and quality assurance in September 2004. In this guidance [2], process analytical technology (PAT) was put forth as a new regulatory framework to encourage the voluntary development and implementation of innovative pharmaceutical development, manufacturing and quality assurance. In November 2011, FDA announced the complete implementation of QbD starting from January 2013, expecting all companies to file new registration applications using QbD principles.
In view of increased requirements in the drug regulatory submissions, pharmaceutical manufacturing is undergoing a phenomenal change. The present work constitutes to one aspect of this change i.e. the development and implementation of PAT.
4
1.1.2 Process analytical technology (PAT) initiative
Pharmaceutical manufacturers are expected to demonstrate an enhanced knowledge of product performance over a range of material attributes, manufacturing process options and process parameters in the quality by design paradigm. Product and process understanding can be gained by application of, e.g., formal experimental designs, PAT, and/or prior knowledge. PAT is a system for designing, analyzing, and controlling manufacturing through timely measurements (i.e., during processing) of critical quality and performance attributes of raw and in-process materials as well as processes with the goal of ensuring final product quality [2].
In the expression ‘Process Analytical Technology’, the term ‘analytical’ is taken in the broad sense. It includes all chemical, physical and microbiological techniques as well as mathematics and risk analyses. The ideal analytical tools are those that allow for non-destructive and non-invasive real-time measurement. The FDA suggests four types of PAT tools (PAT toolbox) to measure, understand, track, and control a process. These tools are:
Analyzers quantifying critical process parameters, i.e. spectrometers measuring the spectroscopic response of a powder blend over time to assess mixture composition change over time, e.g., time and revolutions of the blender are critical process parameters while blend concentration is a critical quality attribute for in-process powder blend.
Statistics used in the design of experiments, i.e. factorial plans and all other techniques for evaluating as well as understanding the influence of critical parameters and their interactions with the process
Process control, i.e. multivariate analysis and control strategies to control the process based on in-line measurements of the process parameters and product characteristics Knowledge management and continuous improvement, i.e. mathematical models and
protocols being updated as more information is gathered during the regular manufacturing of the product.
A PAT application is defined as a combination of two or more of these tools to ensure proper monitoring and process control [2]. Such PATs can be implemented during the manufacturing operations of different dosage forms such as tablets, capsules, liquids, injectable, semisolids like creams, ointments, etc.
5
1.1.3 Pfizer research chair in PAT
Practical implementation of PAT tools during regular manufacturing operations requires a thorough study of all process parameters and validation of calibration models. Despite a certain number of successful PAT implementations, there is still a need for much information to be gained and exchanged between regulatory agencies as well as pharmaceutical manufacturers in the implementation of PAT assisted quality by design approach. An important reason for this is the lack of knowledge as well as practical experience in risk-based process design because industries had been using trial and error principles in the past. In this context, there is a need for collective efforts from all parties like industry, academia as well as drug regulatory bodies. As a result of such a process, Université de Sherbrooke and Pfizer have combined their efforts by creating a research chair on PAT in Pharmaceutical Engineering. This Chair has defined the following strategic objectives [8]:
Develop knowledge on- Physicochemical phenomena governing the behavior of processes involved in the industrial pharmaceutical production (where PAT may be applied) and Criteria of “phenomenological or stochastic model-based technology transfer” (i.e. scale-up and implementation of new technologies on which PAT may be applied)
Improve the control of processes and products based on PAT
Consolidate the research component in the field of processes in the Department of Chemical and Biotechnological Engineering of Université de Sherbrooke and develop a critical mass of research on PAT in Pharmaceutical Engineering.
One of the ongoing projects under this research chair is to understand the powder behavior inside the feed frame using different PAT tools. Earlier work [9] used PAT tools like NIRS, RGB camera and LIF for concentration monitoring of the multivitamin product. Present work aims to broaden the earlier knowledge gained on using NIRS as process analyzer for feed frame as well as to evaluate the feasibility of new tool (Near-infrared chemical imaging- NIR CI) for the purpose of monitoring powder behavior inside the feed frame.
6
1.1.4 PAT in tablet manufacturing process
The tablet is one of the most common pharmaceutical dosage forms, preferred by manufacturers as well as patients. Over the years, the tablet manufacturing process has been evolved into a well-defined sequence of manufacturing operations. Tablet manufacturing is generally categorized in two ways- one based on wet granulation and another on dry granulation or direct compression. Depending upon the mode of granulation chosen, typical processes during manufacturing are weighing and dispensing, milling, sifting, mixing, granulation, drying, sizing, mixing or lubrication, compression followed by coating (film coating or sugar coating). To ensure a safety and effectiveness to the patients, a tablet formulation must deliver a constant amount of active in each dosage unit. Consequently, the powder composition of tablet formulation must be uniform in active content. However, during these dynamic operations, powder undergoes high levels of stress and strain, which can cause variable content uniformity of the active ingredients during any or all of the tableting processes.
In order to assure the quality of the blend during the tablet compression, conventionally the blend uniformity is examined at the end of final blending just before the tablet compression; additionally, the tablets are also analyzed for assay and content uniformity [10] at the end of the manufacturing process. These analyses only test the quality of the powder blend and end product. They barely help avoid adverse quality phenomena like segregation, since they don’t significantly add to the product and process understanding. Furthermore, it is hard to trace quality issues back to their source if encountered at the end of such testing. In order to build a quality into the product instead of testing it, CQAs needs to be monitored during all the manufacturing operations and it can be done via the application of suitable PATs during different manufacturing operations.
Literature shows the implementation of off-line [11][12][13] as well as in-line [14][15][16] PAT for different stages of the tablet manufacturing operations for process monitoring and quality assessment. In the initial work, mostly off-line PAT developments have been reported however the advances in spectroscopic technology and availability of more adaptable process analyzers have led to the development of in-line PAT tools for continuous process monitoring. Most of the earlier work concentrated on generally regarded critical process operations of tablet manufacturing such as blending, granulation, and final product
7 testing for content uniformity. However, with the further understanding of the tablet manufacturing process and PAT implementation, other complex processes such as compression, coating have been evaluated by PAT implementation. In-line concentration monitoring of powder circulating inside the tablet feed frame has also been reported recently.
1.1.5 Role of feed frame in tablet compression
During the tablet manufacturing process, among all of the unit operations, consistent filling of the tablet press die with a uniform weight of powder is often both critical to quality and rate-limiting for the entire process. Uniform die filling in terms of powder weight and contents is, therefore, a crucial control variable. The amount of powder entering the die prior to compression determines the weight and overall drug content of individual tablets. Moreover, the effect of inconsistent die filling on quality is felt in less obvious ways i.e. content non-uniformity is perceived only after assaying the compressed tablets. Tablet presses use cam tracks for movement of upper and lower punches to control operations such as die fill, weight adjustment, pre-compression, compression as well as ejection of tablets. At the given settings of cam track parameters, the force at which an individual tablet is compressed depends on the amount of powder in the die [17] [18]. As a result, several final properties of the tablets including its density, porosity and the amount of elastic stress stored in the compact are affected by the amount of powder in the die.
In order to produce tablets with a uniform weight and content, there are two main requisites for a pharmaceutical powder blends. First - good flow (i.e. no bridging or rat holing in the hopper) and second - uniform content (i.e. no segregation of the active ingredient inside the hopper and feed frame). Granulation of powder blends helps to achieve good flow as well as content uniformity, however for high speed, high throughput manufacturing; this flow is not sufficient. Manufacturers often use mechanical assistance in the form of paddle feeders to maintain an adequate supply of powder to fill the dies at high speed and multiple compression stations machines
8
Figure 1.1 : Schematic presentation of a feed frame with 2 paddle wheel
The force feeder (referred to as feed frame henceforth) help to alleviate issues of tablet weight uniformity, however, paddles at a higher rotation speed (as shown in figure 1.1) might shear the material to a higher extent. Powder circulation at high speeds can lead to excessive lubrication and issues with a hardness of tablets. At the same time, a circulatory motion may lead to powder segregation [17][19] as the powder inside feed frame is a composite of materials having different density, particle size, shape and varied physicochemical properties.
1.2 NIR chemical imaging (NIR CI)
NIR CI is a comparatively newer technique for pharmaceutical PAT applications where sample under test is in continuous motion. NIR CI applications for process monitoring has been limited due to practical difficulties associated with accommodating the NIR chemical imaging unit on manufacturing equipment, controlling uniform and reproducible sample presentation as well as coping with time required for imaging while the sample is still moving. Conventionally NIR CI represents a distribution map of chemical/analyte obtained from NIR hyperspectral imaging, however with recent advances in technology similar sample information can be obtained with newer and faster adaptions of this methodology. Following section briefly reviews NIR CI technology and its pharmaceutical applications.
1.2.1 NIR CI acquisition
The instrumentation for acquiring hyperspectral NIR CI involves the coupling of a lens/microscope with a NIR spectrometer. There are two main types of NIR-CI systems [20] [21] :
9 a) Area scan imaging or staring imager system
b) Line mapping or push-broom system
Area scan imaging is considered as a real NIR CI technique when compared to line mapping system. Though the 2 techniques have different ways of data acquisition still the output result for both of these techniques is a hyperspectral data cube and the same chemical image will be obtained for a sample using the same instrument settings and data processing method.
a) Area scan imaging
The area scan imaging system does not contain any moving parts and generates images at each selected wavelength rather than collecting NIR spectra directly from the line of pixels. Area scan imaging measures the NIR absorption intensity values in each pixel of the defined sample area at one particular wavelength at a time. The imaging technique uses two-dimensional focal plane arrays (FPA), i.e. cameras having thousands of individual detector elements (pixels). The number of pixels in an image is thus fixed for area scan imaging systems and the pixel size is defined by the magnification optics (e.g. 9.8 mm/pixel magnification setting would cover 40 X 20 mm sample area using 320X256 pixels). The spectral information is obtained by changing the wavelength of light using tunable filters, e.g. liquid crystal or acoustic optical tunable filters. The NIR absorption intensity is measured in every pixel for each individual wavelength, and wavelength is sequentially changed by the tunable filter. Images at each individual wavelength are built up like a deck of cards to generate the hyperspectral data cube [20].
b) Line Mapping
The line mapping principle is based on a step-and-acquire acquisition mode. The sample area and pixel size are initially decided which fixes a number of pixels in the image. For each acquisition, diffuse reflectance spectra are collected from a line of pixels. With a very accurate positioning of a sample stage, the sample is moved and another line of spectra are obtained. In this way, a grid of spectral information is build up from all lines of spectra until spectra from all sample area are obtained to constitute the hyperspectral data cube.
In the present work, images acquired with definite bandpass wavelength filters on the NIR camera are referred as ‘area scan’ images while those acquired using spectrograph on NIR camera are referred as ‘line scan’ images.
10
1.2.2 NIR CI set up
During NIR CI acquisition, the sample surface is illuminated using a NIR light source and diffusely reflected light is captured using imaging optics on a focal plane array detector (Figure 1.2). Between the sample and imaging sensor, a suitable imaging optics and wavelength filter is used which helps to record images at different wavelength ranges.
Figure 1.2 : Schematic reflection of NIR CI [22]
NIR CI gives spectral information of the sample similar to a near-infrared spectroscopy and spatial information of the sample similar to digital imaging since for a given sample NIR CI records spectral and spatial information simultaneously and provides a NIR spectrum for each pixel of the sample image. The result is a three-dimensional data set called as a hyperspectral data cube. The x, y-axis of the hyperspectral cube represents spatial information and z-axis represents wavelength. Hyperspectral data cube gives typical chemical images which provide information on the distribution of different chemical components in the sample surface. The major advantage of NIR CI over the conventional NIR spectroscopy is that it not only helps to identify and quantify surface components but it helps to know their spatial distribution from within the sample. This can be related to the quality of the product [20].
11
Figure 1.3 : Schematic representation of hyperspectral NIR CI [20]
As shown in figure 1.3, a hyperspectral data cube can either be seen as a set of array of spectra arising from every single pixel of an image or it can be seen as a set of images from which a spectrum can be generated for each pixel. Selecting a single pixel from (XY-coordinate) through the z-plane will give the spectrum recorded at this particular spatial location. This spectrum provides the spectral signature of chemical components present in that exact part of the sample. Whereas selecting one of the images from hypercube at a specific wavelength (z-value) will show the intensity values for all pixels at that wavelength. This is called a single wavelength image. The single wavelength image can be used for finding the spatial distribution of components which absorb at that particular wavelength. The hyperspectral data cube is often visualized as an image using either a grey scale or color scale to represent intensity, for example, the average absorbance intensity value for each pixel (spectrum).
12
In the present work, NIR CI refers to NIR images taken over a particular wavelength band using the spectral filter on the NIR camera (area scan images) or NIR images taken over 900-1700 nm range using spectrograph on the NIR camera (line scan images). NIR images taken this way do not give hyperspectral images however they offer the advantage of faster scan which is really helpful for in-line applications in testing moving material samples.
1.2.3 Spectral transformation of NIR images
There are 3 steps in the NIR CI processing:a) Spectral correction
Instrument response is removed by measuring the intensity of light (𝐼𝑎) diffusively reflected from of a high-reflectance standard that reflects almost 100 % light at each wavelength and instrument response (𝐼𝑏) when there is no NIR light to illuminate the sample. The intensity of light reflected from the sample is then measured (𝐼𝑠). The final NIR diffuse reflectance raw data (𝑅) is calculated as the ratio between the sample and the background measurements, while instrument response in the absence of NIR light is subtracted from both of them.
𝑅 = (𝐼𝑎−𝐼𝑏)(𝐼𝑠−𝐼𝑏) (1.1)
b) Conversion to absorbance
The diffuse reflectance data (𝑅) is organized in a three-dimensional structure (i.e. hyperspectral cube). This type of correction is also applied for NIRS data. Prior to data analysis, all raw reflectance data (𝑅) are transformed into absorbance (𝐴) by the relation 𝐴 = -log10 𝑅 = log10 (1/ 𝑅). Assuming the path length (𝜄) on average is constant for the NIR diffuse reflectance mapping measurements of the sample, a linear relationship then exists between absorbance (𝐴) and analyte concentration (𝑐) by Beer-Lambert’s law:
𝐴 = 𝐿𝑜𝑔10(𝑅1 ) = 𝜀 × 𝜄 × 𝑐 (1.2) 𝜄 Represents the path length of the sample (cm) and
𝜀 is the molar absorptivity (L mol-1 cm-1) specific to each analyte at a specific wavenumber. c) Unfolding of 3D hyperspectral cube
The three-dimensional hyperspectral data cube achieved from the NIR CI needs to be unfolded for the purpose of data analysis.
13
Figure 1.4: Schematic representation of unfolding hyperspectral image [20]
The hyperspectral image data is unfolded from 3D data cube to a 2D matrix (as shown in figure 1.4), in which each row is a spectrum from one of the pixels. After data processing has been done the resulting 2D matrix suitable multivariate analysis method (PCA, PLS or PCR) is selected for further analysis.
1.3 NIR spectroscopy
NIRS is one of the most frequently used techniques for sample data collection in pharmaceutical PAT applications. The suitability of a NIRS procedure is dependent upon many factors, including the instrumentation, applied chemometrics as well as the sound understanding of the physicochemical basis of the measurements [23]. The following sections contain a brief review of NIR spectroscopy basics, its use in monitoring various pharmaceutical processes as well as recent applications in the feed frame monitoring.
1.3.1 NIRS brief theoretical background
NIRS is generally chosen as the method of sample analysis because of its speed and non-destructive characteristic towards the analyzed sample. Over time, instrument improvements and the development of fiber optics have made it possible to delocalize measurements [24].
The frequency range of the NIR from 800-2500 nm mainly covers overtones and combinations of the lower-energy fundamental molecular vibrations that include at least one X–H bond vibration. Overtones (electron excitations to higher energy levels) are similar to octaves in a musical scale, like harmonics of the fundamental vibrational frequencies. Combination bands are the sum of two different vibrations corresponding to different chemical
14
bonds.[25] These bonds are significantly weaker in absorption compared with the fundamental vibrational bands from which they originate.
The functional groups showing NIR absorbance are mostly those involving the hydrogen atom: C–H, N–H, and O–H (Figure 1.5). Thus, NIRS represents in effect the chemical spectroscopy of the hydrogen atom in its various molecular manifestations [26]. NIR light is absorbed to different extents by the sample at frequencies similar to vibrational frequencies of the NIR active chemical bonds present in the sample.
Figure 1.5: Different functional groups and their NIR absorbance range [27]
In terms of the analytical specificity, NIRS is sensitive to the frequency and intensity of these X–H NIR absorption bands and their near neighbors in the molecular structure. The local electronic environment has a particularly strong influence on the X–H bond force constants which helps to derive remarkably high information content in NIR spectra. Furthermore, some particular functional groups (e.g. O–H, N–H) are very strongly affected by both intermolecular and intramolecular H-bonding effects, with sometimes dramatically influences the intensity and band-shapes in the NIR.
In the present research work, Ibuprofen and Ascorbic acid have been used as representative pharmaceutical actives. Both these molecules show NIR absorbance owing to their chemical structure. As shown in the figure 1.6, these molecules have NIR responsive
15 chemical bonds in different configurations such as C–H, O–H, CH=CH, CH–CH3, etc. (Ibuprofen) and C–H, O–H, CH=CH, etc. (Ascorbic acid). In addition, constituent excipients such as Mannitol also show NIR absorbance due to chemical bonds such as C–H, O–H.
Figure 1.6: Chemical structure of Ibuprofen and Ascorbic acid [28][29]
The absorptivity of vibrational overtone and combination bands is much weaker in NIRS spectra of the condensed phase (i.e. sample in the solid or liquid state) hence physically thick samples can be measured without sample dilution or the need to resort to difficult short-path length sampling techniques. As a result, conventional sample preparation is redundant which favors the NIR PAT applications requiring direct measurement of the sample either in situ or after removal of the sample from the process [25] [26].
1.3.2 NIRS data collection and pre-treatments
NIR spectral data in PAT applications is recorded in one of the 2 modes, i.e. transmission (absorbance spectra) or reflectance mode (diffuse reflectance spectra). Although transmission mode allows probing the bulk sample in contrast to dominantly surface signal in the reflectance mode but the useful spectral range is mostly limited and spectra may contain more noise than reflectance spectra [30]. For chemometric model development, either full range of spectral analyzer or selective wavelength range region around the active ingredient peak can be used. Unnecessary too high or too low wavelength ranges may compromise model performance thus wavelength selection must be tested with respect to the performance of the model [15]. Recent study [31] reports selection of spectral wavelength representing specific bond frequency characteristic of the active molecule. It was further showed that selection of proper pre-treatments is necessary for data treatment on case by case basis.
16
NIR spectral baselines are mostly affected by different particle sizes, density differences, sample movement (wave behavior) in non-contact type measurements, NIR source intensity variations, etc. Most of the artifacts in the spectral data can be removed by use of suitable spectral pre-treatments [32]. Standard normal variate (SNV), Savitzky-Golay smoothing, derivatives, detrending, multiple scatter correction (MSC), centering and scaling to unit variance are some of the frequently used spectral pre-treatments (Appendix III) for NIRS data [33] obtained in pharmaceutical PAT applications. SNV helps to remove baseline differences due to changes in NIR path-length. Mathematically it is row-wise centering and scaling of NIR spectra. Derivatives (mostly first and second derivative) are used to remove peak overlap as well as to remove constant and linear baseline drifts between different spectra. Savitzky-Golay smoothing is generally used after derivatives to smoothen the spectral appearance. De-trending removes a linear or polynomial fit from the spectra to remove tilted baseline variations. MSC removes baseline offsets and multiplicative scatter effects by means of regressing sample spectra against reference spectra and then correcting the sample spectra using slope and intercept of this linear fit.
Following the spectral pre-treatments, NIR spectra are further analyzed using univariate or multivariate chemometric methods.
1.4 Definition of a current research project
As described in section 1.1.5, the feed frame plays an important role in the tablet manufacturing process since it helps in tablet weight and content uniformity as well as it is the last piece of equipment allowing access to flowing powder before compressing the tablets. At this point the tablet mass and content (potency) become fixed; thus, it is important to maintain consistent powder fill weights into the tablet dies as well as avoid any segregation of the powder blend in the process [4]. To date, a lot of attention has been paid to mixing inside the blenders [14][34][35][36][37][38][39], granulation [40][41][42][43], drying and milling process [44][45][46][47][48] during tablet manufacturing but limited studies have been directed to understand and control the powder blend behavior inside the feed frame.
Some researchers have studied [18][19][49][50][51] the impact of various feed frame parameters on the powders and subsequently compressed tablets mainly using computer-aided simulations or experimental designs, however, in-line feed frame monitoring was not
17 achieved. Very recently, NIRS-based PAT tools for concentration monitoring inside the feed frame have been reported. Although concentration monitoring inside the feed frame was successful, poor correlation between the NIR spectral intensity and actual tablet concentrations was seen due to the location of NIR probe, powder mass buildup inside feed frame, varying powder to probe distance [15] and speed of paddle wheels [16]. NIRS-based PATs for monitoring the powder circulation inside the tablet feed frame has been successful only in the specific experimental configurations (e.g. specific powder to probe distance, probe location, paddle speed, etc.). Furthermore, the NIR probe monitors a powder blend over a small area (e.g. 2×2 mm2), which may or may not appropriately represent the overall bulk powder concentration, potentially limiting the detection of segregation if present. Owing to aforesaid limitations in the available knowledge base on NIRS PAT methods for feed frame monitoring, current research project addresses the need for further studies on NIRS using contact type NIR probe with larger probe head (15×4 mm2) specifically meant for feed frame monitoring methods. In addition to this, attempts have been made to find another robust tool for feed frame powder monitoring as well as detecting the presence of adverse quality phenomenon such as segregation. Consequently, the present work aims to evaluate the performances of NIR CI compared to NIRS, while consolidating knowledge on NIRS-based feed frame monitoring.
Use of NIR CI is proposed as it can prove useful for in-line feed frame monitoring due to recent developments in high-speed image acquisition capabilities while limiting the shortcomings (e.g. smaller tested sample area, baseline variations) of NIRS PAT methods. NIR camera with definite wavelength bandpass filter gives a ‘area scan’ image of the sample (Figure 1.7 A) where each pixel in the image represents the local composition at the specific location of the sample, e.g., a 256×320 pixel image gives sample information in the form of 81920 data points. NIR camera equipped with spectrograph acquires a ‘line scan’ image of a sample (Figure 1.7 B), where the 256 vertical pixels represent spectral information while the 320 horizontal pixels represent spatial information of the powder sample.