an author's
https://oatao.univ-toulouse.fr/25962
https://doi.org/10.1038/S41561-020-0534-0
Banfield, Don and Spiga, Aymeric and Newman, Claire... [et al.] The atmosphere of Mars as observed by InSight.
(2020) Nature Geoscience, 13 (3). 190-198. ISSN 1752-0894
1Cornell University, Cornell Center for Astrophysics and Planetary Science, Ithaca, NY, USA. 2Laboratoire de Météorologie Dynamique/Institut Pierre Simon
Laplace (LMD/IPSL), Sorbonne Université, Centre National de la Recherche Scientifique (CNRS), École Polytechnique, École Normale Supérieure (ENS), Paris, France. 3Institut Universitaire de France, Paris, France. 4Aeolis Research, Chandler, AZ, USA. 5Space Science Institute, Boulder, CO, USA. 6Johns
Hopkins Applied Physics Laboratory, Laurel, MD, USA. 7Institut Supérieur de l’Aéronautique et de l’Espace (ISAE-SUPAERO), Toulouse, France. 8Centro de
Astrobiología (INTA-CSIC), Madrid, Spain. 9Université de Paris, Institut de Physique du Globe de Paris, CNRS, Paris, France. 10Royal Observatory of Belgium,
Directorate ‘Reference Systems and Planetology’, Brussels, Belgium. 11School of Earth Sciences, University of Bristol, Bristol, UK. 12Jet Propulsion Laboratory,
California Institute of Technology, Pasadena, CA, USA. 13German Aerospace Center (DLR), Institute of Planetary Research, Berlin, Germany. 14Department
of Electrical and Electronic Engineering, Imperial College London, London, UK. 15Department of Earth, Ocean and Atmospheric Sciences, University of
British Columbia, Vancouver, British Columbia, Canada. 16Planetary Science Institute, Tucson, AZ, USA. 17Laboratoire Atmosphère Milieux Observations
Spatiales/Institut Pierre-Simon Laplace (LATMOS/IPSL), Sorbonne Université, Université Paris-Saclay, Université de Versailles Saint-Quentin-en-Yvelines, Centre National de la Recherche Scientifique, Guyancourt, France. 18School of Physical Sciences, The Open University, Milton Keynes, UK. 19Swiss Seismological Service (SED), ETH Zurich, Zurich, Switzerland. 20Institute of Geophysics, ETH Zurich, Zurich, Switzerland. 21Department of Physics,
University of Oxford, Oxford, UK. 22Department of Earth, Environmental, and Planetary Sciences, Brown University, Providence, RI, USA. 23Université
Côte d’Azur, Observatoire de la Côte d’Azur, CNRS, IRD, Géoazur, Valbonne, France. 24Black Forest Observatory, Stuttgart University, Wolfach, Germany. 25Laboratoire de Planétologie et Géodynamique, UMR6112, Université Nantes, Université Angers, CNRS, Nantes, France. 26Morton K. Blaustein Department
of Earth and Planetary Sciences, Johns Hopkins University, Baltimore, MD, USA. 27Center for Earth and Planetary Studies, National Air and Space Museum,
Smithsonian Institution, Washington DC, USA. 28Department of Earth, Planetary, and Space Sciences, University of California, Los Angeles, CA, USA. 29These authors contributed equally to this work: Don Banfield, Aymeric Spiga. ✉e-mail: [email protected]; [email protected]
T
he atmosphere of Mars has an average pressure that is 0.6% of
Earth’s. It lacks moist convection, but responds strongly to
air-borne dust heating. Mars’s unique atmospheric regime offers
the opportunity to study meteorological phenomena from planetary
scales (thermal tides, baroclinic instability and dust storms) to
regional scales (slope winds and gravity waves) and local scales
(turbulence), all of which are expected to be stronger than those
on Earth
1. Mars also has unearthly characteristics, such as the main
The atmosphere of Mars as observed by InSight
Don Banfield
1,29✉, Aymeric Spiga
2,3,29✉, Claire Newman
4, François Forget
2, Mark Lemmon
5,
Ralph Lorenz
6, Naomi Murdoch
7, Daniel Viudez-Moreiras
8, Jorge Pla-Garcia
5,8, Raphaël F. Garcia
7,
Philippe Lognonné
3,9, Özgür Karatekin
10, Clément Perrin
9, Léo Martire
7, Nicholas Teanby
11,
Bart Van Hove
10, Justin N. Maki
12, Balthasar Kenda
9, Nils T. Mueller
13, Sébastien Rodriguez
3,9,
Taichi Kawamura
9, John B. McClean
14, Alexander E. Stott
14, Constantinos Charalambous
14,
Ehouarn Millour
2, Catherine L. Johnson
15,16, Anna Mittelholz
15, Anni Määttänen
17,
Stephen R. Lewis
18, John Clinton
19, Simon C. Stähler
20, Savas Ceylan
20, Domenico Giardini
20,
Tristram Warren
21, William T. Pike
14, Ingrid Daubar
22, Matthew Golombek
12, Lucie Rolland
23,
Rudolf Widmer-Schnidrig
24, David Mimoun
7, Éric Beucler
25, Alice Jacob
9, Antoine Lucas
9,
Mariah Baker
26,27, Véronique Ansan
25, Kenneth Hurst
12, Luis Mora-Sotomayor
8, Sara Navarro
8,
Josefina Torres
8, Alain Lepinette
8, Antonio Molina
8, Mercedes Marin-Jimenez
8, Javier Gomez-Elvira
8,
Veronica Peinado
8, Jose-Antonio Rodriguez-Manfredi
8, Brian T. Carcich
1, Stephen Sackett
1,
Christopher T. Russell
28, Tilman Spohn
13, Suzanne E. Smrekar
12and W. Bruce Banerdt
12The atmosphere of Mars is thin, although rich in dust aerosols, and covers a dry surface. As such, Mars provides an opportunity to
expand our knowledge of atmospheres beyond that attainable from the atmosphere of the Earth. The InSight (Interior Exploration
using Seismic Investigations, Geodesy and Heat Transport) lander is measuring Mars’s atmosphere with unprecedented
continu-ity, accuracy and sampling frequency. Here we show that InSight unveils new atmospheric phenomena at Mars, especially in the
higher-frequency range, and extends our understanding of Mars’s meteorology at all scales. InSight is uniquely sensitive to
large-scale and regional weather and obtained detailed in situ coverage of a regional dust storm on Mars. Images have enabled
high-altitude wind speeds to be measured and revealed airglow—faint emissions produced by photochemical reactions—in the middle
atmosphere. InSight observations show a paradox of aeolian science on Mars: despite having the largest recorded Martian vortex
activity and dust-devil tracks close to the lander, no visible dust devils have been seen. Meteorological measurements have
pro-duced a catalogue of atmospheric gravity waves, which included bores (soliton-like waves). From these measurements, we have
discovered Martian infrasound and unexpected similarities between atmospheric turbulence on Earth and Mars. We suggest that
the observations of Mars’s atmosphere by InSight will be key for prediction capabilities and future exploration.
atmospheric component, carbon dioxide (CO
2), condensing on the
Martian polar regions
2and in the middle atmosphere
3.
Outstanding questions about Mars’s atmosphere remain open.
What is the subtle balance of phenomena that accounts for the
atmospheric variability at a given location on Mars? How is dust
lifted from the surface? How can we use Mars as a laboratory to
explore key meteorological phenomena on Earth? To address
those questions, in situ temporal coverage at Mars’s surface is
cru-cial to provide ground truth for Martian atmospheric models and
to supplement orbital observations, which at a given location on
Mars provide infrequent coverage and sense mostly in the
middle-to-upper atmosphere. Previous lander missions conducted
atmo-spheric measurements at the surface of Mars
4,5, yet no continuous
measurements by a high-sensitivity meteorological station able to
monitor atmospheric processes across a range of scales, from
large-scale weather to small-large-scale turbulence, have been performed.
After successful entry, descent and landing (EDL; reconstructed
temperature profile in Fig.
1a
), the InSight mission landed at
4.5° N 135.6° E in Elysium Planitia on Mars in the northern
win-ter (Extended Data Figs. 1 and 2). The first 200 Martian solar days
(sol, 1 sol = 88,775 s) of atmospheric measurements demonstrate
how InSight can both unveil atmospheric phenomena not
mea-sured at the surface of Mars and explore known phenomena with
a fresh perspective. The InSight lander is the first continuously
operating weather station at the surface of Mars (Figs.
1b
and
2
)
and the first to feature a high-frequency high-precision pressure
sensor
6,7(Methods). Moreover, InSight’s wind measurement
capa-bilities, with two operating medium-frequency wind sensors, are
only matched by those of the Viking landers; quantitative wind
measurements on board all the other previous missions
4were either
lacking
8, at a low sampling frequency
9or made difficult by damage
during landing on Mars
10. New perspectives for atmospheric science
are also opened by using the wind- and pressure-induced ‘noise’ in
the signal acquired by the InSight SEIS (Seismic Experiment for
Interior Structure) seismometers
7,11,12.
Large-scale atmospheric phenomena
Mars has daily weather variations, as evidenced from landers
9,13and orbiters
14, that result from mid-latitude planetary waves caused
by baroclinic instability related to seasonal equator-to-pole
tem-perature gradients. Contrary to that of Earth, the behaviour of the
Martian atmosphere in the mid-latitudes is simply governed by
alternating dominant baroclinic modes, for reasons still unclear
15.
Surprisingly, InSight’s high-sensitivity tropical pressure
measure-ments are a valuable reference to study baroclinic instability in the
mid-latitudes. When seasonal and diurnal trends are removed from
InSight’s pressure and wind measurements (Fig.
3
), a clear wave
pat-tern of a 2.5 sol period is detected in the first 40 sols of the mission,
which corresponds to the peak amplitude of northern winter’s
mid-latitude transient waves
16, which later changes to a 5–6 sol period
at the end of northern winter and a 4 sol period in northern spring
(Extended Data Fig. 3). Baroclinic waves at equatorial latitudes were
previously detected using Curiosity data
17, but in comparison the
InSight measurements, with improved sensitivity and continuity,
are remarkably clear and regular.
In Mars’s thin, sunlight-controlled atmosphere, weather is
impacted by airborne dust. InSight is the first wind-measuring
weather station since the Viking landers 40 years ago
18to
experi-ence the impact of a regional-scale dust storm. The storm started on
the other side of Mars
19before spreading dust around the planet and
doubling the atmospheric dust optical depth at InSight between sols
40 and 50 (Fig.
1c
). Consequently, and as expected from theory
1,
the diurnally repeating pressure variation increased as both the
diurnal and semidiurnal tidal components amplified. In addition,
the diurnal cycle of wind direction changed from a small angular
fluctuation to a complete anticlockwise rotation over a sol (Fig.
2d
).
During this regional dust storm, the synoptic variability in pressure
and wind (Fig.
3a,b
) was deeply impacted and transitioned from a
well-identified 2.5 sol mode to longer-period modes (7–10-sol
peri-ods; Fig.
3
and Extended Data Fig. 3b). This transition is thought
to act as a negative feedback for the development of dust storms on
Mars
20,21.
InSight’s ability to monitor meteorological phenomena at larger
horizontal scales than its immediate surroundings also includes the
vertical dimension for middle-atmosphere processes through
colour-imaging capabilities. InSight’s cameras, operating just after sunset,
observed noctilucent clouds
3,8at the transition between northern
winter and spring (Fig.
1d
). Given the position of the Sun, these
clouds must have been at least 50 km above the surface to be
illumi-nated. Past orbital detection of mesospheric clouds at this altitude
and season suggests either water–ice or CO
2–ice clouds
22,23. Cloud
motions indicate east-southeasterly wind speeds of 40–60 m s
–1assuming a 60 km altitude—an altitude at which wind speed has
sel-dom been evaluated on Mars
24,25. Furthermore, night-time imaging
showed that sky brightness persisted long after twilight, not
attrib-utable to moonlight. The relative contributions in the Instrument
Deployment Camera (IDC) colour filters are consistent with a 577.8
nm airglow of order 10 Rayleighs. This airglow, produced by
photo-chemical reactions in the upper atmosphere, was expected but not
previously confirmed on Mars
26.
Diurnal and subdiurnal variability
Mars, with its uniquely low average surface pressure, highlights an
end-member case of sunlight control of the diurnal cycle,
particu-larly as compared to Earth. This causes on Mars (relative to Earth):
(1) atmospheric thermal tides an order of magnitude stronger,
27,
especially in low-latitudes; (2) more sustained daytime upslope and
night-time downslope flows
28, especially over steep slopes
29and (3)
a much sharper contrast between the strong daytime,
buoyancy-driven convective turbulence and the moderate night-time,
shear-driven mechanical turbulence
30.
InSight’s atmospheric measurements allow this picture, drawn
from existing observations, to be refined. Consistent with previous
measurements
2,31and modelling
7,32, InSight has recorded a diurnally
repeating cycle of pressure (Fig.
2a
) that shows the major impact of
diurnal and semidiurnal thermal tides on the Martian atmosphere.
This makes thermal tides the best candidate to explain the large
diurnal deviation in wind direction, recorded by InSight’s wind
sensors (Fig.
2d
) and consistently inferred by SEIS seismometers
from wind-induced perturbations. Nevertheless, despite the fact
that InSight landed on a nearly flat plain, the diurnal cycle of wind
direction measured by InSight appears to be due primarily to flows
induced by the nearby gentle regional slope rather than by thermal
tides. Afternoon winds are upslope (from the northeast) and
night-time winds are downslope (from the southwest), except when the
prevailing large-scale winds from the northwest are strong enough
to dominate (Fig.
2d
). Although global climate modelling using
realistic topography reproduces these diurnal winds, artificially
flat-tening the local plains around InSight in the model causes them to
disappear (Extended Data Fig. 4).
Gravity waves, which have buoyancy as their restoring force,
are the dominant process that governs the variability in planetary
atmospheres at regional spatial scales and at timescales of several
hundreds of seconds
33; their propagation and breaking also impacts
large-scale wind and temperature in the upper atmosphere
34. Both
gravity-wave oscillations, with vertical wavelengths of a couple
kilometres
35, and dry adiabatic layers at mesospheric altitudes of
60–70 km, which denote gravity-wave breaking and subsequent
heat mixing, are detectable in the temperature profile acquired
during InSight’s entry, descent and landing (Fig.
1a
). On the
detec-tion of gravity waves, the continuous fine-sensitivity coverage by
InSight’s pressure sensor fills a gap left by previous studies—orbital
observations can only provide infrequent coverage at a given
loca-tion
36,37and in situ observations are limited to the specific setting
of Curiosity
5,38within the Gale Crater whose nearby rims are the
likely wave source
39. Located in the flat plains of Elysium Planitia,
the InSight pressure measurements exhibit numerous examples of
300–800 s gravity-wave pressure fluctuations from early evening
to late at night (Fig.
4a
), sometimes reaching 2 Pa peak-to-peak.
Furthermore, in rare instances in the middle of the night, InSight
captured yet undetected simultaneous and coherent gravity-wave
fluctuations of pressure and wind with long periods of ~1,500 s and
estimated horizontal wavelengths of ~25–35 km and phase speeds
of ~15–25 m s
–1(Methods and Extended Data Figs. 5 and 6). InSight
demonstrates convincingly that the gravity-wave activity (1)
system-atically peaks in the evening and early night, (2) appears absent in
daytime (3) is highly variable from one sol to another and (4)
under-goes significant seasonal variability; for instance, two successive
wave trains often detected each sol from sol 120 to 150 are followed
by almost no detected waves from sol 150 to 200. The intense
grav-ity-wave activity at the InSight landing site, far from any
topograph-ical obstacles, indicates that waves either originate from strong
winds that interact with sharp topographic features at particularly
large distances or that non-orographic sources (for example, jet
acceleration and convection) are involved.
In the decaying phase of the sol 40 regional dust storm, InSight
detected a signal reminiscent of terrestrial atmospheric bores and
solitary waves (Fig.
4b
), caused on Earth by the propagation of a cold
front that leads to, for example, ‘Morning Glory’ clouds
40. For Mars,
modelling studies proposed bores as an explanation for enigmatic
elongated clouds
41and the hydraulic-jump analogues of
low-lati-tude bores as instrumental for the migration of water-ice in Martian
polar regions
42. During the regional dust storm, InSight’s pressure
sensor detected a sharp increase of the pressure slope with time that
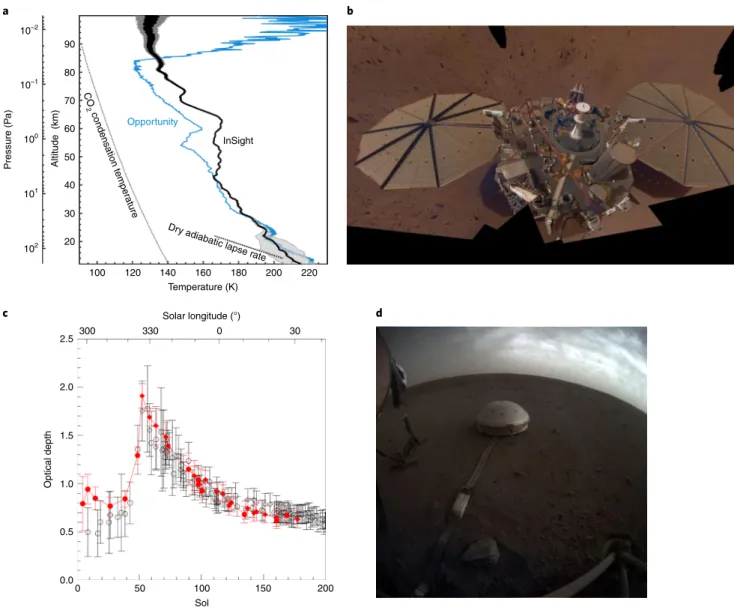
10–2 90 a b c d 80 70 60 Opportunity InSight CO 2 condensation temper atureDry adiabatic lapse r ate Altitude (km) 50 40 30 20 2.5 2.0 1.5 1.0 Optical depth 0.5 0.0 100 300 0 50 100 Sol 150 200 330 0 30 120 140 160 Temperature (K) Solar longitude (°) 180 200 220 10–1 100 Pressure (P a) 101 102
Fig. 1 | After successful EDL, InSight now provides continuous weather data for Mars. a, Reconstructed temperature profile (with 3σ error bars) from
InSight’s EDL; the profile obtained for Opportunity at a similar location and season64, the CO
2 condensation profile and a dry adiabatic lapse rate are
included for reference. b, Mosaic of InSight’s deck imaged on sols 106 and 133 (solar longitude (Ls) = 356° and 10°, respectively) that features the two
Temperature and Wind for InSight (TWINS) booms facing outward, which overlook the dusty solar panels, and the pressure sensor’s inlet in the middle (Image PIA23203). c, Atmospheric dust optical depth obtained from IDC (red) and ICC (black) imaging in the morning (diamonds) and evening (circles);
1σ error bars, dominated by the systematic effects in the tau retrieval, are indicated on the plot. d, ICC image on sol 145 (Ls = 16°) showing noctilucent
clouds after sunset, with the HP3 (Heat Flow and Physical Properties Package) suite, and the SEIS below the wind and thermal shield in the foreground
occurred every sol in early evening, which then grew into pressure
‘bumps’ in the storm’s decaying phase. The pressure bumps reached
a maximum of 4 Pa, and occurred later and later every sol (for
reasons not yet understood) before decreasing and disappearing at
the end of the dust storm disturbance (Fig.
4b
). They were followed
by 900 s period fluctuations of pressure and air temperature as well
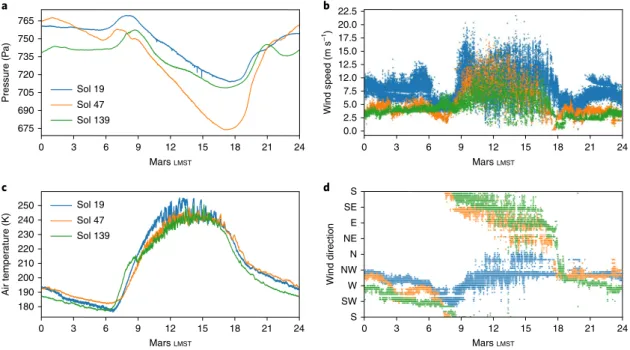
765 a b c d 250 S SE NE NW SW S W N E 240 230 220 210 200 190 180 22.5 20.0 17.5 15.0 12.5 12.0 7.5 5.0 2.5 0.0 750 735 Sol 19 Sol 47 Sol 139 Sol 19 Sol 47 Sol 139 720 Pressure (P a) Air temper ature (K) Wind speed (m s –1) Wind direction 705 690 675 0 3 6 9 12 Mars LMST 15 18 21 24 0 3 6 9 12 Mars LMST 15 18 21 24 0 3 6 9 12 Mars LMST 15 18 21 24 0 3 6 9 12 Mars LMST 15 18 21 24Fig. 2 | The Martian meteorology of three typical sols experienced by InSight shows a diversity of scales involved from the planetary scale to local turbulent scales. a–d, Measurements of pressure (a), wind speed (b), atmospheric temperature (c) and wind direction (d) are shown. The blue lines
correspond to sol 19, shortly after landing (Ls = 307°). The orange lines correspond to sol 47 during the regional dust storm, which significantly perturbed
the local weather at the InSight landing site (Ls = 324°). The green lines correspond to sol 139 (Ls = 13°) in northern spring after the decay of the regional
dust storm. The directions indicated for winds are the directions from which the wind is blowing, following atmospheric science convention.
4 a b Ls = 330° Ls = 0° Ls = 30° Ls = 330° Ls = 0° Ls = 30° 3 2 1 0 –1 –2 Pressure per turbation (P a) Wind speed (m s –1) –3 –4 11 10 9 8 7 6 5 4 3 25 50 75 100 125 150 175 200 25 50 75 100 125 InSight sol InSight sol 150 175 200
2.5 sols Dust storm 5–6 sols 4 sols
Fig. 3 | Despite its equatorial location, InSight’s pressure and wind daily variability are sensitive to the weather in Mars’s mid-latitudes, dominated by baroclinic instability. a,b, Pressure (a) and wind (b) fluctuations obtained by low-pass filtering to remove thermal tides, mesoscale meteorology and local
turbulence signals. Pressure is also detrended with a 1 sol running mean, which removes the seasonal impact of CO2 condensation and/or sublimation.
Grey areas correspond to sol intervals during which APSS (Auxiliary Payload Sensor Suite) experienced anomalies that prevented measurements from being carried out. Wavelet analysis of the excerpts of the pressure signal in a are shown in Extended Data Fig. 3.
as changes in wind speed and direction. For InSight, the density
current that causes the bore could be katabatic drainage flows
coming from the slopes of Elysium Mons and/or the dichotomy
boundary. Dust storm conditions on Mars reinforce the night-time
low-level jet
43, which is known to be a near-surface trapping
mecha-nism for wave energy conducive to bores
44. Pressure jumps in the
morning were also observed on at least one sol after the complete
decay of the dust storm, which suggest bores might also occur in
clear seasons.
Atmospheric oscillations at higher frequencies than gravity
waves belong to the acoustic regime, not explored on Mars prior to
InSight. Benefiting from unprecedented fine-sensitivity and
high-frequency coverage, InSight’s pressure sensor revealed coherent
oscillations that are candidates for infrasound—acoustic waves at
frequencies less than ~20 Hz, which may propagate over large
dis-tances
45. The first type of candidate infrasound includes, embedded
within a 300–500 s gravity-wave signal, additional night-time
pres-sure oscillations of period 80 s (Fig.
4c
), slightly below the
lower-limit gravity-wave period of ~100 s in the observed conditions. The
second type of candidate infrasound are pressure oscillations with
a period of ~0.8 s occasionally found within the pressure minimum
of daytime convective vortices (Fig.
4d
).
Turbulence studies
Convective vortices are key phenomena during the daytime
turbu-lent regime and are termed dust devils if their dust content makes
them visible. InSight is the most active site for convective vortices
visited thus far by a spacecraft carrying a pressure sensor. About
152 a b c d 150 148 146 144 142 140 138 136 No. of sol and detrended pressure (P
a) 134 132 130 128 126 124 122 736.6 736.0 735.4 734.8 Pressure (P a) P er iod (s) 734.2 733.6 733.0 2 3 5 2 3 5 2 0 500 1,000 1,500 2,000 0 5 10 15 20 25 30 35 40
Time coordinate (s) Time coordinate (s)
2,500 3,000 3,500 4,000 4,500 102 103 P er iod (s) 2 3 5 2 3 101 100 5 728.8 728.0 727.2 726.4 Pressure (P a) 725.6 724.8 21.75 21.90 22.05 22.20 22.35 22.50 22.65 22.80 22.95 82 80 78 76 74 72 70 68 66 No
. of sol and detrended pressure (P
a) 64 62 60 58 56 54 52 18.0 18.5 19.0 19.5 20.0 20.5
Mars local true solar time (h)
Mars local true solar time (h)
14.5885 14.5900 14.5915 14.5930 14.5945 14.5960 14.5975 14.5990 Mars local mean solar time (h)
21.5 22.0 22.5 23.0
21.0 18.0 18.5 19.0 19.5 20.0 20.5
Mars local true solar time (h)
21.0
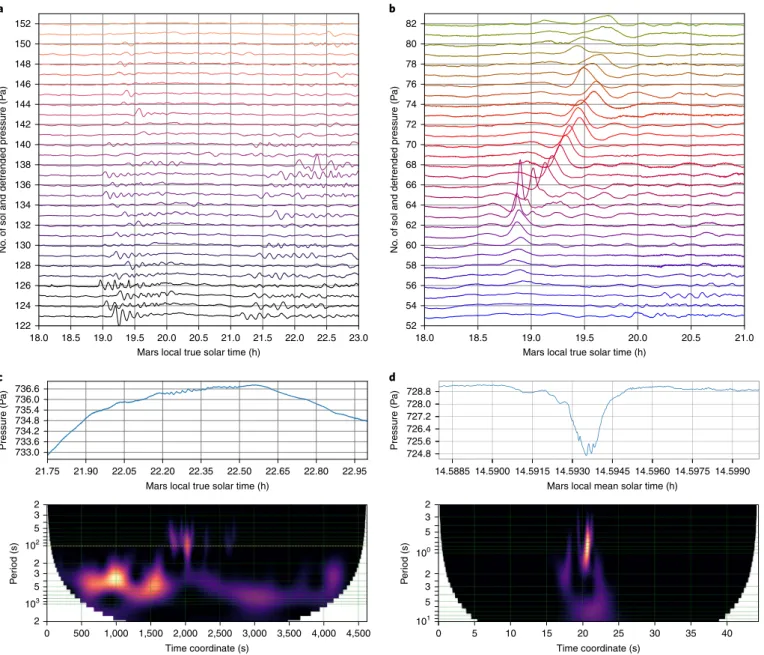
Fig. 4 | InSight unveiled pressure fluctuations probably related to gravity waves, bores and solitary waves and infrasound. a,b, Pressure fluctuations
probably related to gravity waves (a), and bores and solitary waves (b). The pressure was detrended using a 2,000 s smoothing window in evening
conditions. The x axis is the local true solar time in Martian hours. The y axis follows the pulsar plot by Craft65, which was used as the cover of Joy Division's Unknown Pleasures album: each line corresponds to a sol and the vertical scale is the detrended pressure (Pa) offset by the sol number. c, Pressure
measurements during an evening gravity-wave event on sol 78 (Ls = 341°) above a wavelet power spectra of the signal detrended using a 500 s smoothing
window. The yellow line shows the 100 s period below which oscillations are infrasound rather than gravity waves. d, Same as c, but during a daytime
1,000 sudden pressure drop events deeper than 0.5 Pa, which
cor-respond to convective vortices, were detected during InSight’s first
220 sols (Fig.
5a
). InSight detected about twice as many vortices
per sol as Pathfinder
46and up to five times as many as Phoenix
47and Curiosity
48, accounted for by their respective temporal
cover-age (Fig.
5b
). This strong vortex activity caused ground
deforma-tions recorded in seismic measurements
49,50and provided a natural
seismic source to probe the first few metres below the surface
11—
magnetic signatures are ambiguous
51. On sol 65, when a 9 Pa
pres-sure drop passed over the lander (the strongest convective vortex
measured to date on Mars), InSight recorded a sudden 1% increase
in solar power (Fig.
5c
), putatively caused by dust being removed
from the solar panels, and imaged clumps of particles that had
moved on InSight’s wind and thermal shield. Orbital HiRISE
imag-ing
52of ~100 km
2around the InSight landing site has also revealed
tens of newly formed dust-devil tracks in a short 5 sol window after
InSight’s landing, when intense vortex activity was detected by the
pressure sensor. The inferred production rate for these tracks is
~0.57 tracks sol
–1km
–2, an order of magnitude larger than the
pre-landing predictions
53. Sol-to-sol linear or curvilinear changes in
surface brightness have also occasionally been seen by taking ratios
of InSight images at a similar illumination
54.
Nevertheless, InSight shows that the mobilization of dust
par-ticles from the surface is a subtle process. During the strongest wind
gust recorded by InSight’s wind sensors (~24 m s
–1on sol 26), no
associated motion of dust particles could be robustly demonstrated.
Furthermore, not a single dust devil has been imaged from the
ground in the first 200 sols of the mission, even though hundreds
of mid-day Instrument Context Camera (ICC) and tens of IDC
images (including periods with many vortex-pressure-drop
detec-tions) have been analysed. If vortices lifted dust as often at InSight as
at, for example, the Spirit landing site
55, at least several dust devils (if
not dozens) should have been imaged. The formation of dust-devil
tracks means that at least enough dust is being lifted by vortices to
change the surface albedo. Yet it appears that either the amount of
dust lifted is insufficient to produce dust devils visible to InSight’s
cameras, which would differ from other sites with similar (or even
far less) vortex activity, or that InSight has simply missed seeing
them due to the timing and number of observations made to date.
On a more general note, InSight’s potential to contribute to aeolian
science will be fully expressed with a coverage over a full Martian
year of wind speeds, pressure drops and surface change images
56.
The repeated continuous measurements by InSight, both
atmo-spheric (Fig.
2
) and seismic
12,57, strongly suggest, in addition to the
16 a b Ls = 300° c Ls = 330° Ls = 0° Ls = 30° 14 12 10 8 No . of pressure drops 6 4 2 0 101 702.0 0.233 0.232 0.231 0.230 0.229 0.228 21.0 18.0 15.0 12.0 Wind speed (m s –1) W
est current (A)
9.0 6.0 3.0 0.0 700.5 699.0 697.5 Pressure (P a) 696.0 694.5 693.0 14.392 14.395 14.398 14.401 14.404 14.407 14.410 14.413 14.416 14.419 InSight Pathfinder Phoenix Curiosity 100 10–1 10–2 6 × 10⁻¹ 100 2 × 100 3 × 100
Pressure drop (Pa) 5
3 2
5 3 Events per sol 2
5 3 2 25 50 75 100 InSight sol 125 150 175
Mars local mean solar time (h)
14.392 14.395 14.398 14.401 14.404 14.407 14.410 14.413 14.416 14.419
Mars local mean solar time (h)
14.392 14.395 14.398 14.401 14.404 14.407 14.410 14.413 14.416 14.419
Mars local mean solar time (h) 200
Fig. 5 | Daytime dust-devil-like convective vortices are very active at the InSight landing site and caused at least one solar-panel cleaning event witnessed by InSight. a, Number of pressure drops per sol that exceeded 0.5 Pa (the list of the 15 strongest events is included as Extended Data
Fig. 7). b, Distribution of pressure drops per sol, normalized by diurnal coverage and number of observed sols, including the statistics from other
landers46–48. c, Pressure, wind speed and solar array current recorded during the deepest pressure drop observed at the surface of Mars thus far (InSight sol 65, Ls = 334°).
two aforementioned previously known daytime/night-time
turbu-lent regimes, the existence of a new, third ‘quiet’ regime: both the
ambient and turbulent wind speed are systematically extremely low
about 2-4 hours after sunset (Fig.
2b
and Extended Data Fig. 8),
following the collapse of daytime turbulence. This has remained
elusive in previous measurements that lacked InSight’s resolution
and continuity
4. The transition from the daytime convective regime
to the evening quiet regime is very abrupt, much more than that
experienced on Earth, and results from the efficient radiative
cool-ing of the surface and the near-surface Martian atmosphere at
sun-set—interestingly, during the dusty sols 40–90, not only was the
daytime turbulence reduced (Fig.
2b
) but also the quiet regime was
less clearly defined (Extended Data Fig. 8). The later transition from
the evening quiet regime to the night time shear-driven regime
is more gradual and corresponds to the onset of the nocturnal
low-level jet
28,43: as the nocturnal thermal inversion develops, the
winds above become decoupled from the surface and the decrease in
friction produces a net acceleration. Interestingly, a quiet regime akin
to the evening regime is occasionally also observed a couple of hours
before sunrise. The quiet regime identified by InSight has proved to
be of paramount importance for seismic detection. The atmosphere
is the major source of seismic noise on Mars
11, so a strong ambient
wind and/or strong turbulence significantly increases the detection
threshold for Mars quakes
12. As a result, the vast majority of seismic
events are detected specifically during the quiet regime.
The InSight pressure measurements at a high frequency yield
novel results for turbulence compared to those of existing studies on
Mars
30,58. Night-time high-frequency fluctuations of pressure, wind
and air temperature are found by InSight to be typically 2–10 times
smaller than those in the daytime regime (Extended Data Fig. 8a).
728.2 a b 0.08 0.06 0.04 0.02 0.00 –0.02 –0.04 –0.06 –0.08 2 5 100 Po wer spectr um (P a 2 Hz –1) 10–1 10–2 10–3 10–4 10–5 10–2 10–1 100 3 2 5 3 2 5 3 2 5 3 2 5 3 2 5 3 20.00 20.02 20.04 20.06 20.08 20.10 20.12 20.14 20.16 727.6 727.0 726.4 Pressure (P a) Pressure (P a) 725.8 725.2 20.00 20.02 20.04 20.06 20.08Mars local mean solar time (h)
Mars local mean solar time (h)
Frequency (Hz)
20.10 20.12 20.14 20.16
Fig. 6 | The InSight pressure sensor explores a new territory of high-frequency turbulence on Mars. a, High-frequency pressure bursts detected on sol
114 (Ls = 0°): the raw pressure signal is shown on top of a detrended version using a smoothing window of 50 s. b, Power spectrum produced from 40 sols
of daytime pressure fluctuations from sols 168 to 208 (Ls = 27–45°) when pressure was continuously sampled at 10 Hz. Cyan points correspond to the
spectra computed for InSight pressure measurements. The green curve is a smoothed version of the cyan points to display the average power spectrum of pressure more clearly. A power-law fitting (f(x) = axb with b = –1.70) of the data points in cyan in the range 0.02–2 Hz is shown as a blue line.
Significant sol-to-sol variability in the intensity and peak timing
of the night-time turbulence is experienced at InSight, the most
remarkable phenomenon being the irregular occurrence of
‘pres-sure bursts’ in the high-frequency 2–10 Hz range (Fig.
6a
), which
show no correlation with any instrument artefacts or lander events.
Such intermittent turbulence is also found on Earth in peculiar
highly stable and low ambient wind conditions
59, which are also met
during the InSight pressure burst observations.
Mars is an interesting laboratory to study daytime turbulence
on a purely theoretical basis—compared to Earth, the Martian
day-time turbulence is characterized by a stronger radiative control, a
lack of latent heat forcing and a reduced inertial range
60. The
high-frequency pressure measurements performed by InSight during
numerous sols in this much different Martian environment can
be compared to turbulent pressure spectra measured on Earth
61,62,
which contradict the inertial subrange predictions for pressure by
the classical Kolmogorov theory. The power spectral density of
pres-sure meapres-sured by InSight in the daytime (Fig.
6b
) can be described
consistently for frequencies f from 5 × 10
−2Hz to 2 Hz with a power
law f
αsuch that
α = –1.7. Despite the environmental differences
between Mars and Earth, this exponent slope retrieved by InSight is
remarkably similar to exponent slopes
α from –1.5 to –1.7 retrieved
on Earth. Hence, both the terrestrial and Martian measurements
concur to show that the –7/3 (≃ –2.33) slope expected for pressure
from the Kolmogorov theory
63is not supported by in situ
observa-tions. This strongly suggests that, contrary to wind and temperature,
a combined influence of local turbulence and larger-scale variability
is needed to account for high-frequency pressure fluctuations
62.
References
1. Haberle, R. M., Clancy, R. T., Forget, F., Smith, M. D. & Zurek, R. W. The
Atmosphere and Climate of Mars Vol. 18 (Cambridge Univ. Press, 2017).
2. Hess, S. L., Henry, R. M., Leovy, C. B., Ryan, J. A. & Tillman, J. E. Meteorological results from the surface of Mars: Viking 1 and 2. J. Geophys.
Res. 82, 4559–4574 (1977).
3. Clancy, R. T. & Sandor, B. J. CO2 ice clouds in the upper atmosphere of Mars.
Geophys. Res. Lett. 25, 489–492 (1998).
4. Martínez, G. M. et al. The modern near-surface Martian climate: a review of in-situ meteorological data from Viking to Curiosity. Space Sci. Rev. 212, 295–338 (2017).
5. Haberle, R. M. et al. Preliminary interpretation of the REMS pressure data from the first 100 sols of the MSL mission. J. Geophys. Res. Planets 119, 440–453 (2014).
6. Banfield, D. et al. InSight Auxiliary Payload Sensor Suite (APSS). Space Sci.
Rev. 215, 4 (2018).
7. Spiga, A. et al. Atmospheric science with insight. Space Sci. Rev. 214, 109 (2018).
8. Schofield, J. T. et al. The Mars Pathfinder atmospheric structure investigation/ meteorology (ASI/MET) experiment. Science 278, 1752–1757 (1997). 9. Holstein-Rathlou, C. et al. Winds at the Phoenix landing site. J. Geophys. Res.
Planets 115, E00E18 (2010).
10. Gómez-Elvira, J. et al. Curiosity’s rover environmental monitoring station: overview of the first 100 sols. J. Geophys. Res. Planets 119, 1680–1688 (2014). 11. Lognonné, P. et al. Constraints on the shallow elastic and anelastic structure
of Mars from InSight seismic data. Nat. Geosci. https://doi.org/10.1038/ s41561-020-0536-y (2020).
12. Giardini, D. et al. The seismicity of Mars. Nat. Geosci. https://doi.org/10.1038/ s41561-020-0539-8 (2020).
13. Barnes, J. R. Time spectral analysis of the midlatitude disturbances in the Martian atmosphere. J. Atmos. Sci. 37, 2002–2015 (1980).
14. Banfield, D., Conrath, B. J., Gierasch, P. J., Wilson, R. J. & Smith, M. D. Traveling waves in the Martian atmosphere from MGS TES Nadir data. Icarus
170, 365–403 (2004).
15. Collins, M., Lewis, S. R., Read, P. L. & Hourdin, F. Baroclinic wave transitions in the Martian atmosphere. Icarus 120, 344–357 (1996).
16. Lewis, S. R. et al. The solsticial pause on Mars: 1. A planetary wave reanalysis.
Icarus 264, 456–464 (2016).
17. Haberle, R. M. et al. Detection of Northern Hemisphere transient eddies at Gale Crater Mars. Icarus 307, 150–160 (2018).
18. Ryan, J. A. & Henry, R. M. Mars atmospheric phenomena during major dust storms as measured at surface. J. Geophys. Res. 84, 2821–2829 (1979). 19. Sánchez-Lavega, A., del Río-Gaztelurrutia, T., Hernández-Bernal, J. &
Delcroix, M. The onset and growth of the 2018 Martian global dust storm.
Geophys. Res. Lett. 46, 6101–6108 (2019).
20. Murphy, J. R. et al. Three-dimensional numerical simulation of Martian global dust storms. J. Geophys. Res. 100, 26357–26376 (1995). 21. Battalio, M., Szunyogh, I. & Lemmon, M. Energetics of the Martian
atmosphere using the Mars Analysis Correction Data Assimilation (MACDA) dataset. Icarus 276, 1–20 (2016).
22. Määttänen, A. et al. Mapping the mesospheric CO2 clouds on Mars: MEx/
OMEGA and MEx/HRSC observations and challenges for atmospheric models. Icarus 209, 452–469 (2010).
23. Clancy, R. T. et al. The distribution, composition, and particle properties of Mars mesospheric aerosols: an analysis of CRISM visible/near-IR limb spectra with context from near-coincident MCS and MARCI observations. Icarus
328, 246–273 (2019).
24. Scholten, F. et al. Concatenation of HRSC colour and OMEGA data for the determination and 3D-parameterization of high-altitude CO2 clouds in the
Martian atmosphere. Planet. Space Sci. 58, 1207–1214 (2010).
25. Sonnabend, G., Sornig, M., Kroetz, P. & Stupar, D. Mars mesospheric zonal wind around northern spring equinox from infrared heterodyne observations of CO2. Icarus 217, 315–321 (2012).
26. Gronoff, G. et al. Computing uncertainties in ionosphere–airglow models: ii. The Martian airglow. J. Geophys. Res. Space Phys. 117, A05309 (2012). 27. Zurek, R. W. & Leovy, C. B. Thermal tides in the dusty Martian
atmosphere—a verification of theory. Science 213, 437–439 (1981). 28. Savijärvi, H. & Siili, T. The Martian slope wind and the nocturnal PBL jet.
J. Atmos. Sci. 50, 77–88 (1993).
29. Spiga, A. et al. The impact of Martian mesoscale winds on surface temperature and on the determination of thermal inertia. Icarus 212, 504–519 (2011).
30. Tillman, J. E., Landberg, L. & Larsen, S. E. The boundary layer of Mars: fluxes stability, turbulent spectra and growth of the mixed layer. J. Atmos. Sci. 51, 1709–1727 (1994).
31. Lee, C. et al. Thermal tides in the Martian middle atmosphere as seen by the Mars Climate Sounder. J. Geophys. Res. Planets 114, E03005 (2009). 32. Wilson, R. W. & Hamilton, K. Comprehensive model simulation of thermal
tides in the Martian atmosphere. J. Atmos. Sci. 53, 1290–1326 (1996). 33. Fritts, D. C. & Alexander, M. J. Gravity wave dynamics and effects in the
middle atmosphere. Rev. Geophys. 41, 1003 (2003).
34. Barnes, J. R. Possible effect of breaking gravity waves on the circulation of the middle atmosphere of Mars. J. Geophys. Res. 95, 1401–1421 (1990).
35. Magalhaes, J. A., Schofield, J. T. & Seiff, A. Results of the Mars Pathfinder atmospheric structure investigation. J. Geophys. Res. 104, 8943–8956 (1999). 36. Creasey, J. E., Forbes, J. M. & Hinson, D. P. Global and seasonal distribution
of gravity wave activity in Mars’ lower atmosphere derived from MGS radio occultation data. Geophys. Res. Lett. 33, L01803 (2006).
37. Spiga, A. et al. Remote sensing of surface pressure on Mars with the Mars Express/OMEGA spectrometer: 2. Meteorological maps. J. Geophys. Res.
Planet 112, E08S16 (2007).
38. Harri, A.-M. et al. Pressure observations by the Curiosity Rover: initial results. J. Geophys. Res. Planets 119, 82–92 (2014).
39. Rafkin, S. C. R. et al. The meteorology of Gale Crater as determined from Rover Environmental Monitoring Station observations and numerical modeling. part ii: Interpretation. Icarus 280, 114–138 (2016).
40. Hartung, D. C., Otkin, J. A., Martin, J. E. & Turner, D. D. The life cycle of an undular bore and its interaction with a shallow, intense cold front. Monthly
Weather Review 138, 886–908 (2010).
41. Maria, M. R. V. S., Rafkin, S. C. R. & Michaels, T. I. Numerical simulation of atmospheric bore waves on Mars. Icarus 185, 383–394 (2006).
42. Spiga, A. & Smith, I. Katabatic jumps in the Martian northern polar regions.
Icarus 308, 197–208 (2018).
43. Joshi, M. M., Haberle, R. M., Barnes, J. R., Murphy, J. R. & Schaeffer, J. Low-level jets in the NASA Ames Mars general circulation model. J. Geophys.
Res. Planets 102, 6511–6524 (1997).
44. Koch, S. E. et al. Structure of an internal bore and dissipating gravity current as revealed by Raman lidar. Monthly Weather Rev. 119, 857–887 (1991). 45. Williams, J.-P. Acoustic environment of the Martian surface. J. Geophys. Res.
46. Murphy, J. R. & Nelli, S. Mars Pathfinder convective vortices: frequency of occurrence. Geophys. Res. Lett. 29, 2103 (2002).
47. Ellehoj, M. D. et al. Convective vortices and dust devils at the Phoenix Mars mission landing site. J. Geophys. Res. Planets 115, E00E16 (2010).
48. Ordonez-Etxeberria, I., Hueso, R. & Sánchez-Lavega, A. A systematic search of sudden pressure drops on Gale Crater during two Martian years derived from MSL/REMS data. Icarus 299, 308–330 (2018).
49. Lorenz, R. D. et al. Seismometer detection of dust devil vortices by ground tilt. Bull. Seismol. Soc. Am. 105, 3015–3023 (2015).
50. Kenda, B. et al. Modeling of ground deformation and shallow surface waves generated by Martian dust devils and perspectives for near-surface structure inversion. Space Sci. Rev. 211, 501–524 (2017).
51. Johnson, C. L. et al. Crustal and time-varying magnetic fields at the InSight landing site on Mars. Nat. Geosci. https://doi.org/10.1038/s41561-020-0537-x
(2020).
52. McEwen, A. S. et al. Mars Reconnaissance Orbiter’s High Resolution Imaging Science Experiment (HiRISE). J. Geophys. Res. 112, E05S02 (2007).
53. Reiss, D. & Lorenz, R. D. Dust devil track survey at Elysium Planitia, Mars: implications for the InSight landing sites. Icarus 266, 315–330 (2016). 54. Banerdt, W. B. et al. Initial results from the InSight mission on Mars. Nat.
Geosci. https://doi.org/10.1038/s41561-020-0544-y (2020).
55. Greeley, R. et al. Gusev Crater, Mars: observations of three dust devil seasons.
J. Geophys. Res. Planets 115, E00F02 (2010).
56. Golombek, M. et al. Geology of the InSight landing site on Mars. Nat.
Commun. https://doi.org/10.1038/s41467-020-14679-1 (2020).
57. Lognonné, P. et al. SEIS: InSight’s Seismic Experiment for Internal Structure of Mars. Space Sci. Rev. 215, 12 (2019).
58. Davy, R. et al. Initial analysis of air temperature and related data from the Phoenix MET station and their use in estimating turbulent heat fluxes.
J. Geophys. Res. Planets 115, E00E13 (2010).
59. Van de Wiel, B. J. H., Ronda, R. J., Moene, A. F., de Bruin, H. A. R. & Holtslag, A. A. M. Intermittent turbulence and oscillations in the stable boundary layer over land Part I: a bulk model. J. Atmos. Sci. 59, 942–958 (2002).
60. Larsen, S. E., Jørgensen, H. E. & Landberg, L. et al. Aspects of the atmospheric surface layers on Mars and Earth. Bound. Lay. Meteorol. 105, 451–470 (2002).
61. Elliott, J. A. Microscale pressure fluctuations measured within the lower atmospheric boundary layer. J. Fluid Mech. 53, 351–383 (1972). 62. Albertson, J. D., Katul, G. G., Parlange, M. B. & Eichinger, W. E. Spectral
scaling of static pressure fluctuations in the atmospheric surface layer: the interaction between large and small scales. Phys. Fluids 10, 1725–1732 (1998).
63. Tsuji, Y., Fransson, J. H. M., Alfredsson, P. H. & Johansson, A. V. Pressure statistics and their scaling in high-Reynolds-number turbulent boundary layers. J. Fluid Mech. https://doi.org/10.1017/S0022112007006076 (2007).. 64. Withers, P. & Smith, M. D. Atmospheric entry profiles from the Mars
Exploration Rovers Spirit and Opportunity. Icarus 185, 133–142 (2006). 65. Craft, H. D. Jr Radio Observations of the Pulse Profiles and Dispersion
Measures of Twelve Pulsars. PhD thesis, Cornell Univ. (1970).
Publisher’s note Springer Nature remains neutral with regard to jurisdictional claims in
published maps and institutional affiliations.
Methods
Mars calendars and times. The Mars–Sun angle, named the solar longitude Ls (°),
is used to indicate seasons on Mars: 0° corresponds to northern spring equinox, 90° to northern summer solstice (aphelion season), 180° to northern fall equinox and 270° to northern winter solstice (perihelion season). A Mars solar year is about 1.9 Earth years, or 668.59 sols. The InSight landing on 26 November 2018 corresponds to InSight sol 0. Extended Data Fig. 2 indicates the correspondence between InSight sols and Ls. Mars local mean solar time is measured by using a 24 h ‘Mars
clock’, in which the timing of local noon undergoes a seasonal variation of up to 50 min. Mars local true solar time (LTST) indicates the sundial hours: noon always corresponds to a zenith position of the sun in the sky.
Atmospheric profiles during EDL. InSight’s EDL trajectory and associated
atmospheric structure was reconstructed using data from its accelerometers and gyroscopes, following a method similar to that developed for Phoenix’s EDL trajectory66. Details of the method are provided in Section 3.1 of the prelanding paper7.
Pressure measurements. The pressure sensor on board InSight samples at 20 Hz
with a noise level of 10 mPa Hz−1∕2 from 0.1 to 1 Hz rising to 50 mPa Hz−1∕2 at 0.01
Hz have, respectively, one order of magnitude higher frequency and two orders of magnitude finer resolution than those previous instruments sent to Mars4,6. The pressure sensor communicates with the ambient atmosphere through an inlet tubing6 specifically designed to minimize the effects of wind on the pressure measurements. Nevertheless, the variance of the pressure signal measured by InSight at frequencies above 2 Hz is sometimes correlated with wind speed, which potentially points towards either a loss of effectiveness of the pressure inlet at such frequencies or to mechanical or electrical noise within the pressure sensor; as a result, although future work might extract useful information from the pressure measurements above 2 Hz, our discussions are based only on frequencies below this limit (for example, as in Fig. 6b). A notable exception is the occurrence of night time high-frequency pressure bursts reported in Fig. 6a, which are not correlated with wind speed.
Wind and temperature measurements. The TWINS sensor booms, based on the
same principle as those on board the Curiosity rover, face outward over InSight’s two solar panels at ~1.2 m from the surface (respectively, 121.5 and 111.5 cm from the surface for the west and east booms, due to InSight’s tilt) to acquire wind and air temperature at a frequency of 1 Hz and an accuracy of ~1 m s−1 for wind speed,
22.5° for wind direction and 5 K for temperature. Wind speed and direction are reconstructed given the measurements of the two booms, the position of each boom compared to the prevailing wind and corrections of the influence of lander elements on the retrieved wind, as obtained from computational fluid dynamics simulations. Details on wind measurements are provided in the prelanding references6,7. Wind retrievals are not reliable for Reynolds numbers Re ≲ 50, and sometimes questionable for Re ≲ 90, which corresponds to wind speeds, respectively, of 1.8 and 2.8 m s−1 at the pressure and temperature conditions
experienced by InSight.
The air temperature measurements are perturbed from measuring a clean, true air temperature measurement due their close proximity to the lander itself (for example, from ultracooled solar panels during the night) and their non-negligible radiative cross-section. When winds and convection are strong, the advective heat transfer to the sensor dominates, but when winds are low, radiative effects are more significant. Discrepancy from the modelling suggests that these perturbations may reach as high as 10–15 K. The air temperature measurements by TWINS appear to be not perturbed equally at different local times: in daytime, differences between the two booms are very high, while at night, measurements by the two booms are close to one another but exhibit a spurious offset to yield air temperatures unphysically colder than the surface temperatures retrieved by InSight’s radiometer. Further work is warranted to fully understand this issue.
Measurements by major InSight instruments of interest for atmospheric science. The InSight instrument suite for atmospheric science also includes
a radiometer within the Heat Flow and Physical Properties Package (HP3) to
measure surface brightness temperature56,67. For the first time on Mars, InSight includes the ability to use the wind- and pressure-induced perturbations from seismic measurements by SEIS for atmospheric science7,11,12,57 with (from sol 66) the wind and thermal shield that covers InSight’s seismometer where it sits on the surface. The description of the methodology developed for seismic data is included in the SEIS companion papers11,12.
Imaging in situ and from orbit. The two cameras on board InSight68 (the IDC on the forearm with a 45° field-of-view and the ICC just below the deck with a 180° field-of-view) can image the sky to perform regular dust opacity estimates (the method is detailed in the Section 3.3.2 of the prelanding reference7) and occasional surveys for dust devils and clouds. The reported HiRISE (High Resolution Imaging Science Experiment) images have the following references: ESP 057939 1845 (6 December 2018), ESP 058005 1845 (11 December 2018) and ESP 060695 1845 (8 July 2019). A simple ratio was performed between co-registered HiRISE images
to bring out new surface changes, such as dust-devil tracks. Then, both manual mapping and semi-automatic track detections using the radon transform technique were performed to characterize the main track properties (for example, azimuth, distance to lander, width and so on).
Noctilucent clouds. The noctilucent clouds were found in a set of images taken
after the Sun had set at the lander (around 18:30 local time), but the terminator still intercepted the atmosphere at an altitude of 50 km. The fact that the clouds were illuminated reveals their height as at least 50 km. The images were map projected onto a spherical shell 50 km above the mean surface level and the motion of discrete features was measured in the projected image.
Airglow detection. The airglow detection was made in a series of four IDC images
taken from 22:06 to 22:47 local true solar time on sol 126, with the Sun roughly 60° below the horizon. The images had 5 min exposure times and were dark corrected and co-added. The shadow of the scoop was clearly visible, which demonstrates the existence of skylight as opposed to an unmodelled dark current. The relative brightness of the excess light in the three broadband colour channels of InSight’s cameras was not diagnostic, but is consistent with a 577.8 nm emission and not consistent with starlight or moonlight.
Dust-devil imaging non-detection. As of sol 200, 655 ICC images were taken
with the Sun up; of these, 278 were taken with the Sun above 45° and 443 were taken over 11–17 LTST. At least ten of the ICC images were taken within 5 min of a vortex with a recorded pressure drop >1 Pa. We examined ratios of these images to images that were nearby in a metric that combined time of day (for illumination) and sol (for dust on the optics). No features were seen at the percentage level for high compression quality images (the large majority) or at the several percentage level in low-quality images. In addition, 333 IDC images including the horizon were examined, of which 90% were taken from 11 to 17 LTST and half were taken with the Sun above 45° elevation. These were primarily aimed to the south-southeast to south-southwest, with eastward directions rarely sampled. Similar processing that used an average of sky images for comparison yielded no dust-devil-like features at subpercentage levels.
Atmospheric modelling. The predictions by global climate modelling used for this
study are referenced in Section 2.2 of the prelanding paper7. The method used to extrapolate the wind speed from the first model levels above the surface to the level of the TWINS measurements used the formalism described in Section 6.1 of the prelanding paper7. The global climate model simulation with flattened topography mentioned in the text and presented in Extended Data Fig. 4 was carried out in the exact same setting defined in the prelanding paper7, except for a flattening of the topographical slopes over a box 10° of latitude and longitude centred at the InSight landing site.
Signal processing. To perform low-pass or high-pass filtering of the signal,
time series of InSight measurements were smoothed using a one-dimensional convolution approach with a Hanning window, as is described in the cookbook of the scipy Python package https://scipy-cookbook.readthedocs.io/items/ SignalSmooth.html. The spectral analysis carried out in this paper uses the wavelet approach adapted to atmospheric science described in the reference study on this topic69 with details included in http://paos.colorado.edu/research/wavelets (the Python version adapted by E. Predybaylo is used in this study). Detailed information on the codes used for the analysis in this paper are provided in the Code availability section.
Seasonal variations of pressure. CO2 is the main component of the Martian
atmosphere and the surface pressure on Mars varies on a seasonal basis up to 30% as a result of the condensation and sublimation of the CO2 in Martian polar
regions2. Over the timespan of about a quarter of a Martian year covered by the initial InSight measurements, the general pressure trend is a long-term decrease in northern winter caused by condensation of CO2 in the northern seasonal polar
cap, followed by an increase due to sublimation in northern spring. This evolution closely follows the Viking observations 40 years ago, once corrected for topography and atmospheric dynamics7,70.
Diurnal cycle of wind direction. The InSight wind measurements indicate a
northwesterly wind in northern winter, slowly transitioning in northern spring to a southeasterly wind only in the daytime (Fig. 2d), consistent with dust-devil tracks and ripples in Elysium Planitia53,71. The measured wind behaviour confirms the pre-landing predictions by global climate modelling7 in the Elysium Planitia region, which points to the combined influence of Hadley cells and western boundary currents, two key phenomena that also control Earth’s large-scale winds in the subtropics.
Gravity-wave analysis. The simultaneous detection of gravity-wave oscillations of
pressure and wind by a surface weather station enables the horizontal wavelength of the putative gravity wave to be estimated72. The range of periods detected by InSight (less than half a Martian hour) corresponds to high-to-mid-frequency
gravity waves for which the Coriolis influence is negligible—an approximation also ensured by the equatorial position of InSight. In these conditions, according to the polarization equations33, the pressure perturbation p′ is related to the wind speed perturbation V′ by the ‘impedance relation’72,73:
V0¼ p0
ρ0ðc � VÞ
where ρ0 and V are, respectively, the ambient density and wind speed, and
c = ω∕k = λ∕T is the phase speed of the gravity wave with ω and T the frequency and period and k and λ the horizontal wavenumber and wavelength. Oscillations of
pressure and wind were simultaneously detected only in rare cases (4–5 clear-cut cases) in the first 200 sols of the InSight measurements; oscillations are more distinctively detected in the wind direction than in the wind speed. The wave packets identified in pressure and wind on sols 142 and 150 are included as representative examples in Extended Data Figs. 5 and 6. The gravity-wave period is found to be similar both in the pressure and wind time series; zonal wind, meridional wind and pressure are either in phase or 180° out of phase, which is compliant with polarization equations in the case of high-to-mid-frequency gravity waves (conversely, wind components in low-frequency inertio-gravity waves would be 90° out of phase). Once the period T is determined, the knowledge from InSight measurements of p′ and V′, as well as the ambient wind V, leads to the horizontal wavelength λ through the impedance relation (ambient InSight measurements of
pressure and temperature yield ρ0= 0.02 kg m−3). Horizontal wavelengths of 25 km
and 33 km and phase speeds 17 m s–1 and 22 m s–1 were, respectively, found for sol
142 and sol 150 night-time wave packets. We checked that the non-linear version of the impedance relation73 is not necessary because, in the cases studied here, the following linear approximation holds:
ρ0
V02
2 p0
Data availability
The raw to calibrated datasets of InSight are available via the Planetary Data System (PDS). Data are delivered to the PDS according to the InSight Data Management Plan available in the InSight PDS archive. Data from the APSS pressure sensor and the temperature and wind (TWINS) sensor referenced in this paper are available from the PDS Atmospheres node. The direct link to the InSight data archive at the PDS Atmospheres node is https://atmos.nmsu.edu/data_and_services/ atmospheres_data/INSIGHT/insight.html. Other data used in this paper are available from the imaging node (ICC and IDC images) and the geosciences node (SEIS and HP3) of the PDS. SEIS data are also available from the Data center of
Institut de Physique du Globe, Paris at https://doi.org/10.18715/SEIS.INSIGHT. XB_2016. Meteorology InSight data from the latest acquired sols can be found in the following user-friendly interface at https://mars.nasa.gov/insight/weather/.
Code availability
The Python codes developed to produce the figures directly from the InSight files in the PDS Atmospheres node are available in the online repository at https:// github.com/aymeric-spiga/insight-atmosphere-nature-geoscience.
References
66. Withers, P. & Catling, D. C. Observations of atmospheric tides on Mars at the season and latitude of the Phoenix atmospheric entry. Geophys. Res. Lett. 37, L24204 (2010).
67. Spohn, T. et al. The Heat Flow and Physical Properties Package (HP3) for the InSight Mission. Space Sci. Rev. 214, 96 (2018).
68. Maki, J. N. et al. The color cameras on the InSight lander. Space Sci. Rev. 214, 105 (2018).
69. Torrence, C. & Comp, G. P. A practical guide to wavelet analysis. Bull. Am.
Met. Soc. 79, 61–78 (1998).
70. Forget, F. et al. Remote sensing of surface pressure on Mars with the Mars Express/OMEGA spectrometer: 1. Retrieval method. J. Geophys. Res. Planets
112, E08S15 (2007).
71. Golombek, M. et al. Geology and physical properties investigations by the InSight lander. Space Sci. Rev. 214, 84 (2018).
72. Gossard, E. & Munk, W. On gravity waves in the atmosphere. J. Meteorol. 11, 259–269 (1954).
73. Coleman, T. A. & Knupp, K. R. A nonlinear impedance relation for the surface winds in pressure disturbances. J. Atmos. Sci. 67, 3409–3422 (2010).
Acknowledgements
All co-authors acknowledge NASA, CNES and its partner agencies and institutions (UKSA, SSO, DLR, JPL, IPGP-CNRS, ETHZ, IC and MPS-MPG) and the flight operations team at JPL, CAB, SISMOC, MSDS, IRIS-DMC and PDS for providing InSight data. The members of the InSight engineering and operations teams made the InSight mission possible and their hard work and dedication is acknowledged here. A portion of this research was carried out at the Jet Propulsion Laboratory, California Institute of Technology, under a contract with the National Aeronautics and Space Administration. Additional work was supported by NASA’s InSight Participating Scientist Program. The French co-authors acknowledge the French Space Agency CNES, which funded scientific activities and supported SEIS-related contracts and CNES employees. Additional funding support was provided by Agence Nationale de la Recherche (ANR-14-CE36-0012-02 SIMARS and ANR-19-CE31-0008-08 MAGIS). Atmospheric modelling used HPC resources of CINES (Centre Informatique National de l’Enseignement Supérieur) under the allocations A0040110391 and A0060110391 attributed by GENCI (Grand Equipement National de Calcul Intensif). The Spanish co-authors acknowledge funding by the Centro de Desarrollo Tecnológico e Industrial (CDTI), Ministerio de Economía y Competitividad and the Instituto Nacional de Técnica Aeroespacial (INTA). The Swiss co-authors acknowledge funding by the Swiss National Science Foundation (SNF-ANR project 157133) and the Swiss State Secretariat for Education, Research and Innovation (SEFRI project MarsQuake Service-Preparatory Phase). The UK co-authors acknowledge funding by the UK Space Agency. This paper is InSight Contribution Number 103.
Author contributions
D.B. and A.S. equally led the investigations described here within the InSight Atmospheres Science Theme Group, carried out the analysis reported in this paper on all topics, submitted event request proposals related to atmospheric science and wrote the paper. C.N., F.F., D.V.-M., E.M. and S.R.L. analysed InSight meteorological data to support the large-scale weather studies. M.L, R.L., J.N.M. and A. Määttänen analysed InSight imaging and solar array data to support the dust aerosol and cloud studies. N.M., J.P.-G., R.F.G., L.M., B.K., L.R., R.W.-S., D.M. and K.H. analysed InSight meteorological data to support turbulence, gravity-wave and infrasound studies. P.L., N.T., T.K., J.B.M., A.E.S., T.W., W.T.P. and E.B. analysed InSight seismic data and submitted event request proposals to support the atmospheric science studies, especially related to turbulence. O.K. and B.V.H. analysed InSight EDL data to retrieve the entry profile. J.C., S.C.S., S.C. and D.G. routinely analysed InSight seismic and pressure data within the Mars Quake Service to detect atmospheric events. C.P., S.R., I.D., A.J. and A. Lucas analysed HiRISE images to support the dust devil tracks studies. N.T.M. and T.S. analysed InSight radiometer surface temperature measurements to support the atmospheric science studies. C.C., M.G., M.B. and V.A. analysed InSight imaging and wind data to support aeolian science studies. C.L.J., A. Mittelholz and C.T.R. analysed InSight magnetometer data to support studies of the atmosphere-induced magnetic signatures. L.M.-S., S.N., J.T., A. Lepinette, A. Molina., M.M.-J., J.G.-E., V.P. and J.-A.R.-M. produced the wind and temperature data from TWINS raw measurements and provided guidance on interpreting these measurements. B.T.C. and S.S. built the Mars Weather Service interface used by the team to explore the InSight meteorological data. W.B.B. and S.E.S. lead the InSight mission and helped to place this study in the broader context of the whole InSight mission. All authors contributed to the investigations, manipulated part of the InSight data reported in this paper and provided comments in the process of writing this paper.
Competing interests
The authors declare no competing interests.
Additional information
Extended data is available for this paper at https://doi.org/10.1038/s41561-020-0534-0.
Correspondence and requests for materials should be addressed to D.B. or A.S. Peer review information Primary Handling Editor: Stefan Lachowycz. Reprints and permissions information is available at www.nature.com/reprints.
Extended Data Fig. 1 | Location of the InSight landing site on Mars, along with other landers and rovers having operated at the surface of Mars.
Extended Data Fig. 2 | Correspondence between InSight sols and solar longitude Ls for the first 200 sols of the InSight mission. Further details on solar