Economic Development in Canadian Peripheral Regions,
1971 to 1996
A Statistical Overview
by Richard Shearmur
INRS-Urbanisation, Culture et Société
in collaboration with Mario Polèse, INRS-UCS
joint INRS (Montreal) and ICRDR (Moncton) project
Contents
Executive summary
List of tables, figures and maps
1- Introduction
2- Data, methodology and basic concepts
3- Geographic trends: total employment and total population
4- Geographic trends: economic sectors
5- Geographic trends: socio-economic indicators
6- Typology and evolution of Canadian regions: cluster analysis all
sectors
7- Typology and evolution of Canadian regions: cluster analysis
primary and first transformation sectors
8- Constituents of income per capita in Canadian regions
9- Multivariate analyses of key indicators
10- Conclusions
Executive summary
This report presents a statistical analysis of the Canadian space economy based upon a geographic subdivision of the territory into 382 distinct units, and data for 142 distinct economic sectors and a variety of socio-economic indicators. The period of study is 1971 to 1996, and the data are derived from Statistics Canada censuses. The following principal conclusions emerge:
1- Long term trend towards the metropolisation of economic activity
There is a systematic tendency for employment to concentrate in and around large metropolitan areas. The only peripheral areas which are showing reasonable levels of growth are some of the larger urban areas which are themselves regional centres. Especially over the 1981 to 1996 period, metropolisation is identifiable in the west as well as the east; though certain peripheral areas in western Canada are growing faster than eastern ones, the western metropolitan areas are growing faster still.
2- People are more mobile in some areas (Saskatchewan and Manitoba) than others (Quebec, northern New Brunswick, Newfoundland)
Population growth and decline does not follow the same pattern as employment. In some areas, most notably Saskatchewan and Manitoba, population loss has paralleled employment loss, leading to the somewhat paradoxical situation that these areas, which have the poorest employment growth over the 25 year period of study, currently have some of the highest labour force participation rates. In other areas, particularly Quebec, northern New Brunswick and Newfoundland, similar employment decline has not been accompanied by commensurate population decline: this lack of propensity to migrate has led to very low rates of labour force participation.
3- Economic trends impact different peripheral populations differently
From points 1 and 2 it can be seen that there are two different logics at work: i) the metropolisation of economic activity, which is observed across Canada; and
ii) population decline, which is far more closely linked to provincial - and we suspect to cultural - factors than to the central/peripheral dichotomy. In other words, the problems faced by peripheral areas differ between peripheral areas, but not because the economic trends are dissimilar: the differences are due to the characteristics of the populations subjected to these trends and to differences in provincial (and local) policies.
4- Relatively high (and rising) incomes in peripheral urban areas; signs of social polarisation within metropolitan areas.
There is - in general - no major income problem in peripheral areas. Perhaps because the unemployed tend to migrate towards metropolitan areas, and because high wages are paid to many of those in work in peripheral areas, earned income per worker (or wages) are actually higher in some peripheral urban areas than in central ones. In addition, there is every indication that the transfer system is redistributing income from the wealthier to the poorer areas, and that this redistributive function has increased between 1971 and 1996.
A corollary of this remark is that a contrasted socio-economic picture emerges in metropolitan areas: high and low education levels are observed there, and labour force participation rates have dropped markedly since 1981. In other words, high average incomes and education levels mask large disparities within metropolitan areas: these disparities may be due, in part, to difficulties encountered by inward migrants (whether internal or international).
5- Peripheral areas are not low cost locations
A consequence of the above remarks is that peripheral areas cannot, in general, be considered low-cost locations. Quite apart from the costs associated with distance (freight, air-travel, time) which we have not covered in this report, high labour cost relative to similar urban areas close to large metropolitan areas is a further cost disincentive for the location of economic activity.
6- Probable importance of proximity to US border
The importance of proximity to markets underlies the trend towards metropolisation, but metropolitan areas are not the only markets: with growing cross-border trade, US markets are playing an ever increasing role in Canada's economic geography, a role which was evident in the nineteenth century prior to implementation of the national policy (Pomfret, 1981). Although this has not been tested statistically, it appears from our analysis and from observation of the maps that peripheral areas closer to US markets (southern Nova Scotia, New Brunswick), and indeed rural areas in Quebec and Ontario which benefit from both metropolitan and US proximity, are either growing or stabilising: these areas have not faced employment declines as marked as in Newfoundland, Gaspé, Côte-Nord, the eastern Prairies and other more remote peripheral areas. This hypothesis merits further investigation.
7- The difficulty of diversification: inertia of the location of economic activity between 1971 and 1996
A theme which runs through this report is the inertia observed with regards to the spatial distribution of most economic sectors. Between 1971 and 1996 the
relative distribution across space of most sectors has remained unchanged. This does not mean that regional economies have not substantially evolved:
rather, it means that very few regions exhibit trends which differ from those observed for Canada as a whole. For example, it is clear that all regions have undergone rapid tertiarisation of their economies between 1971 and 1996, and that producer services have grown rapidly everywhere: but those regions which in 1971 had a more tertiarised economy tend to have the most tertiarised economies in 1996. Similarly, areas which had most producer services in 1971 have the most producer services in 1996.
This means that areas will tend to grow and decline as the sectors which are located there grow and decline: only in rare circumstances - at least on the basis of our analysis - will an area grow because it has been able to significantly modify its economic base. In other words, if employment is declining in primary
and low value added manufacturing sectors, and if peripheral regions specialise in these sectors, then it is highly probable that peripheral regions will decline. This inertia is evident even if a narrow range of primary and low value added manufacturing industries are analysed: there is minor shifting of economic profiles, but very little evidence of major shifts away from resource based industries towards manufacturing.
Thus, policies of diversification which plan to change an area's economic structure at a rate which differs from that of the overall economy face an uphill struggle. This means that the relative position of regions will tend to remain unchanged, despite sometimes considerable absolute changes. However, diversification and other structural policies which accompany regional economies as they adapt to changing overall economic structures may be more viable.
Tables, figures, maps and annexes
note: Figures and maps are placed at the end of the section in which they are first referred to.
Most tables are inserted in the text. Those which aren't are placed at the end of the section in which they are first referred to.
Tables:
Table 1: Growth rates and total employment over the synthetic regions, 1971 to 1996, p18
Table 2: Growth rates and total population over the synthetic regions, 1971 to 1996, p23
Table 3a: Location quotients in SRs, 18 sectors, 1971 and 1996, page 47 Table 3b: Growth index in aggregated SRs, 1971=1, 1971 to 1996, page 49 Table 4: Decomposition of growth rate, 18 sectors, 1971 to 1981 and 1981 to
1996, p37
Table 5: Earned income by worker, index 100=large metro areas, p58 Table 6: Summary industrial profile of each cluster, p72
Table 7: Profile of clusters (mean location quotient of SUs in each cluster), p73 Table 8: Cross-tabulation of 1996 clusters with synthetic regions, p75
Table 9: Cross-tabulation of 1996 clusters with provinces, p77 Table 10: Cross-tabulation of 1996 clusters with 1971 clusters, p78 Table 11: The 18 primary and first transformation sectors, p82
Table 13: Summary primary and first transformation profiles, 1996, p83
Table 14: Profile of clusters (mean location quotient of SUs in each cluster), p84 Table 15: Cross tabulation of primary and transformation clusters with synthetic
regions, p86
Table 16: Cross-tabulation of primary and transformation clusters with provinces,
p87
Table 17: Cross tabulation of 1996 and 1971 clusters, p88 Table 18: Profile of income clusters, 1996, p93
Table 19: Cross tabulation of income clusters with synthetic regions, 1996, p94 Table 20: Cross tabulation of income clusters with provinces, 1996, p94
Table 21: ANOVA analysis of employment growth, 1981-1996, p99 Table 22: ANOVA analysis of earned income per worker, 1996, p100 Table 23: ANOVA analysis of labour force participation rates, 1996, p100
Maps:
Map 0: Centre-periphery Divisions and Urban Centres, Canada, page 17 Map 1: Total Employment growth, 1971-1981, page 24
Map 2: Total Employment growth, 1981-1996, page 24 Map 3: Population growth, 1971-1981, page 25
Map 4: Population growth, 1981-1996, page 25
Map 5a: Labour force participation rate, 1996, page 64
Map 5b: Change in labour force participation rate, 1981-1996, page 64 Map 6: Clusters 1996. 18 sector subdivision of whole economy, page 81
Map 7: Clusters, 1996. 18 primary and LVA manufacturing sectors, page 90
Map 8: Clusters 1996. by work income, participation rate, population of active age, page 97
Figures:
Figure 1: Proportion of females in the workforce, 1971-1996, page 25 Figure 2: Percentage of the population below 15 years of age, page 25
Figure 3a: Concentration of primary sector employment in SRs, 1971 and 1996,
page 40
Figure 3b: Primary sector employment growth, 1971-1996, page 40
Figure 4a: Concentration of LVA employment in SRs, 1971 and 1996, page 41 Figure 4b: LVA employment growth, 1971-1996, page 41
Figure 5a: Concentration of MVA employment in SRs, 1971 and 1996, page 42 Figure 5b: MVA employment growth, 1971-1996, page 42
Figure 6a: Concentration of HVA employment in SRs, 1971 and 1996, page 43 Figure 6b: HVA employment growth, 1971-1996, page 43
Figure 7a: Concentration of wholesale employment in SRs, 1971 and 1996,
page 44
Figure 8a: Concentration of hotels etc. employment in SRs, 1971 and 1996, page
45
Figure 8b: Hotels etc. employment growth, 1971-1996, page 45
Figure 9a: Concentration of high-tech producer services employment in SRs, 1971 and 1996, page 46
Figure 9b: High-tech producer service employment growth, 1971-1996, page 46 Figure 10: Total population, page 65
Figure 11: Proportion of population under 15 years in SRs, 1971 to 1996, page
66
Figure 12: Proportion of population over 65, 1971 to 1996, page 66
Figure 13: Proportion of population between 25 and 54, 1971 to 1996, page 67 Figure 14: Ratio of under 15s and over 65s to total population, 1971 to 1996,
page 67
Figure 15: Labour force participation rate, 1971 to 1996, page 68
Figure 16: Earned (work) income and total income per capita, 1996, page 69 Figure 17: Earned (work) income and total income per capita, 1971, page 69 Figure 18: Percentage of population 15 years and older with university degree,
1971 to 1996, page 70
Figure 19: Percentage of population 15 years and older with less than grade 9 education, 1971 to 1996, page 70
Figure 20: Percentage of population 15 years and older with scientific qualifications, 1991 and 1996, page 71
Figure 21: Percentage of population 15 years and older with technical qualifications, 1991 and 1996, page 71
Annexes:
Annex 1: Definition of CMA and CA, page 109
Annex 2: 142 sectors, 18 sector aggregation, Canadian employment and growth rates, page 110
Annex 3: 18 sector aggregation: Canadian employment and growth rates, page
114
PART I
1. Introduction Context
In November 2000 Economic Development Canada gave INRS the mandate of co-ordinating a research programme, conducted in conjunction with ICRDR (Institut Canadien de Recherche en Développement Régional), aimed at synthesising the current state of knowledge on the economies of peripheral regions. The programme is structured around three principal axes. The first of these is a detailed statistical analysis aimed at describing the spatial dynamics of Canada's economy, with some particular attention paid to regions in Quebec and Atlantic Canada. The second axis consists of detailed studies of a selection of peripheral regions in Quebec and Atlantic Canada. The aim of these studies is to obtain an in-depth understanding of the situation in each region - with particular emphasis on policy interventions and on the activities of local actors - , and to complement the broad-brush statistical approach.
The last axis consists of comparisons at the international scale. It consists of two parts. On the one hand, a workshop taking place in mid-October 2001 which will gather specialists from Canada, Finland, Norway, Scotland and Sweden. On the other, a literature review, completed in April 2001.
This document presents the results of our statistical analysis of the Canadian space economy and of the trends observed over the 1971 to 1996 period.
Document structure
The document is divided into three principal parts. The two introductory sections form the first part, in which the study's structure is detailed and the data, methodology and concepts introduced.
The following sections, sections 3, 4 and 5, present our analysis of the Canadian space economy and detail most of the important trends identified during the course of our research.
The third part, sections 6, 7, 8 and 9, mirrors the second part but uses multivariate methods that test some of the basic assumptions (particularly those regarding the spatial sub-division of Canadian territory) and that enable aggregates to be explored (such as the regional distribution of economic profiles) as opposed to single variables (such as the distribution of, say, the primary sector). Since broad conclusions in both parts corresponds, the third section serves to reinforce and deepen the analysis in part 2. Our overall conclusions are summarised in section 10.
2. Data, methodology and basic concepts 2.1 Data
A unique database has been constructed from census data in order to enable this detailed analysis of spatial trends in the Canadian economy. The data are unique because they combine three characteristics.
First, they cover the 1971 to 1996 period (data are available for 1971, 1981, 1991 and 1996), and are comparable both in terms of geographic boundaries and in terms of variable definitions over this period. Thus, they enable trends to be analysed over the long term.
Second, the level of geographic detail is high. Canada is divided into 382 distinct geographic units. Furthermore, these units distinguish between urbanised (CMAs, CAs and CSDs of over 10,000 inhabitants1) and non-urbanised areas. Third, the number of variables available for analysis is high. The database comprises employment numbers for 142 distinct economic sectors (see annex 2) crossed with 6 occupational categories, and the entire 2B census profile (approximately 200 variables, depending on the year) for each of the 382 spatial units.
2.1.1 Geography
Two 'geographies' have been combined in order to arrive at the 382 distinct geographic units. On the one hand, the 152 urban areas (25 CMAs, 115 CAs and 12 CSDs2) with over 10,000 inhabitants in 1991 have been identified according the 1991 boundaries. All data for 1971, 1981 and 1996 have been adjusted to these urban boundaries. On the other, data covering the entire territory of Canada by 1991 Census Division (290 census divisions (CDs)) have been obtained. All data for 1971, 1981 and 1996 have been adjusted to these territorial boundaries.
1 1991 population figures have been used to select urban areas
To create a single database data the urban areas have been subtracted3 from data for the CDs within which they are located. In cases when an urban area overlaps a number of CDs, the CDs were first aggregated, and the urban area variables subtracted from the values for the aggregated area. The result of these geographic operations is a total of 382 distinct spatial units (SUs), 152 of which are 'urban' and 230 of which are 'rural' (Map 0).
2.1.2 Variables
Two separate sets of data are combined in this analysis. On the one hand detailed employment data, on the other data from 2B census profiles (socio-economic data).
The employment data for 1971 to 1991 were obtained prior to this project by Coffey and Polèse, and various analyses have been conducted (eg: Coffey and Shearmur, 1996; Polèse et Roy, 1999), though none which focussed upon development in outlying regions. The data were selected according to the 1970 Standard Industrial Classification (SIC) codes and the 1971 Standard Occupational Classification (SOC): 161 economic sectors and seven classes of occupation (including one undefined) were obtained. In the context of this study the data were updated to include the 1996 data, defined according to the 1981 SIC and 1991 SOC codes.
In order to make the economic sectors compatible, it has been necessary to aggregate some of the 1971 to 1991 sectors: the result is that there are 142 compatible sectors which can be analysed from 1971 to 1996. It has not been possible to adjust the occupational classification in this way since the 1991 SOC is radically different from the 1971 SOC. For this reason, no attempt has been made to ensure strict comparability: indeed, by 1991 the 1971 SOC was outdated, so the shifts observed between 1991 and 1996 in our data (particularly for some white collar occupations) are a necessary correction. In terms of
3
All data have been transformed into additive variables. For instance, average earned income has been multiplied by number of people with earned income. Some variables - in particular values for median income - cannot be treated in this way.
occupations we therefore have 6 occupations4 covering the 1971 to 1996 period, with a shift between 1991 and 1996 corresponding to the reclassification of some activities.
2.2 Some definitions
In the analyses which follow, a number of key concepts are used. They are defined as follows (see also map 0):
Metropolitan area: a CMA of over 500,000 inhabitants in 1991.
Urban area: a CMA, CA or CSD of over 10,000 inhabitants in 1991. It should be noted that Statistics Canada define a CMA and a CA as a group of adjacent municipalities with a high degree of social and economic integration (see annex 1).
Rural areas: all areas which are not urban areas. It should be noted that rural areas can contain towns, but these are necessarily smaller than 10,000 inhabitants.
Central areas: all areas within approximately 1 hour's drive (or 100 to 150 km) of a metropolitan area. The classification of areas in this way was introduced by Coffey and Polèse (1988) and subsequently used in studies such as Coffey & Shearmur (1996). The 382 areas studied have been classified in this way: account has been taken of the highway infrastucture, the spatial extent of the metropolitan area, and the characteristics of the area being classified. Thus, the central areas do not necessarily form perfect rings around metropolitan areas. It should be noted that the central areas thus define closely mirror the ZMIs (Zones of Metropolitan Influence) which Statistics Canada has introduced for the 2001 census.
Peripheral areas: this term has two slightly different meanings in the context of this study. Its basic meaning is 'all areas not classified as
central or metropolitan'. This is its meaning in most of the following statistical analyses.
It should however be noted that in the context of our wider study for Economic Development Canada, a further constraint is added: in this wider context, a peripheral region does not include any urban area of over 150,000 inhabitants.
These definitions lead to the following classification of geographical areas. The codes correspond to those which are found in the figures and tables.
AM1: metropolitan areas of over 1 million inhabitants
AM2: metropolitan areas of between 500,000 and 999,999 inhabitants AM = AM1 + AM2
AC1: central urban areas of between 100,000 and 499,999 inhabitants AC2: central urban areas of between 50,000 and 99,999 inhabitants AC3: central urban areas of between 25,000 and 49,999 inhabitants AC4: central urban areas of between 10,000 and 24,999 inhabitants
AC = AC1+AC2+AC3+AC4
AP1: peripheral urban areas of between 100,000 and 499,999 inhabitants AP2: peripheral urban areas of between 50,000 and 99,999 inhabitants AP3: peripheral urban areas of between 25,000 and 49,999 inhabitants AP4: peripheral urban areas of between 10,000 and 24,999 inhabitants
AP = AP1+AP2+AP3+AP4 RC: central rural areas
RP: peripheral rural areas
Each of these twelve classes is called a 'synthetic region' (or SR) in the analyses which follow. In a number of tables and figures the sum or mean of a particular variable is calculated across all spatial units within each of the classes: since the SUs over which these calculations are made are not necessarily adjacent, the adjective 'synthetic' is added.
2.3 Methodology
In the following sections, a variety of different approaches are used to analyse these data. The principal aim of these approaches is to understand to what extent key variables (relating to both employment and to socio-economic characteristics) vary over the classes described in section 2.2 above. To this end measures of relative concentration (location quotients) and absolute value - together with their changes - are calculated for spatial units (SUs) classified by centrality and urban size.
There are two ways of doing this. The first is to create 'synthetic regions', for which all data from SUs of a particular class are aggregated. The aggregate data are then compared. Most of the analysis is of this sort. The second is to calculate mean or rank values for each class of SU - in effect using statistics (parametric or not) to compare a given variable over classes. Only in section 9 is this undertaken. However, it should be emphasised that both approaches have been tested, and the overall results of inter-class comparisons remain very similar for most variables whichever the approach: therefore only one type of analysis is presented to make a given point.
As can be surmised, our analysis depends strongly on the a-priori classification of regions (urban/rural and central/periphery). This classification reflects the purpose of the analysis, i.e. to identify the extent to which trends evident in peripheral regions are specific to these regions. However, it is useful to examine whether alternative approaches to classification pick out 'peripheral' regions: in other words, do peripheral regions have something else in common as regions -other than their geographic position relative to metropolitan areas? Sections 6, 7 and 8 apply cluster analysis to data covering overall economic structure, primary and first transformation activities and income structure in order to investigate the extent to which peripheral areas are unique.
Finally, in section 9 some basic multivariate analysis is performed on a selection of key variables to provide some indication of the way in which the various
classification schemes interact. In particular this section seeks to verify that the variation of certain key variables over SRs is not attributable to variation over provincial boundaries or over zones with similar economic profiles.
In each section, some basic details will be given about the nature of the analyses performed, but the emphasis will be on interpreting results. References are given to articles or reports in which the precise methodology is described in detail. At this point, it is important to emphasise that all data are by place of residence. This should be borne in mind when interpreting results since it is quite possible that actual jobs are located in SUs other than the place of residence. We feel that this is of particular relevance to SUs adjacent to metropolitan areas, which are in the RC (rural central) class, and maybe to certain peripheral SUs from which workers seasonally migrate. This caveat does not invalidate our results, but will influence our interpretations and conclusions.
To conclude this brief methodological overview, it is worth pointing out that the report presents the results of exploratory analyses of a vast database. A sizeable proportion of our work so far has consisted in building and validating the database. It is expected that more elaborate hypotheses will be tested in more rigorous ways once the basic trends - as described in this report - are understood.
PART II
3. Geographic trends: total employment and total population
In this section two key variables are analysed in order to describe the trends underlying the development of Canada's space economy over the 1971 to 1996 period. First, total employment is considered, then total population.
For each variable, two approaches are taken. The first approach is based upon 'synthetic regions' (SRs, see section 2.3). The relative growth of the variable in each SR is described. The second approach is based upon the observation of maps of Canada. Whilst not as systematic, such an approach enables spatial variations in the phenomena under study to be described: the visualisation of data is recognised as a key exploratory technique (Fotheringham et al, 2000) in quantitative geography.
3.1 Total employment
Over the 1971 to 1996 period, the fastest growing SR has been AM2 (table 1), the smaller metropolitan areas (102%). Its growth was particularly rapid over the 1971 to 1981 period (70%), but slowed somewhat over the later years (19%).
Table 1: Growth rates and total employment over the synthetic regions, 1971 to 1996
71 to 96 71 to 81 81 to 96 Total 1971 Total 1981 Total 1991 Total 1996
AM1 78% 42% 26% 2770201 3925121 4753927 4 943 655 AM2 102% 70% 19% 750113 1272555 1461678 1 515 890 AC1 69% 35% 25% 801510 1083829 1298346 1 351 390 AC2 83% 44% 27% 246854 356044 432552 451 825 AC3 48% 33% 11% 133369 177384 194658 197 685 AC4 60% 37% 17% 94883 130248 150150 152 065 AP1 71% 41% 21% 577185 812865 953238 987 090 AP2 75% 50% 17% 207837 310893 341535 362 840 AP3 86% 57% 18% 222764 350004 391620 414 210 AP4 52% 41% 7% 175990 248712 260623 267 030 RC 97% 54% 28% 612736 941551 1131518 1 208 080 RP 62% 43% 13% 920053 1320017 1444720 1 493 840
note: for each period, the five fastest growing regions are shown in bold
It is the central rural region (RC), which has grown second fastest over the entire period (97%), and fastest over 1981 to 1996 (28%). Over this latter period, employment growth in the rural fringe of metropolitan areas has been mirrored by growth in large metropolitan areas themselves (AM1: 26%), by growth in the
larger central urban areas (AC1: 25%; AC2: 27%), and by growth in the largest peripheral urban areas (AP1: 21%).
A number of remarks can be made. First, over the latter period, there is a tendency for growth to be faster in large urban areas, and in central areas. In other words, except for the largest peripheral urban areas (those of between 100,000 and 499,999 inhabitants - which are in effect local metropoli), urban and rural areas in the periphery have grown more slowly over the last 15 years. Second, the fastest growing areas are the central rural ones (RC). This may reflect two combined processes: on the one hand, an increase in longer distance commuting towards the metropolitan centres, on the other job creation in these areas.
Over the first period - 1971 to 1981 - the pattern was different. There was a marked tendency for total employment to grow faster in smaller rural urban areas, and the slowest growing SRs were centrally located urban areas. There has thus been a change in overall employment trends across synthetic regions, with peripheral areas and smaller urban units displaying weaker growth over 1981 to 1996.
Maps 1 and 2 provide a visual indication of the growth rates of total employment for the two periods under consideration. From Map 1 it can be seen that over the 1971 to 1981 period there is a marked east-west divide. Most areas to the west of Manitoba display rapid employment growth. In particular the peripheral regions in Alberta, and some of those in Saskatchewan and British Columbia, display relatively rapid rates of growth (of over 50% for the decade). However, it can be noted that some of the fastest growing areas, even in the west, are clustered around large urban areas (for example between Calgary and Edmonton). To the east, there are pockets of very slow growth or decline. In particular these can be found in the maritime provinces, in certain parts of Quebec (Gaspésie, Bas St.Laurent, Côte Nord, the Mauricie), in Northern Ontario and in Northern Manitoba. In addition, the southern parts of Saskatchewan also display slow growth over the period. A final feature of note is the relatively rapid employment
growth in rural areas surrounding Montreal and Toronto, and in some areas extending south east of Montreal along the US border.
Over the 1981 to 1996 period (map 2) a marked difference can be seen. With few exceptions all peripheral areas, whether to the east or to the west, display very slow growth, if not outright decline. This is true in particular in the Maritimes (with the exception of Southern New Brunswick and Nova Scotia around Halifax), in the entire Gaspé peninsula, in certain peripheral areas in Northern Quebec, in Northern Ontario and - very markedly - in most of Saskatchewan and Manitoba. Even in Alberta and British Columbia, despite faster growth rates than in the east, in general it is those areas closer to large metropolitan areas which grow faster than those further away. Whether one looks at St.John's, Halifax, Moncton, Montreal, Toronto, Winnipeg, Regina, Calgary or Vancouver it is the cities themselves or the nearby areas which are displaying the faster growth rates. The few peripheral regions which display rapid growth rates tend to be in the far North or the Territories.
This analysis of trends in total employment illustrates one of our principal results, namely the tendency of economic activity to concentrate in and around larger urban areas: the phenomenon of metropolisation is evident in Canada.
3.2 Total population
Whilst the population growth rates (table 2) differ from those of employment, the general patterns mirror those of total employment. Whereas over the first decade, population rose fastest in the smaller metropolitan areas and in peripheral areas, the subsequent fifteen years witnessed a reversal of the trend with the fastest population increases in the larger central cities. In addition, it is the rural areas surrounding large metropolitan areas (RC) which have benefited from the substantially faster population growth over 1981-1996 than peripheral rural areas (RP): in these areas population growth has been extremely low over the entire period of study.
This reminds us of the discrepancy - particularly in rural areas - between rapid growth in employment (at least for certain periods) and very slow growth in population.
Table 2: Growth rates and total population over the synthetic regions, 1971 to 1996
71 to 96 71 to 81 81 to 96 Total 1971 Total 1981 Total 1991 Total 1996
AM1 42% 10% 29% 7 179 370 7 929 750 9 450 425 10 212 905 AM2 48% 25% 19% 2 010 630 2 505 945 2 863 740 2 984 085 AC1 34% 10% 21% 2 129 235 2 350 825 2 695 880 2 855 155 AC2 42% 14% 25% 690 135 786 440 920 745 980 590 AC3 17% 8% 8% 382 995 412 850 435 505 447 845 AC4 29% 10% 16% 269 865 298 050 333 540 346 860 AP1 28% 12% 14% 1 671 220 1 864 260 2 061 480 2 132 680 AP2 34% 18% 13% 588 785 695 220 750 390 787 875 AP3 35% 21% 12% 702 830 847 440 902 890 945 795 AP4 13% 9% 4% 529 035 577 385 585 115 598 565 RC 28% 10% 16% 2 027 225 2 236 700 2 435 275 2 593 440 RP 8% 6% 2% 3 386 930 3 578 530 3 558 815 3 642 220 Our analysis shows that this could be due to a number of factors, of which two stand out. At the beginning of the period a very small proportion of the workforce - particularly in rural areas - was female. This proportion rose far more rapidly in rural areas than in urban ones, the proportion for all SRs showing a tendency to converge (figure 1). Thus, for a modest rise in population a rapid rise in employment is possible, particularly in rural areas. The second explanation is demographic. There has been a rise in the proportion of working age population over the period studied, and a decline in the proportion of the total population below the age of 15 (figure 2). This demographic shift has been more marked in rural areas. These two factors combine to explain the differences between population and employment growth rates.
However, these explanations also underline the fact that rural peripheral areas are growing more slowly than others. Indeed, despite the fact that both these factors (feminisation and decrease in population under 15) tend to accelerate employment growth rates (to the extent that they accelerate the growth in active working age people) the slow employment growth in rural areas over the last fifteen years (relative to growth in other SRs) is all the more significant.
The map of population growth rates for the 1971 to 1981 period reveals an east west divide similar to that observed for employment growth (map 3). However, unlike for employment - where growth is observed in most areas over the period, population decline can be observed in southern Saskatchewan and Manitoba, in Northern Ontario, in most of Quebec outside the central areas and in certain parts of the Atlantic provinces (northern New Brunswick, North western Nova Scotia and central and western Newfoundland). The provinces of Alberta and British Columbia display fast population growth over the decade in most areas. Between 1981 and 1996, the map of population loss stays broadly similar, though more areas are affected (map 4): almost every area east of Montreal, with the exception of southern New Brunswick and central Nova Scotia has experienced population decline over the period. In fact the only zones of systematic population growth in eastern Canada are those lying between Montreal and Windsor: these are areas classified as central or metropolitan. To the west population decline is evident in Northern Ontario, and in most of Manitoba and Saskatchewan. The peripheral areas of British Columbia and Alberta, whilst fairing better than their eastern counterparts, only display modest growth relative to the urban and central areas in the provinces.
3.3 Conclusion
From the perspective of peripheral areas, whether urban or rural, the trends identified in this section are negative. There is clear evidence that between 1981 and 1996 these areas have suffered from employment growth at rates well below central and metropolitan areas. In addition, population decline is evident from 1971 onwards, and has intensified since 1981. The low positive rates of population growth exhibited in table 2 for rural peripheral areas reflect the growth occurring in rural areas surrounding peripheral centres such as Halifax and Moncton, and that occurring in some isolated rural peripheral areas elsewhere. In section 4 the evolution of the synthetic regions' economic structure will be analysed.
Figure 1: Proportion of females in the workforce, 1971-1996 % difference with average for metropolitan areas
-35.0 -30.0 -25.0 -20.0 -15.0 -10.0 -5.0 0.0
ac1 ac2 ac3 ac4 ap1 ap2 ap3 ap4 rc rp
1971 1981 1991 1996
NOTE:
These results are derived from regression analysis and therefore it is mean values over all SUs in each SR which are the basis for this figure.
The regression technique has enabled these results to be controlled for region (Atlantic, Quebec, Ontario, Prairies, Alberta, BC and Territories),
Figure 2: Percentage of the population below 15 years of age
19.0% 21.0% 23.0% 25.0% 27.0% 29.0% 31.0% 33.0% 35.0% 1970 1975 1980 1985 1990 1995 2000 AM1 AM2 AC1 AC2 AC3 AC4 AP1 AP2 AP3 AP4 RC RP CAN
4. Geographic trends: economic sectors
As overall employment in many outlying regions declines, it is useful to examine the nature of their economies in relation to the wider economy. In this section we therefore identify the economic sectors which predominate in each type of synthetic region, and assess whether these regions are increasing or decreasing their economic specialisation in each sector.
To do this we have aggregated the 142 sectors available for analysis into 18 economic sectors (annexes 2 and 3). This classification is based upon the 15 sector classification used by Coffey & Shearmur (1996) but with a more detailed subdivision of manufacturing (3 sectors instead of 1) and producer services (2 sectors instead of 1).
The approach used is sectoral. In other words, each sector is analysed in order to assess in which type of synthetic region it tends to locate. To do this, location quotients are calculated for each sector in each SR. The analysis is not based upon mean values of the location quotients but on location quotients calculated for each SR in its entirety. Thus:
E E e e LQ x n i a i n i a xi xa =
∑
=1∑
=1 where xaLQ = location quotient of sector x in synthetic region a
n = number of spatial units in synthetic region a
xi
e = employment in sector x in spatial unit i i
e = total employment in sector x in spatial unit i x
E = total employment in sector x in Canada E = total employment in Canada
It should be noted that the analysis of mean and rank values gives similar results to those presented below. When interpreting the results, the following should be borne in mind:
• it is possible for LQs to rise in an SR even when overall employment is falling,
and it is possible for LQs to fall when overall employment rises. LQs measure the relative concentration of employment. Thus, a high and rising LQ indicates that the SR has a higher % of employment in the sector than other SRs (high LQ), and that this % is rising faster than in other SRs (rising LQ).
• an increase in a sector's LQ can be due to faster employment growth in the sector or to slower employment decline - relative to the rest of employment in
the SR. Thus, if there is a marked rise in the concentration of retail
employment in urban peripheral regions this could either mean that retail employment has grown faster there than employment in other sectors or that other sectors have declined faster than retail.
• for these two reasons, variation in location quotients should always be
interpreted together with sectoral growth rates.
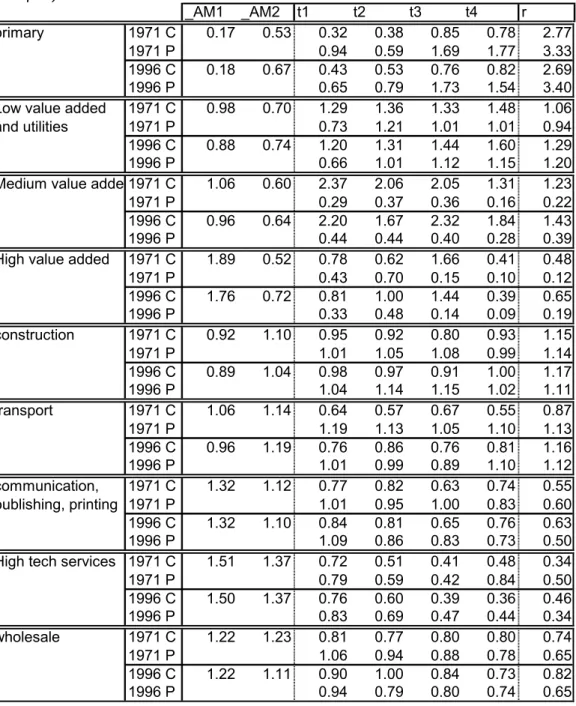
4.1 Economic sectors in peripheral regions
Bearing in mind the concentration of certain manufacturing and primary industries in peripheral regions (this is confirmed by our analysis of the 18 sectors), four sectors will be examined closely (primary sector, low , medium and high value added manufacturing). In addition, wholesale, hospitality trade and high order services will also be examined since they are often considered as possible means whereby peripheral regions may turn round their economies (in particular by way of tourism and/or the attraction of footloose services relying on internet). Results for all 18 sectors are presented in tabular form (table 3a (location quotients) and table 3b (growth index)) but the remaining sectors will only be commented upon briefly.
4.2 Goods producing sectors 4.2.1 The primary sector
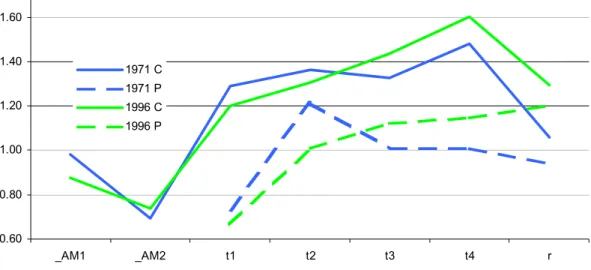
This sector comprises forestry, fishing, resource extraction and agriculture. Figure 3a shows the concentration (location quotient) of this sector over the 12 SRs. Since this type of figure will be presented for all other sectors analysed, it is worth explaining it here.
The vertical axis of figure 3a is a measure of relative concentration, the location quotient (LQ). If the LQ has a value greater than 1 for a given SR then this SR tends to have higher concentrations of the sector under study (in this case the primary sector) than the Canadian economy as a whole. Conversely, a value below one indicates that the sector is underrepresented in the SR relative to the rest of Canada.
Along the horizontal axis are identifiers for the various SRs. All urban areas (including metropolitan areas) are ordered from left to right by decreasing size. In this way it can be seen whether the concentration of any given sector (in this case the primary sector) increases or decreases with urban size. At the right of this scale is the identifier for rural areas, r.
It will be noted that the horizontal axis does not distinguish between peripheral and central SRs. The central (including the metro areas) SRs are graphed separately from the peripheral ones, enabling one to see whether urban size has a similar effect in peripheral and central areas. Thus, figure 3a has four curves. One curve (labeled 1971 C) represents location quotients for central SRs in 1971; another (labeled 1971 P) represents location quotients for peripheral SRs in 1971. The two remaining curves, 1996 C and 1996 P display the same variables for 1996.
It can be seen from figure 3a that the concentration of employment in primary sectors increases steadily as urban size decreases. Rural areas are very heavily dependent on employment in this sector, with 2,5 to 3,5 times the concentration of the Canadian economy. The peripheral curves are systematically above the central curves, indicating that peripheral areas are more heavily dependent upon primary sector employment than areas close to large metropolitan areas. Indeed there is not one central urban SR which has an LQ above 1. In peripheral SRs, it is the smallest urban areas (below 25,000) and the rural areas which are most heavily dependent.
One of the most striking features of figure 3a is the similarity between the 1971 and the 1996 graphs. This indicates that despite profound economic restructuring
that has been observed between 1971 and 1996, the relative distribution of employment in the primary sector has remained on the whole unchanged across the SRs.
This statement can be qualified by observing figure 3b. Notwithstanding the overall stability noted above, it can be seen that employment growth in primary sector employment has been more rapid in all central areas, whereas it has stagnated since 1981 in all peripheral areas. This is an indication that within many resource industries managerial and head office activities (usually located centrally) are growing relative to the actual extraction work.
In sum, it can be said that the reliance of peripheral areas upon primary activities has remained unchanged over the last 25 years. However, this statement (which is about relative concentration) masks the fact that in a context of overall economic stagnation and decline in peripheral regions (see section 2), similar
relative concentration over 25 years signifies absolute stagnation and decline.
4.2.2 Low value added manufacturing (LVA)
This sector comprises all first and some second transformation manufacturing industries principally in the food, wood, metal or clothing industries. The location and growth of these sectors across SRs is particularly important since there are many calls for attracting transformation industries to resource-based regions as a means of compensating for the declining primary sector.
The first remark to be made about figure 4a is its different scale from figure 3a (primary sector): indeed, the extreme values are far closer indicating a more even distribution of employment across the SRs.
In general, there is a tendency for first transformation industries to concentrate in small central urban areas, and this is true in 1971 and 1996. Rural central areas also have high concentrations of employment in this sector, a concentration which in 1996 exceeds the highest value for peripheral areas.
Unlike employment in the primary sector, the relative distribution of employment across SRs for LVA has evolved somewhat between 1971 and 1996. There has
been a shift away from larger urban SRs to smaller ones and to rural areas, both in central and peripheral areas. There has also been a shift away from large metropolitan areas.
This can be observed in figure 4b, where it can be seen that central rural areas have grown the fastest between 1971 and 1996, and are the only areas where LVA employment has not declined markedly since 1981. Peripheral rural areas, after rapid growth during the seventies, have suffered a decline as precipitous as all other areas (except central rural areas) since 1981.
These observations do not lend credence to the aim of attracting transformation industries to peripheral resource dependent regions: indeed, the evidence suggests that, within a context of overall sectoral decline LVA employment is gathering in small towns and rural areas surrounding major metropolitan areas. 4.2.3 Medium value added manufacturing (MVA)
This sector comprises certain second and third transformation manufacturing, and the production of finished goods not generally classified as high-tech.
Figure 5a illustrates the overwhelming tendency for MVA employment to locate in large urban areas close to metropolitan areas. There is a certain tendency for MVA employment to increasingly concentrate in smaller (but still central) urban areas and in central rural areas. However, with location quotients of around 2 in all central urban areas, the contrast is striking with peripheral urban areas where location quotients are around 0,45 irrespective of size. It can be noted, however, that since location quotients in peripheral areas were systematically lower in 1971 than in 1996, there is a tendency - albeit one which does nothing to overturn the broader picture - for MVA employment to increase its concentration in peripheral areas.
This is confirmed by considering figure 5b. The fastest growth in MVA employment (albeit from a small base) is in peripheral rural areas; the growth in central rural areas is only slightly slower (but larger in terms of absolute numbers), as is that in peripheral urban areas. Thus the increase in
concentration is not due to slower decline than the rest of the peripheral economy but to employment growth in these sectors.
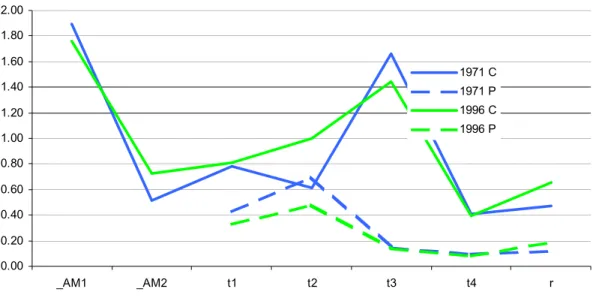
4.2.4 High value added manufacturing (HVA)
This sector comprises sectors commonly referred to has 'high-tech' manufacturing (aeronautics, telecommunications and electronic equipment, office machines, scientific and professional equipment, pharmaceuticals).
HVA employment is highly concentrated in the largest metropolitan areas, and this has remained broadly unchanged over the 25 year study period (figure 6a). Outside these areas, the concentration of HVA employment increases as one moves to smaller central urban areas, but is very low in the smallest of these (10,000 to 25,000 people) and in central rural areas. It should be noted, however, that between 1971 and 1996 the LQ for HVA employment has increased in rural areas. There are low concentrations of HVA employment in all peripheral SRs: in addition, the LQs for the largest peripheral urban areas have substantially declined between 1971 and 1996.
From figure 6b it can be seen that the fastest growth rates for HVA employment have occurred in rural areas both central and peripheral. It is important to note that even in 1996 neither of these SRs includes over 10,000 HVA jobs. Apart from rural areas it is central urban areas which have registered the fastest growth rates though this tailed off over the recessionary 1991-1996 period. The steady but slower growth of HVA employment in metropolitan areas hides the fact that by far the greatest number of HVA jobs have been added in these SRs. Finally, between 1971 and 1996 there has been no HVA employment growth in peripheral urban areas.
This analysis confirms other studies (Britton, 1996; Shearmur 1997) which emphasise the metropolitan nature of HVA employment.
4.3 Service sectors
In a context of rapid tertiarisation of the economy the evolution of service employment requires analysis as detailed - if not more so - than that of goods
producing employment. In this section three 'key' sectors will be analysed in detail. These sectors illustrate three distinct patterns: the wholesale sector illustrates a dramatic shift from peripheral to central areas, the hospitality sector is an indicator of the distribution of tourist related employment, and high-order services, as the fastest growing and potentially most footloose segment of the economy, provides an indication of the location trends of newer segments of the economy. The remaining service sectors will be discussed together, with full details of concentration and growth rates being presented in tabular form.
4.3.1 Wholesale employment
From figure 7a it can be seen that in the early 1970s high concentrations of wholesale employment could be found in metropolitan areas, and in the larger peripheral urban areas. In other words this type of employment was concentrated towards the top of the urban hierarchy in large national and regional urban centres. In addition, smaller peripheral urban areas tended to have significantly higher concentrations of wholesale employment than their central counterparts. By 1996 this sector's distribution has changed. It remains concentrated in metropolitan areas, but its concentration has increased markedly in central urban areas of between 25,000 and 499,999 inhabitants, as well as in central rural areas. In contrast, all peripheral areas have seen the LQ for wholesale employment drop significantly. The only exception is a small increase in peripheral rural areas. On the whole, then, it can be seen that wholesale employment, which in 1971 was more highly concentrated in larger peripheral urban areas, is, in 1996, more highly concentrated in larger central urban areas. Although employment in the sector has grown over the entire period (figure 7b), growth has been substantially faster in all central areas (particularly in central rural areas) and has been slowest in peripheral urban areas. There has thus been a marked relative shift from the periphery to the centre.
4.3.2 Hospitality sector
This sector comprises employment in hotels, restaurants, bed and breakfasts and camping grounds. Whilst such employment clearly does not constitute all
tourist related employment, and whilst some employment in this sector is unrelated to tourism, we feel that it is a good indicator of trends in tourist related employment, even if it does not provide an accurate idea of the number of jobs involved.
Amongst the sectors analysed so far, the hospitality sector displays the 'flattest' relative concentration across the SRs (figure 8a). Indeed, the maximum LQ is 1.27 (for AP2 urban areas in 1996) and the lowest is 0.91 for AM1 metro areas in 1996). This reflects the fact that the sector remains, basically, a low-order service which, like retail, is fairly evenly distributed across all SRs (see table 3a). Within this narrow range it is notable that between 1971 and 1996 the concentration of hospitality employment has increased in all central SRs except for the very largest agglomerations (where it remains virtually unchanged) and central rural areas. In the periphery there is an increase in the concentration of hospitality employment in the largest urban areas, no change in the smaller ones and a large decrease in concentration in peripheral rural areas.
Employment growth in this sector has been virtually identical in agglomerations in central and peripheral urban areas and in central rural areas (figure 8b). Only in peripheral rural areas has employment increased significantly less than in other SRs. These similar growth rates mask faster growth in larger peripheral urban areas, and slower growth in larger central urban areas.
To the extent that these trends reflect those linked to the tourist trade, it is clear that tourism employment is predominantly an urban and a central phenomenon. Smaller cities in the vicinity of large metropolitan areas are increasing their reliance on the industry, as are the larger peripheral urban areas. The one type of SR which is clearly not benefiting from tourism is the rural periphery - the type of region in which much hope is vested in this industry.
4.3.3 High-tech producer services
This sector comprises computer services, management consulting and engineering and architectural services. In this report these are distinguished from professional services (legal, accounting, advertising...).
These sectors are archetypal high-order services in the Christallerian sense of the term. They are highly concentrated in large metropolitan areas (figure 9a) and this concentration decreases with urban size, stabilising around LQ= 0.4 at city sizes of below 50,000 and in rural areas. This relationship holds over the 25 year study period in central and peripheral areas. From table 3a it can be seen that a very similar pattern holds for professional services, with one difference: central and peripheral rural areas have benefited from an increase in the concentration of professional services. However, the LQ for professional services remains very low in these SRs (below 0.60 in 1996).
Growth in high-tech producer services has been fastest in central rural areas, and faster in all central areas (agglomerations and urban areas) than in peripheral areas (figure 9b). It should be noted that growth rates in this sector are very high: growth of close to 1000% is recorded in central peripheral areas, of over 600% in agglomerations and central urban areas. Even in the slowest growing rural peripheral areas high-tech service employment has grown nearly 400%. Growth in professional services over 1971 to 1996 has been slower (table 3b; around 325%) and though it has been fastest in central rural areas (485%), it has also been fast in peripheral rural areas (385%).
The study of high-order producer services reflects some of the profound structural changes which have operated in the economy over the 1971 to 1996 period. Thus, very high growth rates in all SRs come as no surprise. However, these changes appear to benefit central areas and metropolitan areas more than they do peripheral areas. This is not in contradiction with the fast growth rates recorded in peripheral areas: it is only meant to underscore the even faster growth and rise in concentration recorded in the vicinity of metropolitan areas. 4.3.4 Other service sectors
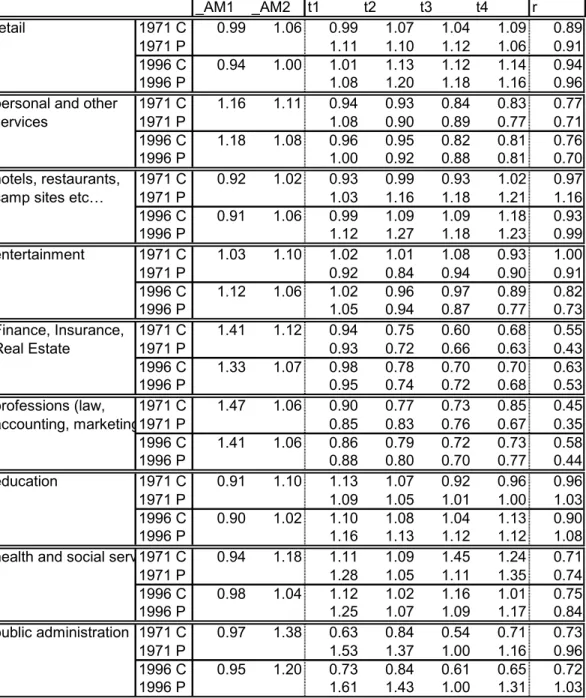
By definition it is not possible for concentration in all sectors to fall in peripheral regions, and we have indeed noted that in some cases rising concentrations are observed. But the overall picture which emerges from the sectors highlighted above is a shift of economic activity away from peripheral areas towards central
areas, and, to some extent, from rural and smaller settlements towards larger ones. The question which this last section on services will address is the following: amongst the 18 sectors studied are there any which go against the trend?
One notable exception - but one which nevertheless confirms the overall trend - is retail employment. Indeed, over the 25 year period the concentration of retail in all peripheral areas (except for the largest urban areas) has significantly increased. This is also true to some extent in the entertainment sector - especially for smaller peripheral areas: this may therefore be a more positive indicator for tourism. A final sector for which this is true across the board is education: whereas in health and social security and in public sector employment there has been either no movement or a decline in concentration in peripheral areas, in the education sector there has been an across-the-board increase in all peripheral areas. These sectors for which concentration has risen in peripheral areas all have a large low-order component: in other words, they tend to be non-exportable sectors which primarily serve the local population. Their rise in concentration may be due to the decline in other sectors rather than to any particular vigour in the sectors themselves.
In terms of employment growth, the fastest growing SR in almost all sectors is central rural areas (table 3b). Although peripheral areas do not systematically display slow growth in all sectors, they rarely grow faster than their more central counterparts.
Thus, the only sectors which are significantly increasing their concentration in peripheral areas are service related ones, in particular retail and education. To a lesser extent this is also true for hospitality employment (in the larger peripheral urban areas) and leisure related employment (in the smaller peripheral urban areas). FIRE and professional services employment are, somewhat surprisingly, increasing their concentration - and growing quite fast - in rural peripheral locations: we hypothesise that this is related to the move of certain categories of
professional worker to rural communities adjacent to the larger peripheral urban areas (such as Halifax, Moncton and Regina).
In sum, however, the service sectors which are increasingly concentrated in peripheral areas fall into two categories: low order services and public sector employment.
4.4 Decomposition of growth rates into constituent parts
Before concluding this section, the results of an analysis which decomposes employment growth rates of the 12 synthetic regions will be presented (table 4). This analysis has been conducted on the basis of the 18 sectors classification of economic activity described above, and is very similar to shift-share analysis. The aim of the analysis is to answer the following question: to what extent is employment growth in a given SR attributable to industrial structure? In order to do this, growth in total employment is disaggregated in the following way:
a i i c i ci i i i c a g e eg g e R G + − + =
∑
∑
∑
= = = 18 1 18 1 18 1 where: aG = total employment growth in synthetic region a over period of study c
g = % employment growth Canada over period of study i
e = employment in sector i in synthetic region a at the beginning of the period ci
g = % employment growth in sector i in Canada over period of study a
R = residual employment growth in synthetic region a, or local growth.
If the equation is divided through by employment in region a at the beginning of
the period (
∑
= 18 1 i ie ) then it can be expressed in terms of growth rates:
r s c a g g g g = + + where: a
g = % employment growth in the synthetic region a over period of study c
g = national component (% employment growth Canada over period of study) s
g = sectoral component (% employment growth in region had all sectors grown
r
g = residual component (% employment growth explained neither by national
growth or by sectoral growth).
Table 4 presents the growth rates for the sectoral components, gs , for the local component, gr, and for total growth, ga , for the periods 1971 to 1981, and 1981 to 1996. If gs is positive it indicates that, given the SR's industrial structure at the beginning of the period and the subsequent growth rates in each sector, employment in the SR could be expected to grow faster than the growth rate of the Canadian economy. If gr is positive, it indicates that the SR's actual growth over the period was faster than its initial sectoral mix would have led one to expect.
Table 4: Decomposition of growth rate, 18 sectors, 1971 to 1981 and 1981 to 1996
gs, sectoral component gr , local component ga , actual growth 71 to 81 81 to 96 71 to 81 81 to 96 71 to 81 81 to 96 AM1 -3,1% -0,3% -3,9% 0,5% 41,7% 25,9% AM2 -2,2% -0,3% 23,2% -6,4% 69,6% 19,1% AC1 -5,4% -4,3% -8,1% 3,3% 35,2% 24,7% AC2 -5,9% -5,4% 1,4% 6,6% 44,2% 26,9% AC3 -5,9% -6,3% -9,9% -8,0% 33,0% 11,4% AC4 -6,1% -7,3% -5,3% -1,7% 37,3% 16,8% RC -3,0% -10,4% 7,9% 12,9% 53,7% 28,3% AP1 -2,7% -1,6% -5,2% -2,8% 40,8% 21,4% AP2 -4,7% -4,7% 5,6% -4,3% 49,6% 16,7% AP3 -2,9% -5,1% 11,3% -2,3% 57,1% 18,3% AP4 -2,8% -5,3% -4,6% -13,1% 41,3% 7,4% RP -1,7% -10,7% -3,6% -1,9% 43,5% 13,2%
The negative values of gs over both periods are evidence of the economic restructuring that has occurred. Sectors which were prevalent in 1971 (such as LVA manufacturing) have tended to grow slowly or decline, and new sectors, largely absent from the sectoral mix in the earlier years (such as high order services) have grown. It is therefore interesting to see that metropolitan areas have a near zero value of gs over the latter period, indicating that, by 1981, their industrial structure was more conducive to growth than that of most other SRs. Only the largest peripheral urban areas – the regional metropoli – have a value close to that of metropolitan areas.
It is also striking that between 1981 and 1996 rural areas, both central and peripheral, have the initial sectoral structure least conducive to growth. This stands in contrast to the 1970s when the rural sectoral mix was relatively good. A final point to note regarding the sectoral component is that for the 1981 to 1996 period it declines monotonically with urban size: in other words, the larger the city the more conducive to growth the initial industrial structure.
The local component, ga, does not vary monotonically with size. However, over the 1981 to 1996 period not one peripheral SR has a positive local component, whereas large metropolitan areas and the largest central urban areas all do. The highest positive local component is observed for central rural areas: this is evidence that over the later 15 years the process of metropolisation has been under way and has affected not only metropolitan areas but also nearby rural ones.
The results of this analysis confirm results of the previous sections where it has been seen that many individual sectors grew faster in central areas and in larger cities. Conversely, peripheral areas, particularly small towns and rural areas, are least likely to have benefited from their economic structure or from positive "other" factors captured – but not identified – by the local component. It should be noted that this picture becomes clear over the 1981 to 1996 period. Between 1971 and 1981 the sectoral component of most peripheral SRs is greater than that for the central ones and some peripheral SRs benefit from positive local components, reflecting the fast growth in primary sector employment over the period.
4.5 Conclusion
Whether sectors are analysed individually or together, and whether growth rates or concentration are looked at, a rather bleak picture emerges for peripheral areas. The sectors on which they are most reliant tend to be in decline, and the sectors which appear to be performing better – retail and various other low-order services – are those which remain to service local populations as economic activity moves towards central and metropolitan areas.
It should be emphasised that the larger peripheral urban areas perform better than their hinterland in a wider variety of sectors, and nothing in the results above suggests that there do not exist some very successful regions located in the periphery. However, in general, proximity to a large metropolitan area and agglomeration economies (urban size) seem to play a key and enduring role in attracting employment, a role which has strengthened over 1981 to 1996.
This trend is not necessarily unidirectional and can fluctuate: there is evidence – not presented here – that the 1991 to 1996 period was somewhat less stark for peripheral areas, since the brunt of the recession was borne by metropolitan areas. However, growth over 1996 to 2001 has again tended to be in and around metropolitan areas. The patterns presented in this section correspond, in our opinion, to the underlying long term trends, around which fluctuations can and do occur.
Figure 3a: Concentration of primary sector employment in SRs, 1971 and 1996, (location quotients) 0.00 0.50 1.00 1.50 2.00 2.50 3.00 3.50 _AM1 _AM2 t1 t2 t3 t4 r 1971 C 1971 P 1996 C 1996 P
Figure 3b: Primary sector employment growth, 1971-1996
index=100 for 1971 1.00 1.20 1.40 1.60 1.80 2.00 2.20 2.40 1970 1975 1980 1985 1990 1995 2000 AC AM AP RC RP
Figure 4a: Concentration of Low value added manufacturing and utilities employment in SRs,
1971 and 1996 (location quotients) 0.60 0.80 1.00 1.20 1.40 1.60 _AM1 _AM2 t1 t2 t3 t4 r 1971 C 1971 P 1996 C 1996 P
Figure 4b: Low value added manufacturing and utilities sector employment growth, 1971-1996 index=100 for 1971 0.80 0.90 1.00 1.10 1.20 1.30 1.40 1.50 1970 1975 1980 1985 1990 1995 2000 AC AM AP RC RP
Figure 5a: Concentration of medium value added manufacturing employment in SRs, 1971 and 1996
(location quotients) 0.00 0.50 1.00 1.50 2.00 2.50 _AM1 _AM2 t1 t2 t3 t4 r 1971 C 1971 P 1996 C 1996 P
Figure 5b: Medium value added manufacturing sector employment growth, 1971-1996 index=100 for 1971 1.00 1.10 1.20 1.30 1.40 1.50 1.60 1.70 1.80 1.90 2.00 1970 1975 1980 1985 1990 1995 2000 AC AM AP RC RP
Figure 6a: Concentration of High value added manufacturing employment in SRs, 1971 and 1996 (location quotients) 0.00 0.20 0.40 0.60 0.80 1.00 1.20 1.40 1.60 1.80 2.00 _AM1 _AM2 t1 t2 t3 t4 r 1971 C 1971 P 1996 C 1996 P
Figure 6b: High value added manufacturing sector employment growth, 1971-1996 index=100 for 1971 1.00 1.20 1.40 1.60 1.80 2.00 2.20 1970 1975 1980 1985 1990 1995 2000 AC AM AP RC RP note: RP grows from 1803 to 3700, RC grows from 4268 to 9230, AC grows from 14272 to 21195, AP grows from 8210 to 8540, AM grows from 85310 to 117890,
Figure 7a: Concentration of wholesale employment in SRs, 1971 and 1996 (location quotients) 0.60 0.70 0.80 0.90 1.00 1.10 1.20 1.30 _AM1 _AM2 t1 t2 t3 t4 r 1971 C 1971 P 1996 C 1996 P
Figure 7b: Wholesale employment growth, 1971 to 1996 index=100 for 1971 1.00 1.20 1.40 1.60 1.80 2.00 2.20 2.40 2.60 2.80 3.00 1970 1975 1980 1985 1990 1995 2000 AC AM AP RC RP
Figure 8a: Concentration of hotel, short-term accommodation, restaurants and camp sites employment in SRs, 1971 and 1996
(location quotients) 0.70 0.80 0.90 1.00 1.10 1.20 1.30 1.40 _AM1 _AM2 t1 t2 t3 t4 r 1971 C 1971 P 1996 C 1996 P
Figure 8b: Hotels, short-term accommodation, restaurants and camp sites employment growth, 1971 to 1996
index=100 for 1971 1.00 1.50 2.00 2.50 3.00 3.50 1970 1975 1980 1985 1990 1995 2000 AC AM AP RC RP
Figure 9a: Concentration of high tech producer service employment in SRs, 1971 and 1996 (location quotients) 0.30 0.50 0.70 0.90 1.10 1.30 1.50 1.70 _AM1 _AM2 t1 t2 t3 t4 r 1971 C 1971 P 1996 C 1996 P
Figure 9b: High tech producer services employment growth, 1971 to 1996 index=100 for 1971 1.00 2.00 3.00 4.00 5.00 6.00 7.00 8.00 9.00 10.00 1970 1975 1980 1985 1990 1995 2000 AC AM AP RC RP