Demand Management:
A Cross-Industry Analysis of Supply-Demand Planning BY
Peng Kuan Tan Bachelor of Science
Imperial College of Science, Technology and Medicine, University of London, 1992
Submitted to the Engineering Systems Division in Partial Fulfillment of the Requirements for the Degree of
Master of Engineering in Logistics Massachusetts Institute of Technology
June 2006
0 2006 Peng Kuan Tan. All rights reserved.
I
LIBRARIES
IThe author hereby grants M.I.T. permission to reproduce
and
to distribute publicly paper and~
M
S
electronic copies of this thesis document in whole or in part.4
Signature of Author.. ...
.:.
...
Master of Engineering in Logistics Program, Engineering Systems DivisionMay 12", 2006
Certified by. ... fi
....
.-
...
...
Larry
Lapide Research Director, MIT Center for Transportation and Logistics Thesis Su~ervisorAccepted by.. ... w.
.;. ...
[
Yossi SheffiProfessor of ivil & Environmental Engineering Professor of Engineering Systems Director, MIT Center for Transportation and Logistics
Demand M,anagement:
A Cross-Industry Analysis of Supply-Demand Planning By Peng Kuan Tan
Abstract
Globalization increases product variety and shortens product life cycles. These lead to an increase in demand uncertainty and variability. Outsourcing to low-cost countries increases supply lead-time and supply uncertainty and variability. Coupled with the increase of mergers and acquisitions, which increase supply chain complexity, and the unforgiving nature of having too little or too much inventory, these factors have accelerated the importance and adoption of the Sales and Operations Planning (S&OP) process.
S&OP is driven by a cross functional team, with the purpose of balancing supply and demand with the objective of maximizing a company's goals. It manages the supply and demand uncertainties, balances the different internal and external stakeholders' interests, and aligns the operations towards its strategy and vision.
In support of the Supply Chain 2020 Project at MIT, this thesis focuses on analyzing the S&OP function across industries. Using the Phase I SC 2020 theses, literature, white papers, and interviews with industry experts, this thesis compares and contrasts the S&OP practices across nine industries. It examines their best practices and underlying principles, as well as the macro factors that have shaped the practices for the last ten to fifteen years, as well as what is expected in the future.
Companies with the "best" S&OP processes collaborate internally to balance sales and operations, and align all internal stakeholders' interests. Furthermore, they collaborate externally with suppliers and customers to reduce supply and demand uncertainties. They also understand and manage demand and supply uncertainties, and align their effort towards their goals. These companies synchronize operations and are agile to changing environments.
Thesis Supervisor: Dr. Larry Lapide
Research Director, MIT Center for Transportation and Logistics Massachusetts Institute of Technology
Acknowledgements
I am indeed honored and privileged to have the opportunity to work under the supervision of Dr Larry Lapide. His deep insights and vast experience of Sales and Operations Planning was key to my understanding of the topic. His guidance, support and constant encouragement during the positive and learning journey was critical for the key insights developed. The numerous discussions on the topic and other areas have allowed me to view the topic from different perspectives and his vast network has connected me to the numerous industry experts that I got to learn more from. I thank you for your willingness to guide and teach, and more importantly, for your patience and space, for me to learn and grow.
I would also like to thank Dr Chris Caplice, Dr Mahender Singh, Dr Edgar Blanco, Yimin An, Petros Englezos, Ioannis Koliousis, Herman Kurapov and Sam Srethapakdi for their constructive and helpll advices, suggestions and ideas given during the weekly SC 2020 meetings.
This research could not have been completed without the generous knowledge sharing from the industry experts. Specifically, I would like to thank John Matchette from Accenture, John Bermudez fiom Demantra, Ron Ireland fiom Oliver Wight, Karin Bursa from Logility, Anand Iyer fiom i2 Technologies, Steve Simco from CSC Consulting, Charlie Fraas from Deloitte, Thomas Jensen from Microsofi and Tod Stenger from SAP. They have deepened my understanding of the topic and provided valuable advice and suggestions.
Last but not least, I would also like to express my deepest gratitude to my wife, Angie and son, Alden. Angie has put her career aside so that the family can stay together while I pursue my study in MIT. They have been very supportive and encouraging and I truly appreciate their sacrifices and understanding. Alden has been a blessing to us and he has brought us joy and happiness throughout.
Table
of Contents
Abstract Acknowledgements Table of Contents List of Tables List of Figures 1 Introduction 1.1 Scope 1 -2 Motivation 1.3 Methodology 1.4 Outline2 Sales and Operations Planning Literature - Supply Chain 2020 Theses 2.1 Supply Chain 2020 Theses
-
Nine Industries2.2 Review Summary
3 Sales and Operations Planning Overview 3.1 What is Sales and Operations Planning? 3.2 Why is it Importance?
3.3 How has it been evolved over the Years? 4 Sales and Operations Planning in Nine Industries
4.1 Consumer Product Group 4.1.1 Demand Planning 4.1.2 Supply Planning 4.2 Retail 4.2.1 Demand Planning 4.2.2 Supply Planning 4.3 Apparel/Footwear 4.3.1 Demand Planning 4.3.2 Supply Planning 4.4 Computer 4.4.1 Demand Planning 4.4.2 Supply Planning 4.5 Telecommunications 4.5.1 Demand Planning 4.5.2 Supply Planning 4.6 Pharmaceuticals 4.6.1 Demand Planning 4.6.2 Supply Planning 4.7 Automobile 4.7.1 Demand Planning 4.7.2 Supply Planning
4.8 Petroleum 4.9 Aerospace
5 Sales and Operations Planning Synthesis and Analysis 45
5.1 Similarities 45
5.2 Differences 47
5.3 Comparison Summary and Analysis 48
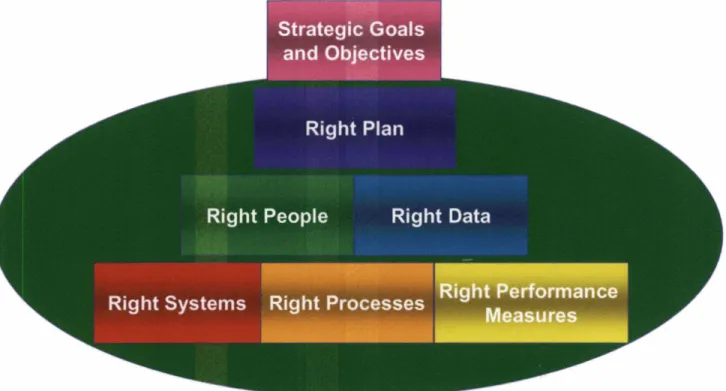
5.4 "Best" Practices 54 5.4.1 Right Plan 55 5.4.2 Right People 56 5.4.3 Right Data 58 5.4.4 Right Systems 59 5.4.5 Right Processes 62
5.4.6 Right Performance Measures 63
5.5 Underlying Principles for its "Best" Practices 65
5.5.1 Internal Collaboration 65
5.5.1 External Collaboration 67
5.6 Macro Factors Shaping Sales and Operations Planning in last Ten to Fifteen Years 67 6. Sales and Operations Planning Trends
6.1 S&OP Trends
6.2 Future Research Areas 6.3 Conclusions
List of Tables
Table 3.1 : S&OP Team Members' Roles and Responsibilities Table 3 -2: S&OP Evolving from Four-Step to a Nine-Step Process
a3mmojlad s l ~ 01 a8el@!a~ aagelax sluarnpvdaa ~U!A!D jo saldrnexg
: E ~ - s
aln8yS9 L3em 23~ Wld dO'BS
30 srsA~euv asne3 loox 3yemalsds Loidaa saspd;caluajo %01 LIUO :Z 1's a&!d £9 samseapq a~uernloj~ad lq.Zf!~ jo squauodmo3 : 1 1
s
a ~ n 8 g 29 sassa3old l q 8 ! ~ JO sluauodmo=) : 0 Is
a&g19 saagarqo p m s l a o ~ Amdm03 lamydo
UON u! 8ugpsaa s a ~ m o s a ~ q3npq OOJ, pamnsuo3 sales L q a ~ a q ~ o y u a 3 ~ :6-5 a ~ n 8 g
09 s a a y a fqo pm
sleoD Amduo3 az!u!xem 03 samseayy a ~ue moj lad ,sluarnmdaa 8 u ~ u 8 q v :g-s a&!a 6s smalslcs 3 q 8 ~ jo sluauodrno;) : L*
s
a&!;38S ales l @ ! ~ JO sluauoduro3 :9-
s
am%d9 s a~doad l q 8 ~ JO sluauodrno3 : S'S a m 8 ! ~
SS ueld lt$i!~ JO sluauodmo3 :pas a&!d
PS s a 3 ~ 3 e ~ d ,,lsaa,, 6 0 % ~ :
E-s
3e1 .g1
Introduction
1.1 Scope
The Supply Chain 2020 Project intends to identify and analyze the factors that are critical to the success of future supply chains out to the year 2020. Phase I largely entailed researching today's excellent supply chains in nine industries to identify what is important to maintaining a competitive position.
The Phase I1 research is focused on identifying the fundamental principles that underlie best practices in these same nine industries. The thesis will focus on analyzing supply- demand planning, one of six functional areas in which supply chain management plays an important role. In particular, it studies the Sales and Operations Planning (S&OP) processes used by the nine industries with an attempt to compare and contrast the processes used, identify the industrial best practices and their underlying principles, as well as to identify their evolution. To conclude, it will project the kture trends and provide a framework for a company to identify key focus areas for their S&OP improvements.
1.2 Motivation
a. Increase in Demand Uncertainties and Variations. Technology advancement, innovations and globalization, have increased the rate of new product introduction significantly. Coupled with the shortening of the product life cycle, products are proliferating at a faster rate than ever, resulting in higher demand uncertainties and variations
b. Increase in S u p ~ l y Uncertainties and Variations. The increase in outsourcing to low-cost countries and global procurement for lower cost items, have increased the complexities and interdependencies of the inter-companies relationship. The tightly integrated systems mean that a small variation in one of the systems could potentially be amplified into a large variation in another system. The increase in merger and acquisition activities has further increased the supply uncertainties.
c. Increase in Cost of Lost Sale and Over-Su~~ly. With the wide choices available, the cost of a lost sale has increased dramatically. While previously, it may be purely losing an item lost sale, the current situation tends to be less forgiving and it is likely to be losing the customer entirely, including the extended products and services. For example, if a customer could not find a particular Hewlett Packard (HP) printer, he would probably switch to another brand of printer. What HP loses is not only that printer sale, but the sale of ink cartridges and fbture printer sales fiom this customer. Similarly, with the rapid development
in technology, new product introduction and shortened product life cycle, excess supply not sold over a period may become obsolete and worthless very quickly.
S&OP process is one of the most important competitive weapons for ensuring that the enterprise is producing the right product, at the 'right quantity, servicing the right customers, through the right channels, at the right time with the right rewards and incentives. This requires a much more refined segmentation of the customer, channel and geographical marketplaces, and the increased ability to be able to determine the optimal demand and supply trade-offs.
In a recent Aberdeen study, more than 70% of respondents indicated that they are or will shortly be improving their S&OP processes and technologies to better arm the enterprise competitively.
In "The Sales and Operations Planning Benchmark Report" by Aberdeen Group June 2004, it found that the "best of breed" S&OP companies have significantly higher complete order fill rates, gross margin percentage and customer retention percentage as shown in Figure 1.1 below:
Figure 1.1: Performance Benchmarking for Companies at Different Stage of S&OP Implementation
In the same report, it was also reported that S&OP can improve post-sales services and support, manufacturing and marketing effectiveness by 30-50%, while improving procurement, klfillrnent and customer service by at least 50%. Most importantly, it can increase sales revenues by more than 70%.
1.3 Methodology
S&OP started as early as 1984 in a few major companies such Proctor and Gamble, Boeing and Caterpillar in the form of Material Resource Planning I1 (MRP 11). Many companies had some form of processes to balance supply with demand though it may not have been termed as S&OP. However, it was not until the early 2000-2001 when companies, consultant firms and software companies began to market S&OP as a source of lowering the product cost, increasing service levels and sales, and thereby increasing overall company profitability. It therefore explains the lack of academia literature in this area, but an abundance of white papers from the software and consultancy companies.
The thesis therefore adopts the approach of first reviewing the past twenty-one Phase I Supply Chain 2020 Project theses and the S&OP literature. Next, a review was conducted on the software, consultancy, research and education company white papers and presentations. Finally, interviews with industry experts were conducted to gain further insights.
1.4 Outline
The thesis is organized into six chapters. Chapter Two reviews the S&OP literature and past SC 2020 theses in the nine industries. From that view, the preliminary S&OP process used by each industry is established. Chapters Three traces the history and
evolution and offers some current definitions for it. Chapter Four details how S&OP is used in each of the nine industries.
In Chapter Five, the similarities and differences of S&OP used across the industries is discussed. In addition, the industry best practices and their underlying principles are identified. Finally in Chapter Six, the current and h r e S&OP trends are discussed. In summing up, a framework is established to help companies focus their S&OP improvement efforts.
2 Sales and Operations Planning Literature
-
Supply Chain 2020 Theses
2.1
Supply Chain 2020 Theses
-
Nine Industries
A review was conducted on the Phase I Supply Chain 2020 Project theses for the nine industries, which are comprised of Automobile, Computer, Telecommunications, Consumer Products Group (CPG), Aerospace, Pharmaceuticals, Petroleum, Retail and AppareVFootwear. While most of these theses did describe the demand and supply planning functions, there are only five theses providing how the companies manage the demand and supply planning through S&OP. This therefore makes the comparison of S&OP in the various industries impossible and more research and phone interview were required to bridge the information gap.
Nonetheless, based on the demand and supply planning described, there are a few trends that could be generalized. First, the product structures are divided into either "Make-to- Order" (MTO) or "Make-to-Stock" (MTS). The MTS companies such as Gillette and Procter and Gamble (P&G) in the CPG industry,(Rah E 2005) are moving fiom make-to- forecast to make-to-demand driven, largely enabled by the information technology which provided them with real-time consumption data. Essentially, make-to-demand driven is still make-to-forecast but based on real-time consumption data rather then past data. This demonstrated the shortening of the cycle time fiom planning, production, distribution, consumption and planning. A unique case seems to appear in the apparel fashion industry which focuses on short production lead-time and smaller batch production so
that when there is a forecast error, the cost of error is low, while the speed to respond to the error is fast. For example, Zara could do a modification to an existing design and get the product out to the street within ten to fourteen days.
The increase in outsourcing non-core h c t i o n s to the low-cost areas contributes largely to the second trend of increasing collaboration with partners and sharing of critical information. For example, Lucent had outsourced all their warehouses and transportation functions in the last few years, while both Dell and IBM (Roy S 2005) used their suppliers to maintain component inventory; therefore the sharing of demand information is critical so that the suppliers are ready to fully support them. Wal-Mart (Chile C and Dau M) had invested in its IT system, Retail Link, to store supply chain information and share it with its suppliers in order for them to help ensure high on-shelf availability. The collaboration with downstream customers to obtain Point of Sale (POS) data reduces the "Bullwhip" effect as companies have better visibility of true demand, and are therefore able to reduce the effect of production and replenishment lead-time and its variability. This allows companies to better plan their operations and replenishment strategies to better meet the customer demand. Similarly, the collaboration upstream with suppliers, ensures a more steady supply of raw material and components, and therefore has the effect of reducing supply uncertainties. Both Wal-Mart and Dell share POS data with their suppliers so that their customers can better forecast the demand and ensure a continuous flow of supply to both Wal-Mart and Dell.
Other forms of strategies to manage demand uncertainties and variations adopted by various industries and companies are:
a. Collaboration with Customer. Cisco through its fiee consulting services attempts to understand its customer better, while Lucent does it through its Supply Chain Network (SCN) and P&G through its Customer Business Development (CBD) groups. P&G also obtains POS data fi-om retailers like Wal-Mart and through the information, P&G can reduce the "Bullwhip" effect and better respond to customer demand.
b. Everyday Low Price. Both P&G and Wal-Mart uses Everyday Low Price strategy to minimize demand variations due to forward buying fiom promotions.
c. Long Fulfillment Lead-Time. Cisco uses a long fulfillment lead-time of twenty-one days to minimize its demand variation though its internal fblfillment lead-time capability is much shorter than that.
d. Ouick Res~onse. Similar to Zara's ability to response quickly to market changes and demand with ten to fourteen days, P&G adopted an efficient consumer response strategy to ensure efficient product mix, efficient new product introduction, efficient promotion and efficient replenishment, while Wal-Mart uses Inforem, an IT system, to automate replenishment process for their retail stores.
e. Half-Batch Production. Similar to Zara for small batch production, Gillette uses a half-batch production method. The lower production quantity allows it to better match its supply with demand.
f. Postponement. Gillette employs postponement techniques for its finished goods packaging, while Zara postpones 50% of its fabric purchases by having griege fabric on hand.
2.2
Review Summary
In summary, the product structure, if it can be modularized, provides the companies an option to "Make-to-Order". A good example is the computer industry where computers can be assembled to order and Dell chose the MTO option while IBM (now known as Lenovo) chose the MTS option for its Personal Computer (PC) business
The increase in outsourcing has led to increased importance of supplier and customer collaboration to effectively reduce supply and demand uncertainties, respectively.
Other form of strategies used to manage demand uncertainties include having everyday low price, promising "long" fulfillment lead-time, having an agile organization to better respond to changing demand, having smaller production batches and the use of postponement.
The past SC 2020 theses have limited information on the various industries practices on demand planning, supply planning, and demand and supply integration. Research into white papers and presentations done by consultant firms, software companies and research institutions, and phone interviews with industry experts have been conducted to fill the gap.
3 Sales and Operations Planning Overview
In this chapter, the definition of Sales and Operations Planning (S&OP) is examined. Further, it explores the importance of S&OP and the history and evolution of the S&OP processes.
3.1
What is Sales and Operations Planning?
Most companies have termed their supply-demand planning as S&OP. Others may name it as integrated supply and demand planning or even supply and demand balancing. The below discussions provide a working definition of S&OP. Figure 3-1 provides the
fkamework for the discussions.
Figure 3.1: Sales and Operations Planning Overview
.
Strategic Planning
I
Pumose - of S&OP. S&OP aims to align the sales, marketing, operations, finance and
supply chains plan towards achieving the company strategic objective and goals such as higher profit and higher service level.
Tactical Level Planning. It's planning is done at the tactical level usually on a monthly basis. Strategic planning, which usually looks into an eighteen-month or more horizon provides the strategic inputs into the S&OP process and drive it to achieve the strategic goals and objectives. The deliverables from the S&OP process are sales, marketing, finance, operations and supply chains plans to support future operations.
S&OP Planning Com~onents. In most companies, S&OP comprises of demand planning, supply planning, and demand and supply balancing. Some have included performance measurements as part of S&OP and a few have even included strategic planning as part of S&OP.
a. Demand Planning. These system components support the development of a demand plan and an "unconstrained" baseline forecast that are used as demand- side inputs to the S&OP process. Quantitative forecasting is done based on marketing and sales inputs such as past sales, promotional activities, marketing efforts, new product introductions and price changes. Market intelligence is gathered fiom field sales and marketing personnel, as well as from downstream customers who share their forecast or Point of Sale (POS) data. For example
Wal-Mart shares its POS data with P&G through its Retail Link, thus allowing both to leverage Collaborative Planning, Forecasting and Replenishment (CPFR).
b. Suooly Planning. These system components support the development of supply plans that are used as the supply-side inputs to the S&OP process. As such, they help to generate the inventory, procurement, logistics and distribution, and capacity and production plans that will be followed to best meet the "unconstrained" baseline demand forecasts. If, however, the supply capacity is insufficient to meet all expected customer demand, this results in a "constrained" demand plan.
c. Demand-Supplv Balancing. This is the part where decisions are made on the right product mix, right production quantity, right allocation to its customer to achieve the right incentives and rewards. Supply constraints such as capacity constraints or supplier's limitations are managed at this stage.
Cross-Functional Team. The S&OP process involves members from all hctional groupings including the demand forecasting organization, marketing, sales, finance, operations and supply chain.
Table 3.1: S&OP Team Members9 Roles and Responsibilities
Develops and distributes the S&OP meeting agenda an
Documents all issues brought up during the S&OP meeting. Updates and tracks the Issues
Provides production plan / demand plan / Inventory statu summary
(including technical and packaging) and commits to changes Provides input on manufacturing schedules/constraints Coordinates with Procurement and provides materia inventory and lead time information
facilitates feedback for consolidating financial performance Provides financial expertise to assist in making S&O decisions
Provides input on the impact of decisions to financia performance
Provides sales trend and achievement
programs plan
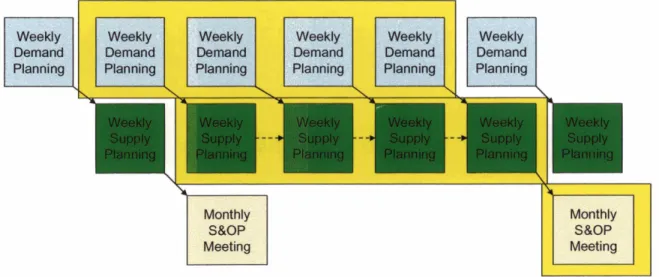
Figure 3.2 : A Typical Sales and Operations Planning Process Flow
Weekly
Demand
rl
Weekly lemand Demand Demand Planning 'lanning Planninp Dlanning
-- m
Monthly Meeting
Number of Meetings. In most companies, the demand review and supply review meetings are conducted on a weekly basis and an executive level S&OP meeting on a monthly basis. In the weekly demand meeting, the demand forecasting organization with the sales, marketing and supply chain departments will develop the unconstrained sales
plan. This will be handed over to the weekly supply review meeting to prioritize the allocation of supply to the sales plan. The weekly supply review meeting is usually represented by members fiom operations, supply chain and finance so as to ensure the
right quantity of the right product is manufactured and allocated to the right customer, so as to give the company the right incentives and rewards. On a monthly basis, the S&OP meeting attended by the executives fiom the sales, marketing, finance, operations and supply chains, will be held to review last month's performance and make tactical decisions for the next month, as well as hrther out in the eighteen to twenty-four months horizon.
S&OP Meeting Activities. There are pre-S&OP meetings, S&OP meetings and post- S&OP meetings activities as follows:
a. Pre-S&OP Meeting Activities:
Conduct weekly demand and supply planning. Measure performance and identify gaps. Perform root cause analysis.
Identify potential options/altematives/solutions Identify potential upsides1 downsides
e
Prepare an exception-based update and options for decision, for the S&OP meeting
b. S&OP Meeting Activities:
Review outstanding actions from preview S&OP meetings. Review current month performance.
Take actions on proposal to tackle performance gaps. Review actions and risks for the next one to four quarters.
Summarize and confirm new S&OP plans, actions, and decisions.
c. Post-S&OP Meeting Activities:
Follow-up on decisions and plans made during S&OP meeting
Factors the decisions and plans into the weekly demand and supply planning.
3.2
Why is it Important?
The increase in systems complexity, new product proliferation, and the shortening of product life cycles has resulted in higher demand and supply uncertainty and variability. Furthermore, a more competitive market place as a result of globalization is driving profit margins down very quickly. These have therefore accelerated the adoption of S&OP as one of the most critical business processes required to enable companies to achieve profitable growth. S&OP strategies accomplish this goal by helping companies to make Right-timed tactical planning decisions on the Right combination of customers, products, and markets to achieve the Right rewards and incentives.
Over the years, the risk and cost of poor decision making in the area of matching demand and supply has increased. In the past, excess supply could result in excess inventory and this can be sold off over time. Whereas for under supply, customers will be driven to select alternative products. The emerging landscape is less forgiving as excess inventories have to be sold off at large discounts, while customers may be lost forever through a lost sale.
S&OP therefore changes the following:
a. Demand Forecasts. From different departments working on their own forecasts to all departments working towards a single set of forecasts for use by all departments. This drives company alignment and keeps it lean.
b. Decision-Making. From decision-making based on limited information within departments to decision making based on company-wide inputs. This results in more company goal and objectives-driven decision-making, balancing all departments' interests.
c. Planning. From departmental-based planning to cross-fimctional team planning focusing on achieving company goals and objectives. This results in global optimization rather than local optimization.
S&OP therefore enables a company to optimize globally towards its goals and objectives, yet with an aligned and lean structure.
3.3
How has it been evolved over the years?
While Oliver Wight had claimed that S&OP started as early as 1984 in the form of MRP 11, AMR Research traced it back to 1987. The lack of a consistent process definition and high profit margin in the 80s and 90s limited the adoption of S&OP.
As profit margins were being squeezed in the beginning of 2000, companies began to look at reducing cost while increasing sales and service levels. Consultancy and software companies begin to see the potential of marketing the matching demand with supply optimally as the way for a company to grow profitably. This was helped by the Y2K
scare where companies rushed to upgrade their computer systems and hence established a ready platform to implement S&OP software and tools that can facilitate the processes.
The key changes of the S&OP processes over the past years are:
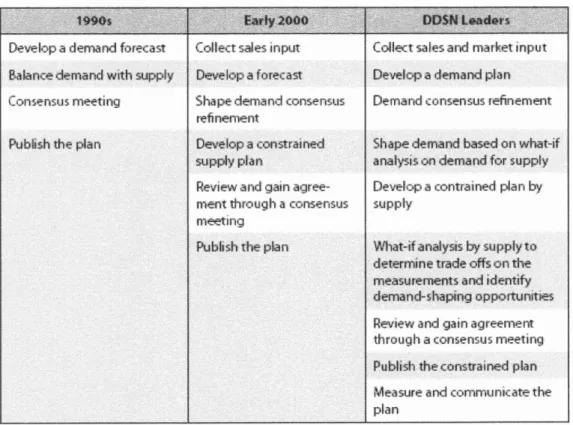
a. It has evolved from a four-step to a nine-step process as shown below in Figure 3.3:
Table 3.2: S&OP Evolving from Four-Step to a Nine-Step Process
I
U?velopadcmandfurecanI
Collectsdes~nputI
Collect sales and market ~ n p u tI
b. It has evolved from a supply chain based process into a business process involving marketing, sales, operations, supply/procurement, and
c. Shorter product lifecycles, higher product mix, and higher product volatility are all putting pressure on margins and accelerating the importance of S&OP processes to drive company goals and objectives including financial performance.
d. With the advancement in technology and the increase in S&OP software, the generation of an S&OP plan now takes about four to eight hours instead of a week.
e. As the clock speed shortens and technology reduces the planning cycle, S&OP has moved fiom a quarterly process to a monthly process. This helps to develop plans more accurately tied to the dynamics of supply and demand.
4 Sales and Operations Planning in Nine
Industries
4.1 Consumer Product Group
The CPG industry can be broadly categorized into: Food and Beverage, Footwear and Apparel, Cleaning Products, Consumer Electronics, and Personal Care Products, including cosmetics and toiletries. Standard & Poor's industry surveys estimates the nondurable goods global market size is about $156 billion (Rah 2005).
The CPG industry is characterized by heavy competition and rapid new product introduction despite steady global demand. As the quality from the private label brands improves, the private labels compete aggressively with the traditional brands. Coupled with the limited market size, since the consumption of CPG goods is rather steady, and concerned with product expiration, CPG companies have been engaging in strong advertising, marketing and promotions to shape the product demand. To capture a bigger piece of the pie and to increase the size of the market, companies have engaged in incremental innovations and complete innovations. This has resulted in a rapid introduction of new products and the shortening of the product life cycle.
CPG companies use S&OP to sense and shape demand. Point-of-Sale (POS) data are gathered from customers either through Vendor Management Inventory (VMI), CPFR or any collaborative effort with its customers to share POS data. With the POS data, more
accurate demand forecasts can be made, and these can be used to determine effective promotion strategies and the timing of new product launches.
As CPG companies are less capital intensive, they have a high variable cost and low fixed cost structure. They therefore, are not as concerned as companies with high capital cost investment on asset utilization. The production can be varied to meet the forecasted demand quantities subject to economies of scale.
CPG companies usually look out into the twelve to twenty-four months time horizon for their S&OP process as this is usually the timeframe which the maximum capacity of the companies cannot be changed significantly. As CPG companies are more material and distribution-based, the increase in capacity is usually the result of adding a factory, distribution centre or warehouse.
4.1.1 Demand Planning
Gillette collaborates with some key customers to obtain POS data. These data are used to improve their demand forecasts, which trigger production. Meanwhile, Gillette is experimenting with methods of using POS data to trigger production directly as they move towards a demand-driven planning environment. Similarly, P&G still does forecasting, and uses the POS data which is captured in its consumer driven supply network (CDSN). CDSN captures the POS data and distributes the relevant data to all network partners, including stores, warehouses, retailers, manufacturers, and suppliers.
Essentially, CDSN improves forecast accuracy with the usage of POS data and sharing of data with partners.
P&G introduced a value-pricing program to provide low prices everyday, reducing the need for promotional pricing which caused the inefficient forward-buying of retailers. Instead, it shapes the demand by heavy marketing spending and branding efforts. P&G also initiated Customer Business Development (CBD) teams to be located in the customers' sites in order to work closely with them in sales, product supply, marketing, finances, and other systems. It was started as a partnership relationship with Wal-Mart, and the company now has more than eighty CBD teams to serve its strategic customers.
4.1.2 Supply Planning
For Gillette supply planning, it has around 80-90% of the orders that are made-to-forecast, under the eighteen-month planning horizon, with the remaining orders that are pack-to- order. The average customer order fulfillment time for regular orders is about six days, while the fulfillment time for pack-to-order orders is about fifteen days. The master production schedule covers eighteen months, and the production plan is divided into three periods: fnm period, slush period, and liquid period. It begins with the liquid period which is the most flexible period when the factory has a general idea of orders expected to come in, but does not commit to vendors and suppliers yet. Then comes the slush period when planners spend time adjusting the schedule to variability in demand and
supply. The firm period is about three weeks before the start of production where no change to the production schedule is allowed.
Gillette had also implemented the half-batch production for some of their products. This led to the lowering of average inventory holding and thereby lower inventory holding cost. Nonetheless, this is traded off with the increase in the number of changeovers and they are currently working to shorten the changeover times.
Similar to the Gillette effort on smaller production batch, P&G strives to have "Just-in- Time" production, one that produces every item every day. They have improved fiom their monthly production of every item to almost weekly production of every item. This reduces the inventory holding throughout the entire supply network.
4.2
Retail
Generally defined, the retail industry is the composition of retail outlets that sell merchandise to consumers. Retail includes both products and services sold in stores, through catalogs, and through the Internet. The industry includes all products that are sold in the following retail outlets: Department Stores, General Merchandise Stores, Hypermarkets and Supermarkets, and Specialty Stores. Based on the S&P General Retail Industry report that was released in May 2004, retail sales in 2003 equated to $3.40 trillion (Chiles and Dau 2005)
In S&OP, retail companies are more concerned with demand forecasting. They use POS data and statistical models to forecast sales and make decisions on when to order and how much to order. They are generally concerned with seasonality, pricing, promotions and marketing. On the supply planning end, retailers aim to share POS data with their strategic suppliers so as to reduce the replenishment lead-time and improve product on- shelf availability.
4.2.1 Demand Planning
The industry is more concerned with getting the right forecast and therefore the importance of obtaining accurate and timely POS data. The industry is unique in getting the POS data direct but the challenge lies with getting u s e l l data, accurately and timely, and to manage the massive amount of data for usefbl trend analysis and forecasts. For example, Wal-Mart invested approximately $4 billion in developing IT Retail Link. One of the major functions of Retail Link is to store the massive amount of data including POS data, average price, current inventory by store, and current on order quantity. The information can be viewed by day, by week, by store, or in any other combination, as well as by day, by Discount Store, and by SKU. This information is key to Wal-Mart's ability to forecast accurately.
4.2.2 Supply Planning
For supply planning, the industry is more focused on collaborating with its suppliers. For example, Wal-Mart uses its Retail Link to share data with vendors and to aid in shipment
routing assignments. Suppliers are given large amounts of raw data concerning their product sales in Wal-Mart Stores and the information can be downloaded into the vendor's data managing system and manipulated and analyzed in any way that would aid the vendor in managing its own products. Through these collaborations, Wal-Mart hopes that the vendors can improve their supply chain and provide a higher service level to Wal-Mart at lower cost. This, in turn, will allow Wal-Mart to provide everyday low price items to its customers and with high fdfillment rates.
The appareVfootwear industry addresses the fashion apparel aspects of the industry such as ready to wear apparel, footwear and accessories. Historically, the industry is characterized as low technology and labor intensive, with low-priced imports and competes primarily on cost. As the items get more fashionable, the demand uncertainty, product differentiation, price, and product life cycles for individual SKUs increase.
The appareVfootwear industry is characterized by long production lead-times, short selling seasons, and difficult demand forecasts complicated by sizes and colors matching. Most appareVfootwear companies lower production cost by outsourcing production or purchases of components, such as fabrics to low-cost countries like Indonesia and China, thus increasing the production lead-time. In general, appareVfootwear items can be classified as fashion items and evergreen or classic items. Fashion items have a short selling season while evergreen items have a rather steady demand over a number of years
usually. The forecast of appareVfootwear is complicated as it faces the sizes and colors issues, making forecasting at an SKU level highly inaccurate.
The industry usually tries to postpone its production by keeping its item in "generic form" till the demand is more certain. For example, Zara keeps 50% of its fabric on hand in greige form so that the long procurement lead-time can be shortened to just a week for dyeing the greige fabric. The shortening of the procurement lead-time shortens the forecast period and hence yields a more accurate forecast. For Zara, they are able to achieve a lead time of four to five weeks for completely new designs and ten to fourteen days for modifications to designs with fabric on hand.
Similarly, Reebok has used risk-pooling and postponement strategy in its National Football League replica jersey forecast and order. Reebok adopted a hybrid strategy of ordering a mixed number of dressed jerseys printed by players' names but at lower overall cost, and blank jerseys without players' names but printed at a later stage with a higher overall cost. As the NFL season progresses, teams trade players and players' popularity changes. The blank jerseys are then used to "produce" the popular jerseys. With postponement and risk pooling, Reebok is able to achieve a high fill rate and profit.
4.3.1 Demand Planning
As explained above, the demand forecast for fashion apparel/footwear is difficult due to the short selling season, long production lead-time and the low demand at SKU level due
to sizes and colors. Though the demand forecasting is difficult, Limited Brands aims to do it as well as it can through S&OP as it considers the lost sale per unit to be too high for their high profit margin products. On the other hand, Zara adopts a strategy of "exclusivity and scarcity" whereby their products are produced in small batches to create the demand greater than supply image to generate the urgency to buy when its customer sees something they like.
4.3.2 Supply
Planning
Much of the effort is then to shorten the production lead-time through the use of postponement and risk pooling strategies so that the forecast lead-time is shortened and a more accurate forecast can be achieved. For example, Limited Brands designs its supply chain with the objective of getting the right product to the right place at the right time at all costs. They are prepared to speed up the entire supply chain at any cost as it focuses on sales revenue with high profit margin. Similarly, Zara adopts a "quick response" strategy by shortening its production lead-time.
4.4 Computer
The computer hardware industry is defined as the OEM manufacturers and sellers of finished computers and can be segmented into three broad groups based on the nature of the final products, namely, the personal computers (PC), the servers and the workstations.
For the purpose of S&OP discussion, only the PC products will be considered. In the PC industry, the challenge is to keep sufficient inventory so as to meet customer demand yet not overdoing to the extent that it become obsolete when new products are introduced. The industry is unique in the way that the product is modular and thus allows the option for "build-to-order" (BTO). Dell chooses the BTO option while IBM (now part of Lenovo) largely continues with the traditional "make-to-forecast" model. Unlike the retail industry, customers in the PC industry are more prepared to shop online for their PCs and wait for a few days for the delivery. Most importantly, customers value the ability to customize their own PCs rather than the PCs available at shopping malls.
4.4.1 Demand Planning
In general, Dell is less concerned than IBM in its demand planning as it operates a BTO model. Dell is less concerned with product obsolescence as all the parts for the PCs that are kept in component form can be used to support multiple PC models. Furthermore, Dell and its suppliers have the ability to shape the component demand by its pricing. The key purpose of Dell's demand forecast is to share the data with its suppliers so that they are prepared to support the demand.
4.4.2 Supply Planning
Dell shares its forecast and daily consumption data as far as thirteen weeks in advance with its suppliers. This is to give the suppliers a better sensing of the market and
facilitates their inventory planning in their storage locations close to Dell. For supply planning, IBM too shares its forecast with its suppliers and most of its suppliers maintain inventory close to IBM facilities.
Dell matches its demand with supply in four consecutive time horizons, 'one month horizon', 'two weeks horizon', 'three days horizon' and 'daily production planning'. Each planning horizon has its own tasks and objectives. For example, the one-month planning looks at the next month demand forecast with the objective to allocate capacity to meet it. The two-week plan looks at possible components and manpower shortages and work out contingency plans to handle the potential shortfalls. In the three-day planning horizon, overtime requirements are decided, while during the twenty-four hours planning window daily production runs are committed. In addition, Dell manages its shortage on a three weeks time horizon. Short-term shortage is managed by shaping demand or upgrade. In the case when there is long-term shortage of any specific part item, a shortage meeting is called to work out contingency plans.
4.5 Telecommunications
The telecommunications industry is defined as those companies selling communications end products such as cell phone, wireless equipment and routers. The industry is very similar to the computer industry as technology is developing rapidly but has long production lead-time. The industry is therefore very concerned with getting the right forecast as a wrong forecast could result in excessive inventory and will be extremely
costly to the company. In the 2001 when there was a global down-turn of telecommunications demand and the bursting of the Internet bubble, both Cisco and Lucent accumulated large amounts of inventory and had to write off most of it.
4.5.1 Demand Planning
Demand forecast accuracy is crucial to the survival in this industry as demand is highly uncertain due to the technology advancement. Cisco adopted the strategy of being close to customers and close to the standard-setting bodies in order to have a better sensing of demand. Cisco uses its fiee consulting services to understand customer needs and demand while it involved itself closely with standard bodies to decide on standards and therefore able to adopt and incorporate new standard quickly. Cisco also uses a long order fulfillment lead-time of twenty-one days to reduce the demand variation. Lucent has similarly used its Supply Chain Networks (SCN) group to be the single point of customer contact to gain intimacy and customer understanding.
4.5.2 Supply Planning
Cisco keeps itself lean by having almost of its production out-sourced so that it is able to response to the changing technology and demand effectively. Furthermore, it has shifted part of its focus fiom hardware to software. In addition, Cisco keeps R&D cost low by acquiring technology-rich companies and integrating them. In this way, Cisco is keeping its asset cost low in a medium capital intensive industry. Similarly, since the 2001 crash,
Lucent adopted a Virtual Manufacturing Strategy (VMS) by selling most of its twenty- nine manufacturing facilities, while at the same time outsourcing its manufacturing requirements.
4.6 Pharmaceuticals
The pharmaceutical industry is in a highly regulated environment with an important role of preserving human life. The industry is distinct in that it has a long R&D period with a low probability of success for new product development. Nonetheless with the massive R&D in the industry because of the high rewards, rapid new product introduction is a feature of the industry. As the industry faces more regulation, companies usually deal with the national health of each country to introduce its products and the success or failure could mean a drastic change in its demand. On the other hand, once a deal is through, the demand seems more stable.
4.6.1 Demand Planning
The demand forecast usually looks into five to seven years ahead as this is the period from product R&D to introduction. The long range forecast is highly inaccurate as the probability for R&D success is low and the introduction of new products to each country is subjected to the national health approval. However, having the long range forecast globally with a shorter range for each location can improve the forecast accuracy. For example, Lily has a refreshed global thirty month forecast fiom sales offices, updates the
last three months production performance, reconsiders inventory or changes in anticipated launch dates, and creates a new plan of manufacturing for all products and all sites, while each site focuses inside a six-month horizon.
As the production of medicine is highly regulated, the production is likely to be controlled and restricted to a number of plants. This helps the demand forecasting as individual countries/regions demand can be aggregated.
4.6.2
Supply
Planning
For supply planning, the long term demand forecast addresses its long term capacity planning while the short term demand forecast provides the parameters for production and supply chain matching. For example, Lilly has a long-range business plan covering the next five years and it is used as the basis for a five-year capital investment plan. Critical to the industry is the need to produce medicine with a "healthy" expiration date so that it can be consumed before expiration. This is a challenge especially for nuclear medicine with short shelf life. This means the demand, production and distribution planning must be well synchronized. Furthermore, medicine that can save lives must have high order fulfillment rate so that no one will be deprived of medicine when it is needed.
4.7 Automobile
The industry has a long production lead-time and with customers not prepared to wait long, it hampers the industry's ability to "make-to-order". While the industry is focused on trying to reduce its lead time in order to adopt the MTO model, demand forecasts are crucial for sizing capacity and for sharing with its suppliers in order to have "Just-in- Time" parts delivery, and hence production. There are already moves for dealers to place orders to the automobile manufacturer in two timefiames. The first is to place a quantity order for a generic model of car and the second is nearer to the delivery date synchronized with the production schedule, to determine the "option package".
4.7.1 Demand Planning
The automobile business is one of the most competitive industries where companies compete in price, quality and innovations. Demand forecasting is important to the industry as the long production lead-time has yet to reduce to a level below customer waiting time. With the competitive nature of the industry, the demand is further complicated with the rapid new product introductions to increase market share, while maintaining price-competitiveness.
4.7.2 Supply Planning
Supply planning is important to the automobile industry as it has high fixed cost structure due to the high capital investment. It takes three to five years for it to increase its
capacity while in the tactical and operational timeframe; it is more concerned with the capacity utilization. Toyota had led the way in the "Just-in-Time" production in the 1990s and this lean production strategy has increased the importance of collaboration with its suppliers to ensure JIT delivery of components. The ability to achieve good asset utilization and lean inventory management ensures the price competitiveness of the company.
4.8
Petroleum
The petroleum industry capacity is limited by the oil sources around the world while the demand of petroleum has been increasing steadily over the years. Demand for petroleum is increasing but stable. Long range forecasting is done so as to assess the need to increase exploration activities in search for oil in order to increase long term capacity. Companies in the industry use price to actively shape the demand in order optimize profit margin.
The production is constrained by short-term capacity. The industry has a long lead time to adjust its capacity. With a high fixed cost investment, the industry tries to maximize its utilization. However, as petroleum is a non replaceable resource, the asset utilization is subject to balancing the demand, supply and price in order to maximize profit.
4.9
Aerospace
The aerospace industry has a very long production lead-time of nine to eighteen months. However, as the customers of this industry are willing to wait that long for the planes, the aerospace companies like Boeing are able to adopt the "Build-To-Order" model whereby planes are being built only after orders are placed. The industry is very heavy in its assets and has a long lead-time for changing its capacity. This explains the reason why some companies like Boeing and Airbus in the industry, have a long range forecast of as long as twenty years.
The industry has a long order fulfillment lead-time. For example, Boeing needs its customer to confirm orders eighteen to twenty-four months in advance though its production lead-time is nine to eighteen months. As the capacity cannot be changed in the short run, accepting or rejecting an order is driven by the capacity.
Being in a high fixed cost industry, companies are mostly concerned with asset utilization as the main priority. They are concerned with generating demand to meet the current capacity and need not over generate the demand beyond capacity as they cannot meet the excessive demand in the short term. Forecasting down the supply chain is also important for the industry. For example, Boeing tries to produce accurate forecasts that would enable component suppliers to be more informative to the raw material suppliers. This in turn, reduces order lead time in an area where bottlenecks occur as all manufacturing industries compete with the aircraft industry for resources.
5 Sales and Operations Planning Synthesis and
Analysis
This chapter will compare and contrast how industries use S&OP, determine the "best" practices for S&OP and their underlying principles, and finally discuss on the macro factors that have shaped S&OP in the last ten to fifteen years.
5.1
Similarities
From Chapter four, it can be deduced that the industries studied have the following similarities in the way they adopt S&OP:
Alignment to achieve a set of comDanv goals and obiectives. Across the industries, companies use S&OP to align processes, systems and decision making towards the company goals and objectives. For example, Wal-Mart's corporate strategy has been to be the everyday lowest-priced retailer. From the demand planning end, Wal-Mart uses everyday low price to have consistently high demand with low variation. Wal-Mart also avoids the costs incurred from having to heavily merchandize and promote products. From the supply planning end, it shares its POS through Retail Link with its suppliers to increase on-shelf availability and increase inventory turn. These result in high fill rate, and high sales revenue with low inventory holding costs.
Similarly, Dell's corporate strategy has evolved into being the highest value-to-cost provider of personal computers and accessories. It keeps its prices low by direct sales,
while allowing customers to customize their PCs. From demand planning, Dell is aggressively shaping its demand through pricing in order to balance demand and supply. For example, component A1 may be selling very well and its inventory level has run low while component A2, a compatible substitute for Al, is not selling as well and its inventory is building up. Dell will raise the price for component A1 and reduce the price for A2 so that demand for A1 will drop while demand for A2 will increase. In the computer industry where new product and components are introduced rapidly, Dell and its suppliers avoid technology obsolescence very well through shaping the demand for its parts through pricing and thus can pass on these savings to the customers. In the supply planning, it shares its POS data with its supplier to improve fill rate with optimal inventory level.
Demand Planning. All industries are concerned with demand planning though it may be more important for those whose operating model is "make-to-forecast" and have high lost sale or obsolescence cost. Even for aerospace industry and Dell which operate with a "make-to-order" model, the long range forecast is essential for capacity planning while the short term forecasts are necessary for the suppliers to provide higher service level.
Balancing Demand and Supplv. All industries need to balance the demand and supply though some may view demand as more critical, others supply as more critical, or even both as equally important. The ability to balance the interest of the marketing, sales, operations, supply chain and finance in order to achieve a company's objectives and goals is an evergreen issue.
Cross-Functional Team. The ability to balance supply and demand necessitates cross- functional participation in the S&OP process in every industry.
5.2 Differences
The differences of the S&OP process adopted by the various industries are as follows:
S u p ~ l p Planning. The industries can be roughly differentiated by the percentage of capitayasset to the entire organization cost. From the accounting perspective, it is the ratio of fixed cost to variable cost. The higher the ratio, the more capital intensive is the industry. Confirmed by the industry experts, the industries can be ranked as Retail, AppareVFootwear, CPG, Computers, Telecommunications, Pharmaceutical (including
R&D
investments as capital investments), Automobile, Petroleum and Aerospace in ascending order of capital intensiveness. It can be W h e r implied that the more capital intensive an industry is, the more it is concerned with asset and capacity utilization and therefore needs to focus on supply planning. For example, both aerospace and automobile are extremely concerned with its asset utilization.Time Horizon. Furthermore, it seems that the time horizon is correlated with the capitallasset build up lead-time. The aerospace and petroleum industries have the longest capital build up lead-time and therefore their S&OP processes consider a time horizon as long as twenty years for the aerospace industry and about five to ten years for the
I . . - 4 - w e . . . & Y . l i e . . .
petroleum industry. The pharmaceutical industry has a long horizon of about 7 years as the process in researching into new medicine and getting it approved for use is within this timefiame.
Collaboration with Customers. Companies with "make-to-forecast" operating models are more concerned about collaborating with its customers than companies with "make-to- order" operating model as the ability to obtain accurate and timely POS data can result in more accurate demand forecast. For example, P&G collaborates with Wal-Mart and obtains the Wal-Mart POS f?om the Retail Link system.
5.3 Comparison Summary and Analysis
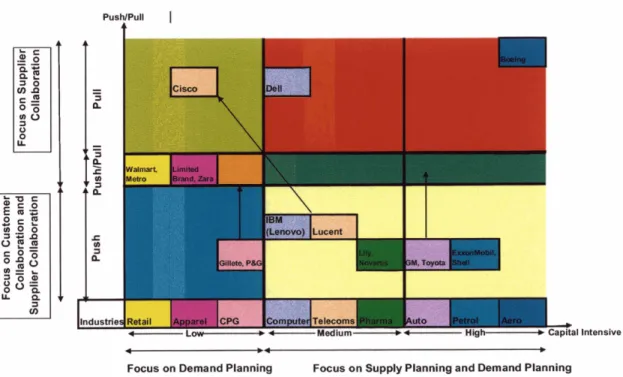
In summary, the comparison between the industries is shown in the below figure:
Figure 5.1: Summary of Cross Industry Comparison
uto
Focus on Demand Planning Focus on Supply Planning and Demand Planning b
Figure 5.1 x-axis shows that industries can be generally clustered into low, medium and high capital intensive industries. The Retail, AppareVFootwear and CPG are clustered into the low capital intensive industries and therefore more concerned with demand sensing and shaping. The objective is to sense the demand, forecast it as accurate as possible and then shape the demand through marketing, sales and promotion to achieve the desired sales and profit. For example, Limited Brands in the AppareVFootwear industry is focused on getting the right item to the right place at the right time to minimize lost sales, as the cost of lost sales is extremely high. Furthermore, they are focused on shaping the marketing trends and fashions through its marketing and promotion efforts, and this usually created demand that in the first place did not exist.
For the industries in the medium to high capital intensive clusters, they are more concerned with asset utilization as the asset cost is comparatively higher. They therefore attempt to shape the demand to their short term capacities with the objective of maximizing their profits. These companies also have a longer forecast horizon, a timefiame which decisions on their long term capacity can be made. For Boeing, their long range forecasts are as long as twenty years ahead while the pharmaceutical industry typically has a seven year forecasting horizon as this is the duration fiom R&D to new product introduction.
In the telecommunication industry, the companies are typically in the medium capital intensive cluster. Cisco, however, has most of its manufacturing outsourced and therefore can be considered as "low" capital intensive company. Similarly, Lucent had
aggressively outsourced their manufacturing plants, warehouses and distribution based on its "virtual manufacturing" strategy and had since moved to become a "low" capital intensive company. By outsourcing, Cisco and Lucent are effectively reducing its capital cost by increasing its supply lead-time.
The y-axis of Figure 5.1 shows the push or pull operating model adopted by the various companies. In general, companies in the CPG, Pharmaceutical, Automobile and Petroleum industries adopted a "Push" operating model. In a "Push" operating model, companies make decisions on production based on demand forecasts. CPG, Pharmaceutical and Petroleum may be adopting a "Push" operating model more due to economies of scale reasons, while the reason for Automobile industry is because of the long production lead-time, which is simply longer than the waiting time customers are prepared to accept.
Most of the companies in the Retail and AppareVFootwear industries also adopt the "Push" model to have high on-shelf availability. They, however, are unique in the way that they deal with the end customers directly and therefore do not need to collaborate with their "customers" for getting POS data. For example, Wal-Mart spares no effort in providing its suppliers with POS data so that its suppliers can better forecast the demand and provide higher service level to Wal-Mart, which in turn achieves high on-shelf availability and high sales per square foot. According to Prof. Arnoldo Hax from MIT, Wal-Mart has a $440 sales per sq foot compared to $249 and $221 for Target and Krnart, respectively. This is almost twice as high as its competitors.
For the PC business in the computer industry, Dell chooses the "build-to-order" operating model which is a "Pull" model, while IBM (now Lenovo) chooses the "build-to-forecast" model, which is a "Push" model. In a "Pull" Operating model, companies make decisions on production based on actual demand rather than demand forecast. In a pure "Pull" operating model, companies do not hold finished goods, but only build the items upon orders received. In choosing the "build-to-order", Dell reduces its demand uncertainty by compromising on economies of scale in production and distribution, and increasing customer order llfillment lead-time.
In general, companies in the telecommunication industry adopt the "Push" model. Cisco and Lucent, however, have most of its manufacturing outsourced and can be considered as adopting a "Pull" model. The outsourced manufacturing companies are likely to operate in a "Push" model, but both Cisco and Lucent only "pull" stocks from the manufacturing companies as and when required. In this way of operating, Cisco and Lucent minimize their inventory holding, but their performance is heavily dependent on its outsourced companies and sometimes they can be held ransom for higher cost.
For the aerospace industry, it is unique that it has a long production lead-time of nine to eighteen months but the customer are prepared to wait up to eighteen to twenty-four months. This uniqueness enables companies like Boeing to adopt a "make-to-order" model and hence a "Pull" concept.
Collaboration with customers is more of demand planning, while collaboration with
suppliers is more of supply planning. Considering this, we can have the following four distinct sectors as showed in Figure below:
Figure 5.2: Conclusion from Cross Industry Comparison
Focus on Demand Planning Focus on Supply Planning and Demand Planning A
b
Need longer Planning Horizon
-
-
3 P-
I-
A h 33
y 1 2 0. C (I) P*
Eauallv Light Focus. Companies like Wal-Mart and Metro in the Retail Industry, Limited Brands and Zara in the AppareYFootwear industry, and Lucent and Cisco in the
Telecommunication industry belong to this sector. For the demand planning side, this sector is concerned with demand sensing and shaping while for the supply planning side. it is focused on collaborating with their suppliers through POS data sharing in order to get high service level from its suppliers.
Focus More on Demand. Companies like P&G and Gillette in the CPG industry belong to this sector. For the demand planning side, this sector is concerned with demand sensing and shaping, as well as collaboration with customers in order to obtain POS data for better and more accurate forecasts. On the supply planning side, it is focused on collaboration with their suppliers by sharing their forecasts with suppliers.
Focus More on Supply. Companies like Dell in the PC business and Boeing in the aerospace industry belongs to this sector. In demand planning, they are focused in shaping their demand so that it is close to their short-term capacity. In the supply planning end, they are focused on asset utilization since they belong to the asset intensive cluster. Being heavy in assets also explains the reason for having longer range forecasts as it helps them to decide on long term capacity. These companies are also concerned with suppliers so that they can get their supplies in time for producing the end items.
Equally Heavy Focus. Companies in the Pharmaceutical, Automobile and Petroleum industries are generally in this sector. In the demand planning side, they are focused on shaping their demand to their short term capacity, and they collaborate strongly with their customers in order to have better customer knowledge and accurate POS data. In the supply planning end, they are focused on asset utilization, longer range capacity and collaboration with suppliers.