An Analysis and Mitigation of Demand Variability on External Supply Chains
by
Meghan Savage Wright
S.B. Aerospace Engineering, Massachusetts Institute of Technology, 2013
M.S. System Architecting and Engineering, University of Southern California, 2016
Submitted to the MIT Department of Mechanical Engineering and the Sloan School of Management in Partial Fulfillment of the Requirements for the Degrees of
Master of Science in Mechanical Engineering and
Master of Business Administration
In conjunction with the Leaders for Global Operations Program at the Massachusetts Institute of Technology
June 2019
C 2019 Meghan Savage Wright. All rights reserved.
The author hereby grants to MIT permission to reproduce and to distribute publicly paper and electronic copies of this thesis document in whole or in part in any medium
now known or hereafter.
Signature of Author
Signature redacted
MIT Department of Mechanidai Engineering, MIT S4an School of Management May 9, 2019
Certified by
Signature redacted
Dr. Jung H n, Thesis5upe visor essor of echanic 4gKeering
Certified by
Signature redacted
Accepted by
Accepted by
n-Xhomas Ro'mr, 1hsiR-Supervisor
5turer in Operations Management
Signature
redacted-I
Nicolas HadjiconstantinouChair, Mechanical Engineering Committee on CrGjduate Students
Signature redacted
Maura Herson Assistant Dean, MBA Program, MIT Sloan School of Management
An Analysis and Mitigation of Demand Variability on External Supply Chains
by
Meghan Savage Wright
Submitted to the Department of Mechanical Engineering and the Sloan School of Management
On May 9, 2019, in partial fulfillment of the requirements for the degrees of Masters of Science in Mechanical Engineering
and
Master of Business Administration
ABSTRACT
In the pharmaceutical industry, increasing product complexity, shifts towards specialty medicine and growth in emerging markets have resulted in increased forecast variation and manufacturing complexity for new products. In the past six years, AstraZeneca has outperformed its peers in research and development productivity,
increasing the number and speed of product launches. The resulting demand variability and shifting operational environment have led to financial and non-financial impacts, such as poor inventory performance and strained supplier relationships. The objective of this research is to identify processes and procedures that amplify the impact of demand variability and the areas in the end-to-end operation that are significantly impacted. The secondary objective is to identify process improvements in the existing system and develop strategies to mitigate the risk of demand variability.
This thesis presents an analysis of the impact of demand variability on the external manufacturing and supply chain operations for new products. A case study approach is used to assess its impact on the forecast processes, manufacturing systems and supplier relationships. A simulation tool was developed as a method to measure financial impact based on inventory performance. The simulation was expanded for use as a decision assist tool to evaluate test cases developed from the current state analysis.
The research illustrates that the end-to-end manufacturing and supply chain operation is experiencing significant bullwhip effects for new products. The primary sources of financial impacts are the policy stock requirements tied to monthly demand and segmentation of the supply chain causing different forecasts to be used for certain stages. Non-financial impacts include loss of trust with suppliers, manually managed complexity and limited communication resulting in the bullwhip effect. The short-term and long-term recommendations focus on increased operational transparency and scenario-based forecast planning to mitigate the impact of demand variability on the system. Pilot programs for statistical process control implementation in drug substance manufacturing and development of a future state commercial partnership model were defined as follow-up work to this research
Thesis Supervisor: Thomas Roemer Thesis Supervisor: Jung-Hoon Chun
Acknowledgements
The author wishes to acknowledge the Leaders for Global Operations program for the opportunity to complete this research and support throughout the program.
It is with the help and support of many individuals that this research and thesis were possible. Special thank you to the AstraZeneca and GES team who helped me feel welcome in a foreign place, answered my endless questions and provided an amazing learning opportunity. I would like to especially thank:
Matt for his mentorship, guidance and support throughout the project. The internship experience would not have been as rewarding without your support and willingness to dive right into being an LGO Partner company.
Alison for ensuring I had everything I needed for my internship and always being a friendly face in the office.
Martin and Helen who let me use their products for case studies, provided me with valuable insights and opportunities to test my simulation and recommendations. Kendra and Andrea for all your support and guidance to learn the forecast translation process and perils of long-term capacity planning. I would like to thank Kendra especially for getting me involved in the Supplier Summit.
Special thanks to the leaders at the three suppliers I worked with for allowing me to visit your sites and learn from you and your employees. The perspective brought by this group greatly enriched the research.
Thank you to my advisers Jung-Hoon Chun and Thomas Roemer for all your support and guidance throughout the research.
Finally, I would like to thank my family for their never-ending support regardless which adventures I take. To my LGO friends and classmates, cheers to an amazing two-years. The experience would not have been the same without you!
Contents
A cknow ledgem ents... 5
List of Figures... 9
List of Tables ... 10
A cronym s... 11
1 Introduction ... 13
1.1 Com pany Inform ation... 13
1.2 Current Environm ent and M otivation... 14
1.2.1 Expanding Pharm aceutical Industry ... 15
1.2.2 Shifting Supply Chain Risks at A straZeneca ... 16
1.2.3 Contract Manufacturing Industry for Pharmaceuticals ... 19
1.3 Problem Statem ent ... 21
2 Literature Review ... 23
2.1 The Bullwhip Effect: Measuring and Mitigation... 23
2.1.1 M itigation Strategies... 24
2.1.2 M easuring Bullw hip: Current M ethodologies... 25
2.2 Supply Chain Sim ulation Softw are...25
2.3 Engaging the supply base - Transactions to Partnerships ... 27
3 A pproach ... 31
3.1 D ata Collection and Current State A nalysis ... 32
3.2 M odeling and Sim ulation... 34
3.3 Test Cases and Recom m endations... 35
4 Current State A nalysis... 36
4.1 M anufacturing and Supply Chain O perations... 36
4.2 Forecast M ethodology and Process ... 43
4.3 Forecast V ariation A nalysis... 48
4.4 Supplier Relationships ... 54
5 Sim ulation M ethodology... 58
5.1 Sim ulation Strategy... 59
5.2 Forecast Translation Process... 61
5.4 Simulation Output... 68
6 Impact Assessment Results ... 69
6.1 Financial Impacts ... 70
6.2 Non-financial Impacts...73
7 Test Case Analysis and Results... 77
7.1 Alternative Commercial M odel ... 77
8 Key Findings and Recommendations... 80
8.1 Recommendations... 81
8.2 Tactical Recommendations... 82
8.3 Strategic Recommendations... 85
8.3.1 Operational Transparency... 85
8.3.2 Scenario Based Forecast Planning... 86
9 Conclusion... 89
Appendix A - Pilot Programs... 91
i. Pilot 1: Forecast Communication and GES2025 ... 91
i. Pre-work... 92
ii. Phase 1 - Forecast Scenario Development ... 93
iii. Phase 2 - Supply Chain Engagement and Pilot Definition... 94
iv. Phase 3 - Implementation ... 95
v. Target Outcome ... 96
II. Pilot 2: Process Control and Capacity Analysis ... 96
i. Process Control Overview and Application... 97
ii. Suggested Pilot Program Overview ... 99
iii. O utco m e ... 10 0 Appendix B - M atLab Scripts ... 102
9.1.1 This appendix contains the relevant MATLAB scripts that were used to execute the simulation described in Section 5.2. It contains the following scripts and functions: 102
List of Figures
Figure 1 -Global External Sourcing Organization Overview...13
Figure 2 -General Small Molecule Pharmaceutical Manufacturing Process Overview.. 15
Figure 3- Project Success Rate by Phase Following 5R Implementation [21] ... 16
Figure 4 -AstraZeneca Current Clinical Trial Program ... 17
Figure 5 -Current State Analysis Framework ... 32
Figure 6 -Product A Manufacturing and Supply Chain Process Map...38
Figure 7 -Product B Manufacturing and Supply Chain Process Map ... 39
Figure 8 -NPI Long-term Forecast Translation Process...44
Figure 9 -Product A API Forecast Variation...48
Figure 10 -Product B API Forecast Variation... 49
Figure 1 -Impact of BCP on API Forecasts...52
Figure 12 -Impact of BCP on API Forecasted Volumes ... 53
Figure 13 -Sim ulation Conceptual M odel ... 58
Figure 14 -Software Strategy for Simulation Tool...60
Figure 15 -Example Forecast Matrix for Simulation Input...61
Figure 16 -Flexible Volume Ordering Computational Framework...65
Figure 17 -FlexSim 3D M odel Structure... 66
Figure 18 -Sim ulation Process Flow ... 67
Figure 19 -FlexSim Visualization Examples ... 68
Figure 20 -Estimate of Order Volume Difference Due to Leadtime Mismatch...71
Figure 21 -Impact of Using Different Forecast Methods - 2...72
Figure 22 -Impact of Using Different Forecasting Methods - I...72
Figure 23 -Example Manufacturing Network ... 73
Figure 24 -Bullwhip Effect Due to BCP Policy Stock Included in Demand ... 75
Figure 25 -Actuals vs. Flexible Ordering Commercial Model...78
Figure 26 -Flexibility Parameter Sensitivity Analysis ... 79
Figure 27 -Recommendation Framework -Build the Foundation First...81
Figure 28 -Alternative Method for Defining Policy Stock Requirements for NPIs...82
Figure 29 -Proposed BCP Manufacturing Volumes ... 83
Figure 30 -Proposed planning gap compared to current state ... 84
List of Tables
Table 1 -Summary of Select Simulation Software Packages ... 27
Table 2 - External Benchmarking -Key Takeaways... 29
Table 3 - Summary of Case Study Product Selections ... 31
Table 4 -Test Case Commercial Models ... 35
Table 5 -Example Variation in Demand by Manufacturing Stage ... 50
Table 6 -Policy Stock Requirements for Business Continuity Plan ... 51
Table 7 - Supplier O verview ... 55
Table 8 -Example Commercial Framework ... 64
Table 9 -Example Cumulative API Output ... 66
Acronyms
Active Pharmaceutical Ingredient API
AstraZeneca AZ
Contract Manufacturing Organization CMO
Food and Drug Administration FDA
Global External Sourcing GES
Global Portfolio & Product Strategy GPPS
Leaders for Global Operations LGO
Massachusetts Institute of Technology MIT
New Molecular Entity NME
New Product Introduction NPI
Operations Senior Leadership Team OSLT
Research and Development R&D
1 Introduction
The research and activities discussed in this thesis were performed from June to December
2018 as part of the Leaders for Global Operations (LGO) program at the Massachusetts Institute
of Technology (MIT). The research was conducted as collaboration between AstraZeneca and MIT. It was hosted by AstraZeneca's Global External Sourcing (GES) organization out of the Macclesfield, UK site. This section outlines the relevant company information and industry analysis as background and project motivation. It then introduces the problem statement and research objectives guiding this work.
1.1 Company Information
AstraZeneca (AZ) is a leading, global biopharmaceutical company whose innovative medicines are used by millions of patients across over 100 countries. Headquartered in the UK, the company focuses on the discovery, development and commercialization of prescription medicines in three main therapy areas; oncology, cardiovascular & metabolic disease and respiratory disease. Their product portfolio is primarily small-molecule treatments but since the acquisition of MedImmune in 2006, the biologics business is expanding. Over the past six years, the company has successfully launched several new products and rebuilt their research &
development (R&D) pipeline, making it one of the most productive pharmaceutical R&D organizations in the industry.
wo ~ 2,cepdc w W"ag asaano* *~~O r ... Wwtue
Figure 1 -Global External Sourcing Organization Overview
Global External Sourcing (GES) is the organization responsible for the development, maintenance and optimization of supply chains providing devices, active pharmaceutical ingredients (API), formulation/packaging and several other critical materials and services to AstraZeneca's small molecule business. An overview of the GES operation is shown in Figure 1.
The organization is responsible for the supply chain activities over a product's lifecycle as well as business development activities, including acquisition and divestments of products. As part of Global Operations within AstraZeneca, GES acts as a "virtual" supplier into the AstraZeneca internal manufacturing network and provides greater than $1 B in production value to the company annually.
In addition to the external manufacturing suppliers, GES works with the commercial marketing, Global Supply Chain & Strategy (GSC&S), Global Portfolio & Product Strategy
(GPPS) and Pharmaceutical Technology & Development (PT&D) organizations within
AstraZeneca to execute new supply chain strategies, launch products and support lifecycle management programs. These organizations in many cases are suppliers to GES of information and processes required for external manufacturing operations.
1.2 Current Environment and Motivation
Shifts in the health care industry and changing corporate strategies at AstraZeneca have generated a period of immense change for the company and the supply base over the past decade. The current state system and processes were not designed to optimally handle many of these changes such as the increased number of product launches, focus on specialty medicine and increased importance of emerging markets. This has resulted in significant deviations from inventory design volumes and an external manufacturing system incapable or sluggish to react to changing demand forecasts. Tension is created between the supply chain performance and
AstraZeneca's return-to-growth and science led strategies by tying up cash in inventory. These funds could otherwise be used for R&D activities that fuel the company's future growth.
Throughout 2018, there was intense focus on reducing unplanned inventory levels to free up cash flow for growth activities.
GES utilizes long-term demand forecasts for strategic capacity planning and executing
supply contracts. Accurate demand forecasting is challenging, especially in the pharmaceutical industry where clinical trials and the regulatory environment are sources of major uncertainty. Long lead times and manufacturing offsets require API volume commitments on average three years prior to the demand consumption for the final product. A standard small-molecule pharmaceutical manufacturing system is divided in to drug substance and drug product
system due to long lead times and drug product manufacturing is a pull system. The general process is shown in Figure 2.
Long-term forecasts and annual planning Short-term forecasts and monthly planning Registered Starting inemdae Active Pharmaceutical Pod..PAdc Podc
Mufa trin Manufacturing MauatrnFormulation Packaging Distribution
Figure 2 -General Small Molecule Pharmaceutical Manufacturing Process Overview
Forecasting is the responsibility of the commercial organization and forecast accuracy is critical to the performance of the external supply chains. Long-term forecast variability can lead to product shortage on one extreme and product waste on the other. This results in financial and non-financial impacts such as inventory write-offs, stockouts, sub-optimal supply contracts and damage to supplier relationships. The apparent increase in demand variability over the past few years has exacerbated these impacts.
Growth in emerging markets, changing regulatory frameworks, accelerated R&D, and advances in treatment and manufacturing technologies all contribute to shifting strategies at the brand, company and industry level. This research helps AstraZeneca understand how its end-to-end manufacturing and supply chain operation is reacting to these trend-to-ends, identify areas or processes that magnify the impact of the this demand variability and propose a set of
recommendations to mitigate the risks. This is a critical business need that supplements internal studies to define what it means to be a world class pharmaceutical supply chain and organization
by 2025.
1.2.1 Expanding Pharmaceutical Industry
The growth of emerging markets is an exciting challenge for pharmaceutical companies as more patients across the globe gain access to life-saving medical treatments. The Financial Times defines an emerging market as one in a developing nation where there is a potential for high income with investment, but with high risk [26]. AstraZeneca's estimated 2018 financial results indicate that emerging markets are 1/3rd of global sales, up from 18% in 2012 [6]. The
industry expects this trend to continue with growth in emerging markets outpacing growth in developed nations.
These markets are attractive to major pharmaceutical companies as growth opportunities because of three factors; the ability to launch products in all phases of their lifecycle, changes in disease patterns and low-cost manufacturing operations. While the potential financial upside can be great, there are challenges with underdeveloped health systems, fluid market dynamics, and lack of expertise that can result in failure. One pharmaceutical executive expressed the risk of a one-size fits all strategy for entering emerging markets, "Our biggest mistake was treating emerging markets like mature markets. We were wrong. Pharmaceutical strategies have to fit a country's individual needs and development" [26].
The inability to use established processes for forecasting, market launches, supply chain design and brand strategies all introduce additional risks to the external supply chain. The requirement to adjust to and handle multiple, different strategies depending on the market increases complexity in all functions. The unknows associated with emerging markets increase the variability in forecasted demand compared to established markets. Several pharmaceutical companies have expressed the need to develop more flexible supply chains and accurate
forecasting processes to help mitigate some of the risk associated with emerging markets being a major proportion of company sales.
1.2.2 Shifting Supply Chain Risks at AstraZeneca
In 2012, AstraZeneca refocused their corporate strategy on "returning to growth through science led innovation" to address the growing number of products reaching the end of their patent life and stagnant market
growth. This has led to a I 2005-2010 (industry) U 200S-2010 (AZ)
U 2013-201S(industry) U 2012-2016(AZ)
significant increase in research and
development programs, regulatory -filings, new products and market
launches. One of the main drivers 71
51 46 59 66
of the growth is the development
and implementation of the 5R 1 2 1
0
-framework in the R Preclinical Phase I Phase I Phase III Overall Figure 3- Project Success Rate by Phase Following 5R Implementation [21]
organizations and focus on the three main therapy areas. The five Rs are right target, right patient, right tissue, right safety, and right commercial potential. From 2012 to present, AstraZeneca has transformed into the most productive R&D company in the pharmaceutical industry. Figure 3 compares the percentage of products that are successful in each R&D phase. It highlights the improvement of R&D productivity at AstraZeneca after the implementation of the 5R framework and how they are outperforming the industry in each phase, including nearly 5x the productivity overall.
Today, the effect of the 5R framework is exemplified through the healthy product pipeline. With over 150 products in the pipeline, the scope of the development includes New Molecular Entities (NME), life cycle management programs and combination treatments with other products, including products from other pharmaceutical companies. Life cycle management programs are clinical trials to identify new or expanded indications for existing products while combination treatments are collaborations between two different products and can include collaborations with other pharmaceutical companies. The product portfolio is more focused on the three therapy areas which is reflected in clinical trial programs. Figure 4 provides an
overview of the extensive clinical trial program for NMEs and lifecycle management programs. An additional 28 combination therapy trials are in progress but not shown. [7]
New Molecular Entities Pipeline Lifecycle Management Pipeline
6 6
I
Phase Iq*Phase III
m Under Review
22
Figure 4 -AstraZeneca Current Clinical Trial Program
In 2018, AstraZeneca had 18 regulatory approvals [3] compared to 3 in 2009 [2]. Since the introduction of Breakthrough Therapy designations' by the U.S. Food and Drug Administration
(FDA) in 2012, seven AstraZeneca products have been granted this designation for accelerated
' Breakthrough Therapy designations are awarded by the FDA to drugs that treat a serious or life-threatening condition and preliminary evidence indicates the drug is significantly better than other treatments available in clinical trials.
development. In addition, a total of 20 products were granted orphan2 designation. These are all
clear evidence of the increased strength and productivity of R&D at AstraZeneca over the past six years. Additionally, approximately 50% of the pipeline is within the oncology therapy area.
[7] This creates increased risk of demand variation due to the large number of lifecycle
management programs and the variation and expansion of the target patient population in the oncology area. The acceleration of R&D growth, intense focus on specialty care treatments and number of product launches has fundamentally changed the supply chain risk profile, generating a new set of challenges GES must manage. The largest of these risks is the potential for sustained or increased levels of long-term demand variability.
When GES was formed in 2006, it was focused on blockbuster primary care drugs. The company was just beginning to outsource more manufacturing and handled on average less than eight regulatory approvals per year. Today, the organization has been coping with massive amounts of change in response to the increased R&D productivity, expansion of active brands and more technically challenging and expensive products. The supply change risk profile has changed due to:
" Increasing complexity of products requiring on average double the Good
Manufacturing Practice (GMP)3 steps and specialty manufacturing processes * Increasing API costs resulting in excess inventory being a large financial burden * Shifting to specialty medicine introducing more variability into the target patient
pool over the lifecycle of a product compared to primary care treatments.
" Accelerated commercialization due to new regulatory frameworks and desire to
reach patients faster
A report published in 2016 by Drug Discovery Today analyzes data from twelve pharmaceutical
companies from 1995 - 2015. The report indicates that many of the trends AstraZeneca is
experiencing related to emerging markets, affordability and a shift towards specialty care
2 Orphan Drugs designation is meant to accelerate the development of diagnosis or treatment of rare diseases or
conditions that effect less than 200,000 people in the U.S. or would be too expensive to be commercially viable. Regulatory and financial support are available.
' Good Manufacturing Practice is the set of systems, practices and policies that are the guidelines for producing pharmaceutical products among many others. GMP is required by drug regulatory agencies to authorize and approve the manufacturing of a product and/or facility.
products are industry wide [10]. While AstraZeneca is ahead of its competitors in R&D productivity, the supply chain, technology and price challenges are critical to address for the future success of the company.
The current operational model of GES does not efficiently handle the updated supply chain risk profile. As the organization begins to stabilize after years of change and adjustments in reaction to shifting industry needs and corporate strategies, the timing is right to step back and examine the processes and operational model to determine what is required to efficiently and effectively meet the needs of the current and future product pipeline. With the goal to deliver maximum value to the patients and provide the stability for AstraZeneca's future operations,
GES is in the position to redefine their strategy to become a world class supply chain
organization. The development of an operational model that meets the new supply chain risk profile with a focus on flexibility and agility is a critical step.
1.2.3 Contract Manufacturing Industry for Pharmaceuticals
Contract manufacturing is a contractual relationship in which a company manufactures a good or material for a specific customer as part of their overall manufacturing operation. These companies are referred to as Contract Manufacturing Organizations (CMOs) and provide manufacturing, R&D and process development services. This type of outsourcing is a common strategy for pharmaceutical companies to defer some of the financial and chemical
manufacturing risks to the supplier. In exchange, the company takes on supply chain and product quality risks associated with working with external parties. As the variety of products and
volume of demand increase, pharmaceutical companies can find the necessary capacity and technology without requiring new facilities or equipment. This reduces time to market and converts capital investments into a variable product cost. Registered Starting Materials (RSMs) and intermediates are the most commonly outsourced manufacturing processes, with API manufacturing at CMOs continuing to grow.
A 2012 PharmalQ report on contract manufacturing estimated that 77% of pharmaceutical
companies work with CMOs and that for the following planning year (2014), 44% cited controlling operating costs as the most important factor when considering their CMO strategy. The ability to accelerate the commercialization process, reduce manufacturing costs and gain access to specialized technical processes and techniques are among the most cited reasons
companies are increasing their business with CMOs. Another trend that highlights the scale industry growth is the surge in CMOs opening in the Asia-Pacific region, creating a new market of suppliers for pharmaceutical companies to work with. Many pharmaceutical companies
altered their strategy to include CMOs in China and India to gain cost advantages associated with lower overhead and labor costs. [22]
Today, rising costs and quality concerns with the Indian and Chinese CMO industries have led to many pharmaceutical companies shifting their operations back to European and North American CMOs. Interviews with three of AstraZeneca's CMOs highlighted that in the 2000s, the CMO industry was primarily concentrated in Europe and North American with these
companies investing heavily to meet the growing demand. The shift toward eastern suppliers left them with excess capacity. In the last few years, however, they have experienced a resurgence in demand for their services, requiring companies in some cases to reserve manufacturing capacity up to two years in advance. The suppliers interviewed attributed some of the shift back to the west to quality concerns with the eastern suppliers and the technical capabilities of the western CMOs. These CMOs are the preferred partners to work with in a majority of cases. A large number of small and mid-size customers filled capacity in the 2000s and are still competing for capacity today. These customers typically have 1 - 10 products and are working with the CMOs
because they have limited or no internal manufacturing capability and desire their process
engineering capabilities. To complicate matters, the CMOs' customers' needs have also changed. The CMOs existing business strategy for working with large pharmaceutical companies centers on utilization of large volume manufacturing assets, annual campaigns and long lead time ordering.
A shift in supply chain and manufacturing strategy in major pharmaceutical companies
requires a similar shift in the CMO industry. As a central part of most major pharmaceutical company's manufacturing strategy, CMOs need to be viewed as a critical feature of the
manufacturing system to create sustainable change to meet the market needs. Flexibility, agility and technical expertise are all requirements expressed by major pharmaceutical companies to meet the needs of their patients and manufacturing complexity resulting from the industry trends explained in sections 1.2.1 - 1.2.3. Several CMOs have exhibited the ability to create innovative
CMOs and major pharmaceutical companies is required to create a lasting shift in the CMO industry and move from transactional industry to a partnership model for more critical manufacturing stages.
1.3 Problem Statement
As AstraZeneca transitions from a traditional primary care product portfolio to a highly innovative, specialty care portfolio, demand forecasting becomes more critical to ensure that maximum value is added through the external supply network. Employee experiences in the last few years indicate that increase in technical complexity, cost, lifecycle management programs and number of new product and market launches has increased the variability in long-term forecasts. The most visible result is poor inventory performance for new products. This ties up valuable cash in inventory that could otherwise be used for R&D and clinical trial programs. The research hypothesis is that unexpected demand variability negatively impacts the external supply chain and is caused by a combination of the demand forecasting process and supply chain
processes and policies.
The purpose of this research is to develop a method to assess the financial and non-financial impacts of demand variability on the external supply chain and identify opportunities to reduce the impact on the external supply chain. Based on discussions with key stakeholders,
recommendations should be focused on reducing the impact of demand variability, not a reduction in variability due to the forecasting process. The forecasting process is not in scope because there are on-going efforts to improve the process by GSC&S and GPPS. In addition, the existence of high levels of variability during initial NPI years is a base assumption due to the nature of the pharmaceutical industry and product launches.
The two primary goals of the research are listed below. Specific research objectives associated with each goal are outlined to divide the work into meaningful sub-goals.
* Develop a method to assess and quantify the impact of demand variability on the external supply chain and manufacturing operations
a. Identify sources of variation that result from internal policies related to forecast utilization and communication
b. Assess the current state supply chains and external manufacturing operations
within the case study framework. Identify opportunities for improvement. c. Utilize external benchmarking and literature review to build a set of test cases
for commercial arrangements. Benchmark change management strategies within a supply base
* Identify process improvements and/or strategies for AstraZeneca and external suppliers to mitigate the impact of demand variability.
a. Develop a set of characteristics that define a successful supplier partnership
b. Assess alternative commercial arrangements and identify areas to mitigate the
forecast variability risk.
c. Identify opportunities for increased flexibility in manufacturing system
The research objectives and goals break the problem statement into defined questions based on the context and motivation for the research. While not inclusive of all the work completed during the course of this research, it clarifies the areas that are of most interest and require deep study to be able to meet the success criteria outlined in the problem statement.
2 Literature Review
This research explores the use of simulation tools and supply chain strategies to measure the impact of the bullwhip effect. This includes connecting demand variability to inventory
performance, and methods for mitigating its effect. There exists an extensive body of research on methods for quantifying the bullwhip effect and supply chain simulation methodologies. The intent of the literature review is to generate baseline knowledge on current methods used in each of these areas. Much of the work is focused on simple, two-stage supply chains, which does not capture the network or regulatory complexities that are introduced in most major drug substance manufacturing supply chains. Sections 2.1 - 2.3 summarize the current trends and research to develop a framework to analyze the impact of demand variability and assess potential mitigation strategies.
2.1 The Bullwhip Effect: Measuring and Mitigation
The bullwhip effect is a well-documented phenomenon in supply chain management that seeks to explain the increase in demand variability as you move upstream in the supply chain. There is an extensive body of research proving the existence of the bullwhip effect, how to identify it and then mitigate its effects. It has been widely observed that manufacturing industries and supply chains with multiple echelons are at a higher risk of experiencing the bullwhip effect. In the last decade, there has been an increased interest in using analytical methods to help better categorize and measure the impact of the bullwhip effect.
Lee et. al. (1997) provides an overview of the four main causes of the bullwhip effect and five strategies to mitigate its impact. The article cites demand forecast updating, order batching, price fluctuations and shortage planning as the main causes of the increased variation upstream
in the supply chain [16]. To counteract this effect, they suggest a framework focused on
information sharing, channel alignment and operational efficiency. Lee expands on this research further through a detailed study on the role of information distortion in generating the bullwhip effect [17].
Forecast accuracy and updating contributes to the bullwhip effect through distorting the demand signal to the supply chain. These are initial target improvement areas because they are the responsibility of the customer generating the demand information and ordering and therefore
easier to address since it is internal. Research by Ali et. al. (2012) simulated a two-stage supply chain to study the connection between forecast accuracy and inventory performance. The results of the study indicated that the percentage reduction in inventory levels is less than the reduction in forecast error and the cost savings will be less than the cost avoidance associated with
inventory holding [1]. Goodwin addresses the cost saving versus avoidance challenge by expanding the scope of analysis to include indirect costs of forecast errors as well as the limitations of existing metrics [12]. This work expands on the earlier work by Lee et.al. (1993) that measured the total cost of forecast error and identified correlations between different types and sources of error to total cost [19].
2.1.1 Mitigation Strategies
Information sharing has been proven empirically to be one of the most effective measures for reducing inventory and cost-control in supply chains experiencing bullwhip. Walmart's Retail Link program is a point-of-sale data summary for suppliers that provides direct access to valuable demand data across many stages in their supply chain. It is one of the most celebrated and cited cases of demand information sharing resulting in positive financial impacts for the customer [18]. Lee, So and Tang (2000) uses analytical models to estimate the value of information sharing in a simple, two-stage supply chain. For supply chains where the retailer bears the full cost of providing reliable supply, the retailer does not experience direct benefits from information sharing. However, the results showed that there are tangible inventory reductions and associated cost-savings at the manufacturers [18]. These cost savings are amplified when lead times are longer. This study provides a strong allegory for the
pharmaceutical industry where the drug manufacturer bears all risk associated with stock-out or shortages, but Contract Manufacturing Organizations (CMOs) are involved in some or all of the manufacturing supply chain. A study by Raghunathn (2001) supports similar conclusions for non-stationary demand when point-of-sale data is shared.
Reduction of lead times is the other common method to reduce the bullwhip effect. The reduction in lead time limits the time delay from the actual demand to the supply chain nodes. Direct reductions can be achieved through streamlined ordering processing, manufacturing planning improvements or manufacturing time improvements. In-direct reductions enable shorter lead times, but still require the same amount of manufacturing time. These can be achieved
through dual-sourcing and inventory design. A simulation study of a semi-conductor supply chain by So et. al. (2003) showed that suppliers with variable lead times result in high variability in order quantity and this is exacerbated when demand is also highly variable [25]. Earlier research by Watson (1987) found that when demand is lumpy, like campaigns in
pharmaceuticals, the inventory volume and holding costs were increased to be able to achieve similar customer service levels for smooth demand [27].
2.1.2 Measuring Bullwhip: Current Methodologies
The increased prevalence of analytical tools in operations research has led to the
development of methods to proactively estimate and measure the impact of the bullwhip effect. Combining demand and ordering variance information with simple supply chain design
characteristics, models have been developed to estimate the expected variability. There are a variety of methodologies that have been used to measure the expected variance due to the bullwhip effect. For the purpose of this research, analytical and simulation methodologies that seek to either measure the extent of bullwhip or its impact are of interest.
Studies by Chen et.al. (2000) [5] and Fransoo et.al. (2000) [9] provide analytical methods that focus on estimating how much bullwhip a particular supply chain will experience based on demand behavior and supply chain characteristics like lead time. In addition to estimating the expected level of bullwhip, it is also critical to measure the expected impact to understand the potential future benefits of actions taken to reduce the bullwhip. Three studies provide different methods to measure the impacts including information sharing (Li et. al. 2006 [20]), forecasting methods (Campuzano-Bolarin et. al. 2011 [4]) and measuring bullwhip in practice (Jin et.al.
2017 [15]).
2.2 Supply Chain Simulation Software
For over 60 years, simulation has been used in manufacturing and business applications and is a widely accepted methodology in operations research. A comprehensive review of academic papers from 2006 - 2010 published in the European Journal of Operational Research suggests that the use of simulation in supply chain management and strategy applications is increasing and while discrete event simulation is still the most common application, system dynamics and hybrid applications are becoming more commonplace [14].
This review highlights several key trends in simulation application and strategies in operations research that were utilized during the course of this research. The most critical observation is that discrete event simulation (DES) alone does not achieve the same level of stakeholder engagement as other methods on their own or combining DES with other methods for a hybrid simulation. The use of system dynamics combined with DES can be a powerful tool for providing enterprise-wide solutions, engage a broad range of stakeholders and provide strategic value, not just analytic. [14]
A case study on the Mexican automotive industry highlights the benefits of using a hybrid
simulation to improve performance in a complex supply chain. A simulation software was used to develop a tool based on DES and system dynamics to optimize the supply chain for order fulfilment. The study captures how introducing system dynamics into the simulation strategy identifies key variables in complex environment quickly and can be a powerful tool for rapid analysis and stakeholder engagement for strategic changes. [24] Selecting an appropriate simulation software that fits your application is the first step.
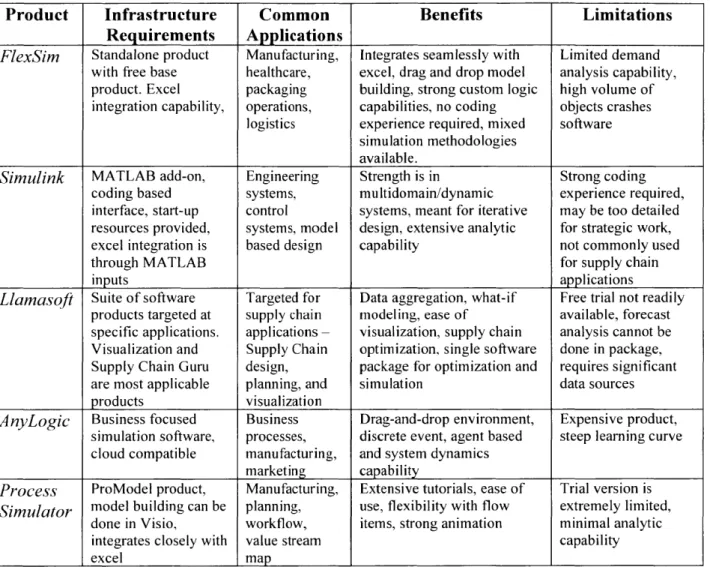
An internet search returns over a dozen commercially available simulation software products that are advertised for supply chain applications. Based on feedback from LGO students, product websites and tools previously or currently used within AstraZeneca, five products were reviewed and summarized in Table 1. The observations were collected based on
feedback from people who have used the software as well as trying the trial versions of the software packages. The extensive product offering shows that simulation is becoming an
increasingly important tool in supply chain management for optimization, performance analysis and strategic decision making.
Table 1 -Summary of Select Simulation Software Packages
Product Infrastructure Common Benefits Limitations
Requirements Applications
FlexSim Standalone product Manufacturing, Integrates seamlessly with Limited demand with free base healthcare, excel, drag and drop model analysis capability, product. Excel packaging building, strong custom logic high volume of integration capability, operations, capabilities, no coding objects crashes
logistics experience required, mixed software simulation methodologies
available.
Simulink MATLAB add-on, Engineering Strength is in Strong coding
coding based systems, multidomain/dynamic experience required,
interface, start-up control systems, meant for iterative may be too detailed resources provided, systems, model design, extensive analytic for strategic work,
excel integration is based design capability not commonly used
through MATLAB for supply chain
inputs applications
Llamasoft Suite of software Targeted for Data aggregation, what-if Free trial not readily products targeted at supply chain modeling, ease of available, forecast specific applications. applications - visualization, supply chain analysis cannot be Visualization and Supply Chain optimization, single software done in package, Supply Chain Guru design, package for optimization and requires significant
are most applicable planning, and simulation data sources
products visualization
AnyLogic Business focused Business Drag-and-drop environment, Expensive product, simulation software, processes, discrete event, agent based steep learning curve cloud compatible manufacturing, and system dynamics
marketing capability
Process ProModel product, Manufacturing, Extensive tutorials, ease of Trial version is
Simulator model building can be planning, use, flexibility with flow extremely limited,
done in Visio, workflow, items, strong animation minimal analytic
integrates closely with value stream capability
excel map
2.3 Engaging the supply base - Transactions to Partnerships
A supply chain partnership is a relationship between a supplier and their downstream customer in which both parties obtain greater value through close integration. A transactional
relationship, one based on a contract, is the most common type of relationship seen in supply
chains and in most cases is sufficient to meet the needs to both parties while running successful
businesses. A supply chain partnership is most beneficial when the manufacturing process is
complex, the overall system is dynamic where a high level of information exchange and
interaction between parties results in higher performance based on the defined set of metrics. A
partnership is indicative of more than just collaboration. A collaborative relationship is a
A review of the literature exhibits a strong understanding of the benefits of supply chain
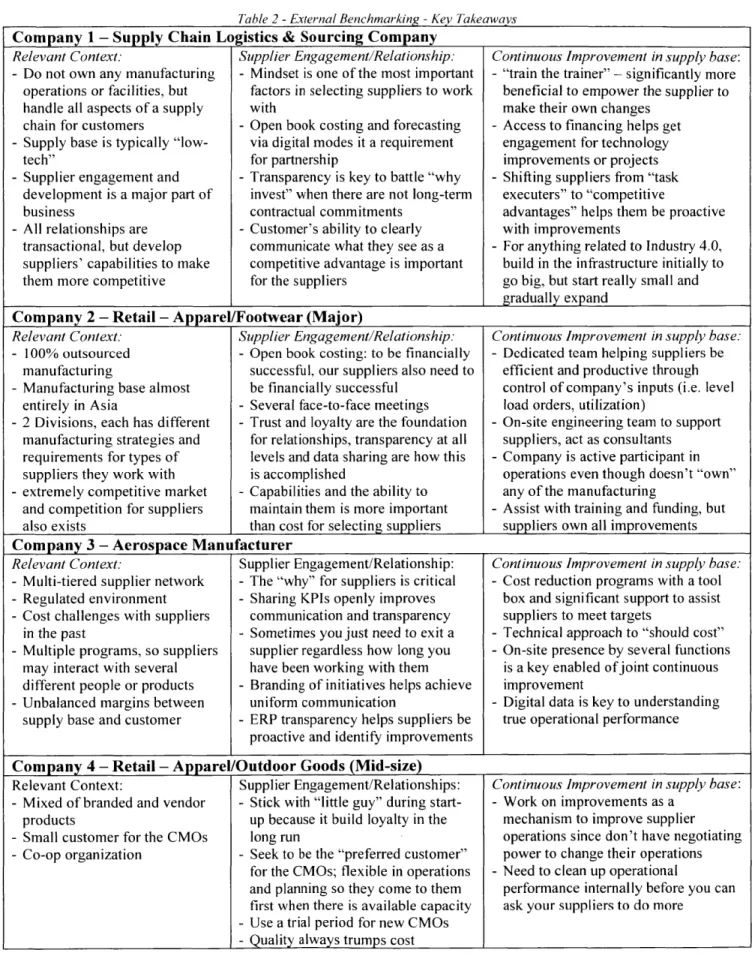
partnerships, there is limited information defining the specific characteristics of a partnerships and how to develop one. He, Gallear and Ghobdian made a strong case that trust, commitment, interdependence, shared meaning and balanced power are the key characteristics of a supply chain partnership [13]. While the case study presented supports their conclusions, those five traits are hard to define and understand how to develop. For this reason, external benchmarking was completed to better understand how companies develop partnerships and achieve the transformation through change management practice. Discussions with the suppliers indicated that there were two aspects to engaging and developing additional value in their supply chains
Table 2 -External Benchmarking -Key Takeaways
Company 1 - Supply Chain Logistics & Sourcing Company
Relevant Context:
- Do not own any manufacturing
operations or facilities, but handle all aspects of a supply chain for customers
- Supply base is typically "low-tech"
- Supplier engagement and
development is a major part of business
- All relationships are
transactional, but develop suppliers' capabilities to make them more competitive
Supplier Engagement/Relationship: - Mindset is one of the most important
factors in selecting suppliers to work with
- Open book costing and forecasting via digital modes it a requirement for partnership
- Transparency is key to battle "why invest" when there are not long-term contractual commitments
- Customer's ability to clearly communicate what they see as a competitive advantage is important for the suppliers
Continuous Improvement in supply base: - "train the trainer" - significantly more
beneficial to empower the supplier to make their own changes
- Access to financing helps get engagement for technology improvements or projects
- Shifting suppliers from "task executers" to "competitive
advantages" helps them be proactive with improvements
- For anything related to Industry 4.0, build in the infrastructure initially to go big, but start really small and gradually expand
Company 2 - Retail - Apparel/Footwear (Major)
Relevant Context: Supplier Engagement/Relationship: Continuous Improvement in supply base: - 100% outsourced - Open book costing: to be financially - Dedicated team helping suppliers be
manufacturing successful, our suppliers also need to efficient and productive through
- Manufacturing base almost be financially successful control of company's inputs (i.e. level
entirely in Asia - Several face-to-face meetings load orders, utilization)
- 2 Divisions, each has different - Trust and loyalty are the foundation - On-site engineering team to support
manufacturing strategies and for relationships, transparency at all suppliers, act as consultants
requirements for types of levels and data sharing are how this - Company is active participant in
suppliers they work with is accomplished operations even though doesn't "own"
- extremely competitive market - Capabilities and the ability to any of the manufacturing
and competition for suppliers maintain them is more important - Assist with training and funding, but
also exists than cost for selecting suppliers suppliers own all improvements
Company 3 - Aerospace Manufacturer
Relevant Context: Supplier Engagement/Relationship: Continuous Improvement in supply base: - Multi-tiered supplier network - The "why" for suppliers is critical - Cost reduction programs with a tool
- Regulated environment - Sharing KPIs openly improves box and significant support to assist
- Cost challenges with suppliers communication and transparency suppliers to meet targets
in the past - Sometimes you just need to exit a - Technical approach to "should cost"
- Multiple programs, so suppliers supplier regardless how long you - On-site presence by several functions
may interact with several have been working with them is a key enabled ofjoint continuous
different people or products - Branding of initiatives helps achieve improvement
- Unbalanced margins between uniform communication - Digital data is key to understanding
supply base and customer - ERP transparency helps suppliers be true operational performance
proactive and identify improvements
Company 4 - Retail - Apparel/Outdoor Goods (Mid-size)
Relevant Context: Supplier Engagement/Relationships: Continuous Improvement in supply base:
- Mixed of branded and vendor - Stick with "little guy" during start- - Work on improvements as a
products up because it build loyalty in the mechanism to improve supplier
- Small customer for the CMOs long run operations since don't have negotiating
- Co-op organization - Seek to be the "preferred customer" power to change their operations
for the CMOs; flexible in operations - Need to clean up operational
and planning so they come to them performance internally before you can
first when there is available capacity ask your suppliers to do more
- Use a trial period for new CMOs
The external benchmarking was a great opportunity to put some experience behind what is commonly shared in literature and industry regarding developing partnerships and strengthening organizations. Building trust through transparency, open communication and information sharing are not unique to supply chain operations but understanding the "how" behind these concepts is critical to be able to put these concepts into practice. The key takeaways from the four
companies are summarized below.
" A clear value proposition for suppliers on why they should change behaviors is critical
for success. This includes understanding what makes them competitive in the eyes of their customer.
" Branding a change program is a powerful change management tool because it enables
consistent communication across all levels, helping to support universal understanding " Figure out what you do as a customer that causes problems for your suppliers
" Every company mentioned that cost was not a major factor when selecting suppliers they
would be in more strategic relationships with.
" You cannot live by a contract in a partnership. There needs to be flexibility, which cannot
be written into a supply agreement.
" Understanding your suppliers' operations is key to understanding how to best leverage
them and actually understand their performance. Data sharing is a requirement and it should only be data that is interpretable and useful (not all of it).
The benchmarking takeaways will be critical for understanding the non-financial impacts of demand variability and potential mitigation strategies. They also address some of the key
research questions around what it means to be a strategic supplier and how to develop these relationships. Supplier engagement can be one of the most difficult aspects of supply chain management, but also one of the most impactful. The external benchmarking exercise
highlighted how investing in supplier relationships and the tools and infrastructure that enable it positively impact the supply chain and manufacturing operations across multiple functions.
3 Approach
The research goals of this project are both diagnostic and strategic in nature. With the environment in pharmaceuticals and AstraZeneca changing rapidly, there is a need to develop an understanding of the existing processes, methodologies and operations used in forecasting and supply chain execution to be able to effectively develop a method of analysis and define strategic opportunities. The research was separated into three phases - data collection and current state analysis, modeling and simulation, and test case analysis and recommendations, which are summarized in sections 3.1 - 3.3. The phases help guide the research process to prevent any
existing predispositions or bias internal to AstraZeneca or within the supply base from coloring the research.
A case study approach is utilized to narrow the scope to allow for depth of analysis rather
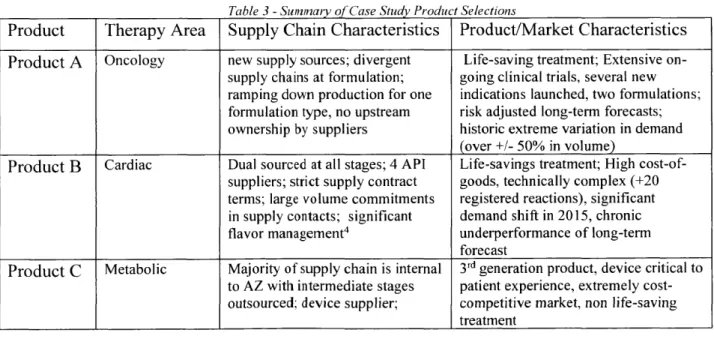
than breadth across the entire product portfolio. Two primary products and an auxiliary product were selected to be included in the research. The products were selected based on an initial review of the characteristics of high volatility products and feedback from stakeholders across multiple organizations. An overview of product characteristics is summarized in Table 3. Product
A and B are the primary focus of research, while Product C provides alternative product and
supply chain characteristics for qualitative comparison.
Table 3 -Summary of Case Study Product Selections
Product Therapy Area Supply Chain Characteristics Product/Market Characteristics
Product A Oncology new supply sources; divergent Life-saving treatment; Extensive on-supply chains at formulation; going clinical trials, several new ramping down production for one indications launched, two formulations; formulation type, no upstream risk adjusted long-term forecasts; ownership by suppliers historic extreme variation in demand
(over +/- 50% in volume)
Product B Cardiac Dual sourced at all stages; 4 API Life-savings treatment; High cost-of-suppliers; strict supply contract goods, technically complex (+20 terms; large volume commitments registered reactions), significant in supply contacts; significant demand shift in 2015, chronic
flavor management4 underperformance of long-term
forecast
Product C Metabolic Majority of supply chain is internal 3rd generation product, device critical to
to AZ with intermediate stages patient experience, extremely cost-outsourced; device supplier; competitive market, non life-saving
treatment
4 Flavor management is the management of different varieties of a product based on where it is manufactured and
The case study framework provides the focus to collect relevant data through process reviews, statistical analysis and employee interviews to define the current state of manufacturing and supply chain operations for AstraZeneca. The "voice of the supplier" is the other major source of data. With such a large percentage of the supply chain outsourced, understanding the role of the supplier in the operation and the relationship with AstraZeneca is a critical data set. Three suppliers were selected to be included in this research henceforth referred to as Supplier A, B and C. Basic overview information on each supplier can be found as part of the interview summary in Table 7 in section 4.4. The suppliers were selected because they are responsible for manufacturing material for Product A and B, have a significant volume of manufacturing for AstraZeneca and are viewed as strategic suppliers by GES.
3.1 Data Collection and Current State Analysis
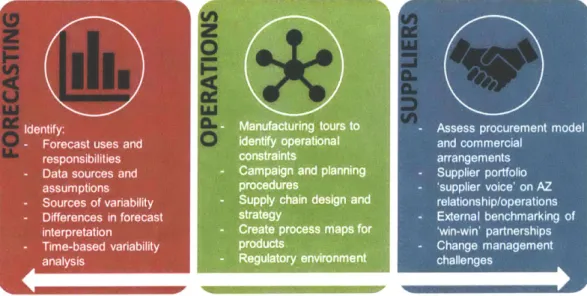
This stage is exploratory in nature, covering the breadth of operations that interact with, support or contribute to the external manufacturing operations. Forecasting, operations and supplier relationships are critical pieces to understanding the supply chain and how it reacts to demand signals. These three functional areas were identified through the literature review and discussions with critical stakeholders as either sources or recipients of forecast variation. An in-depth study of internal policies and procedures at AstraZeneca is utilized to define the current state for the three case study products. Product A and Product B were also analyzed from the supplier's perspective to capture the manufacturing planning, supply chain operations and relationship aspect for the two products.
.. . .. . . . . . .. .. Fr r ng tours FrAmo
Forecast ussad.:M17perationa Iadcmeca
responsibilities ' nstraints arne et
Data sources anmpdig and planning -Sple otoi
assumptions ~procedures supirvceonA
Sourcesof varabili- Supply chain design and rltoshipoeain
Differeces in orecaststrategy -Etra ecmrigo
interpretation- Create process maps for 'i-i'prnrhp
Time-baed varibilityproducts Chnemaget
analysis ~ ~ Regulatory environment calne
Figure 5 identifies the key research areas within each function that focus the current state analysis. This data is aggregated and summarized through a series of process maps, interview tables and observations to be used as evidence in the impact assessment. The outcome of the analysis provides the data required for the analysis of demand variability and the baseline operation to test potential improvements against. A bulk of the research time is spent in this phase on data collection, aggregating and mapping to allow for ease of interpretation, access and use in later phases of research. The outcome is a valuable body of knowledge for the
organization, providing a wholistic view of the supply chain and manufacturing processes that has been operating in a siloed manner.
The supplier relationship function could not be assessed and understood through solely reviewing procedures and policies internal to AstraZeneca. Employee interviews were completed with Suppliers A, B and C and site visits were made to Supplier A and B. These interviews were with business development leaders, project managers and relationship managers at the suppliers and example types of questions that were asked are listed below. Exact questions were tailored to the individual and were provided a minimum of three days prior to the scheduled interview.
* What is the company's competitive advantage or value proposition?
" Are there any trends or major challenges the pharmaceutical Contract Manufacturing
Organization industry is facing today compared to a decade ago?
" Can you provide an overview of what the operational model the company uses for
working with AstraZeneca? Is this the same or different from other customers? How is performance measured?
" Reflecting on the working relationship with AstraZeneca, what works well? What
could be improved?
" What are some of the challenges of launching a new product from a supplier
perspective?
" How do you use the forecasts provided from AstraZeneca? How do changes impact
operations?
In addition to these interviews, on-site manufacturing tours, and attending various meetings (on-site, at the Macclesfield campus or virtual) provided context to characterize the relationship between AstraZeneca and each of the suppliers. These additional activities also provided useful
understanding of how the relationship might differ across functions and levels in the organizations.
3.2 Modeling and Simulation
The intent of this phase is to develop a methodology for measuring the impact of demand variability on the external manufacturing operation. A simulation strategy and tool are used to develop a model that simulates how the forecasts interact with the supply chain design. The model will be designed for high level estimates of the financial impact of supply chain strategies through tracking the value of the API inventory stock. The model should be easily reconfigurable
and at a high enough level that it can be used for basic analysis across any small-molecule brand that GES manages. Ease of use and understanding were traded-off for accuracy which follows with the goal of this being a decision assist tool. The model's key input should be the forecast data and supply chain design, while the primary variables are lead times, as these are the main areas that can be controlled by AstraZeneca.
A clear understanding of the forecasting supply chain design processes provides the
foundation for the models, including Product A and B case studies as the base case examples for use in model verification and interrogation. Due to data limitations and the non-standard process
for determining actual material purchase order volumes, a direct model to actuals comparison could not be used as a verification method. As an alternative, the historical ordering and
inventory trends were compared to the output and the difference between the models output and actuals was captured and reviewed to see if manual interventions completed could account of the differences.
The deliverable from this phase is a tool that enables users to quickly understand if a change in forecast or supply chain design would have an impact on the entire system. Since inventory is a standard financial measure, a "dollar per day" value can be placed on lead time improvements for a specific brand. This approach not only allows the user to gain a systems perspective on the supply chain operations, but also can be useful in estimating potential financial impact of an operational design change on inventory. Previously, this would have been difficult of AstraZeneca to estimate in a repeatable and scientific manner.