Validation of the Advanced Calculation Model SAFIR Through DIN
EN 1991-1-2 Procedure
Raul Zaharia
Department of Steel Structures and Structural Mechanics
The “Politehnica” University of Timisoara, Ioan Curea 1, Timisoara, Romania
Thomas Gernay
Department of Architecture, Geology, Environment and Civil Engineering University of Liège, Chemin des Chevreuils 1, Liège, Belgium
Abstract
The validation of advanced calculation models for the fire design is an important issue for computer code developers, designers and authorities. One approach consists in the comparison with experimental results, which are not always available or are not always useful, due to the lack of details about the input data or the results, or uncertainties about the boundary conditions. This paper presents the validation of the special purpose computer program SAFIR (2005) for structural fire analysis, through DIN EN1991-1-2 procedure (2010), which represents an alternative to the validation through fire tests.
1. Introduction
The fire resistance of steel, concrete and composite steel-concrete members may be determined using tabulated data or simplified methods based on formulas. When the situation is not covered by the simple methods, it is necessary to perform an advanced numerical analysis, using special purpose programs (advanced calculation models) able to perform a thermal and mechanical analysis of structures under elevated temperatures. One condition that these programs must fulfill refers to their validation, which can be performed through relevant test results. The German National Annex of EN 1991-1-2 (2010) offers an alternative to the validation through experimental results. This document presents a series of validation examples assembled in Annex CC, concerning: heat transfer for different sections and material properties, temperature induced expansion for different material laws, internal forces and stresses induced by thermal action and ultimate bearing capacity of elements. These examples include steel, concrete and composite steel-concrete sections. Each example offers a set of results and the acceptable tolerances for the results.
This paper presents the simulation of the examples of DIN performed with the computer software SAFIR. The aim is double: to validate the computer program and to have a critical view on the examples of DIN, which could be profitable for future validation exercises of other programs.
2. Validation
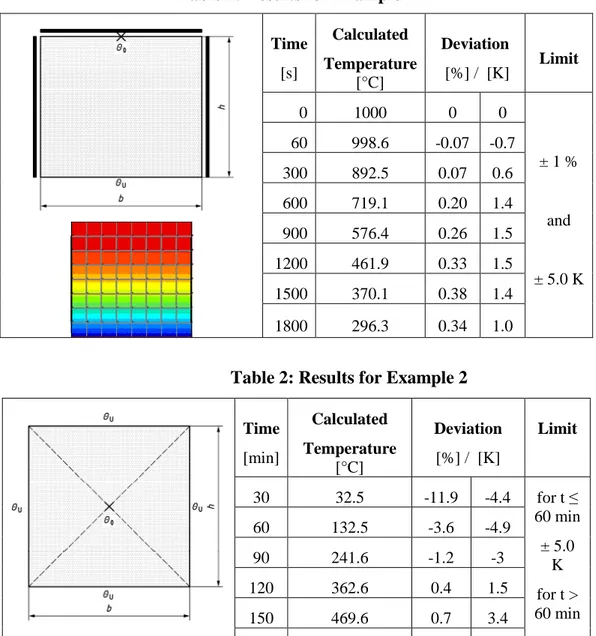
Annex CC of DIN EN1991-1-2 contains eleven validation examples. Example 1 analyses the heat transfer in the cooling process of a square section with given material properties (see figure and results in Table 1). The initial temperature of the section is 1000 °C. Three sides of the cross-section represent an adiabatic boundary, while the other side exchanges heat with a medium of which temperature is and remains equal to 0 °C, by linear convection and radiation. The limit deviations for the calculated temperatures in a selected point were satisfied for a 64 quad elements mesh, as given in the cross-section model figure of Table 1 (which presents the temperature distribution at 1800s).
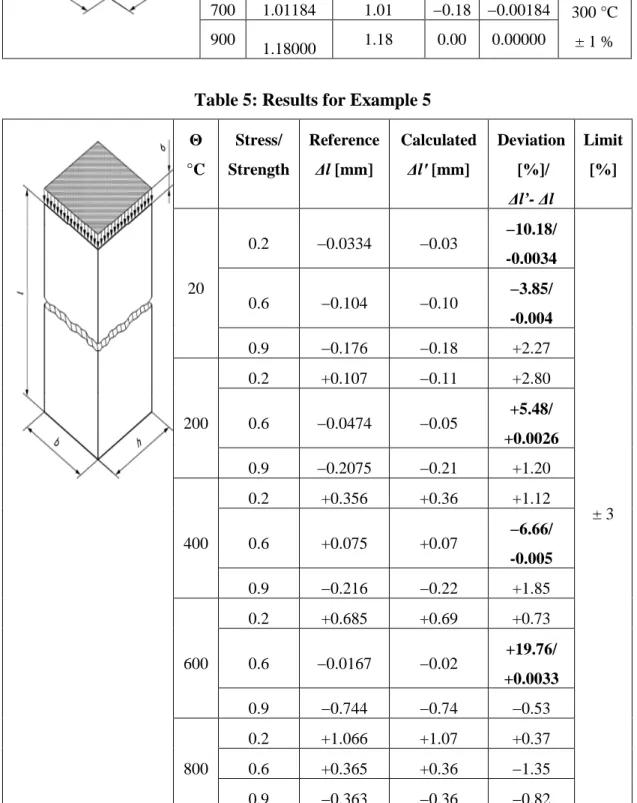
Example 2 analyses the heat transfer in the heating process of a square section with given material properties (see figure and results in Table 2). Similar to the above example, the initial temperature of the section is 0°C and the section is plunged into a medium having 1000 °C. The limit deviations for the calculated temperatures in the center point of the section were satisfied for a 576 quad elements mesh.
Example 3 analyses the heat transfer in a steel hollow section, filled with a material for which the thermal properties are known, with an initial temperature of 0 °C, plunged into a medium having 1000 °C (see figure and results in Table 3). The limit deviations for the calculated temperatures in the center point of the section were satisfied for a 324 quad elements mesh.
Example 4 analyses the thermal induced expansion ∆l of a steel element with given dimensions, at different values of homogenous temperature in the cross-section (see figure and results in Table 4).
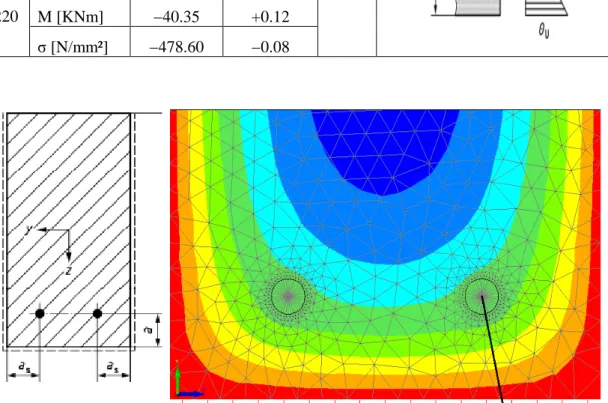
Example 5 analyses the elongation of a cantilever with a height of 10 cm and a square cross-section made of steel or concrete, for different uniform temperature distributions at some given stress-strength ratios (see figure and results in Table 5). The mechanical properties of concrete and steel under elevated temperatures are those given in the corresponding Eurocodes (EN 1992-1-2, 2005; EN 1993-1-2, 2005). For the steel cantilever, all results fit well within the prescribed deviation limits. The results presented in Table 5 are only for the concrete cantilever and some deviations from the limit values are emphasized. It must be noted that the results are of very small values, the problem here being the number of digits that the software can provide. The higher deviations from the limit are obtained for the values of the elongations that are very close to 0 (E-02 milimeters, which corresponds to the number of digits that SAFIR offers for the values of displacements in millimeters) for which the opposite thermal and mechanical deformations are almost the same. For the cases in which the limit deviation is not satisfied, the difference between the calculated and reference values of the displacements are given in Table 5. It may be observed that the differences in terms of absolute values are very small, the maximum value being 5E-03 millimeters. The same problem related to the number of digits that the software can provide for the values of the displacements in millimeters may be observed in Example 4, but in this case all calculated values were within the deviation limits, because the values of the elongations were higher.
The aim of Example 6 is to determine the load bearing capacity at different temperatures of the structural steel and concrete elements of Example 5. For steel, a perfect fit of the reference and calculated values was obtained. For concrete, only a slight difference for one case was obtained, which fit well in the limits, see Table 6.
In Example 7, for a fixed steel beam subjected to thermal loading and having a square cross-section of 100x100 mm, the calculation of the internal forces N and M as well as of the stress σ are demanded (see figure and results in Table 7). Two cases of temperature distribution are considered: uniform temperature distribution of 120 °C in the section and linear variation of temperature on the height of the cross-section, of 20/220 °C in the top/ bottom fiber, respectively. An analysis of the results presented in Table 7 reveals an amazing situation: only the axial force calculated by SAFIR for one of the load cases does not fit within the deviation limits, while all other values offer deviations which are extremely low compared to the limits (including for the stress, which considers the effect of the axial force).
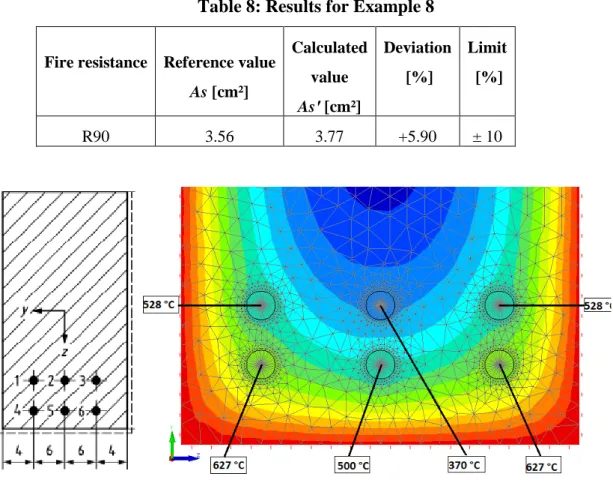
Example 8 analyses a weakly reinforced simply supported concrete beam loaded with uniform distributed load, subjected to fire on three sides. The cross-section of the beam is given in Fig. 1. The purpose is to determine the necessary area for the two rebars S500, in order to reach the fire resistance class of 90 minutes. Fig. 2 shows the mesh adopted in the numerical model in the neighborhood of the rebars.
A temperature of 544 oC is obtained in the reinforcement, which presents a deviation of -3.2% from the reference value of 562 oC. It must be emphasized that the limitation of the deviation refers only to the area of the reinforcement and, as shown in Table 8, this criteria is fulfilled.
Example 9 is similar to Example 8, with the difference that in this case, the same concrete beam is strongly reinforced (see Fig. 3). Fig. 4 shows the mesh in the area of the rebars and the temperature values in these rebars. For this case also, the criteria refers only to the area of the reinforcement, and this criteria is fulfilled, as shown in Table 9. The calculated temperatures in the rebars present a deviation that ranges between -0.54% and -4.76%, compared to the reference values.
Example 10 analyses a reinforced concrete column loaded with a vertical load having an eccentricity and a uniformly distributed horizontal load (see figure and results in Table 10). The reference results, for which a limit deviation is provided, are: the fire resistance time, the top horizontal displacement and the bending moment at the base of the column after a fire time t = 90 minutes. The criteria are fulfilled for all requested results. The maximum deviation of the calculated temperatures in the rebars is of -3.33% from the reference ones.
The last example analyses a composite column with partially encased steel section, subjected to fire on four sides (see figure of the cross-section and results in Table 11). The column is centrically loaded and a parabolic imperfection with peak value of l/1000 is considered. The reference results, for which a limit deviation is provided, are: the fire resistance and the horizontal displacement at the mid-span of the column at t = 30 and 60 minutes. The deviation of the calculated temperatures from the reference ones, given at 90 minutes, is of -4.11% for the rebars and of +1.79% for the center of the steel profile.
The criterion is not fulfilled for the displacement corresponding to 60 minutes of ISO fire. As was the case in Example 7, this deviation is not consistent with the other results. The displacement at 60 minutes is lower than the reference value (-8.18%), while for 30 minutes the displacement is slightly higher (+0.82%). It would be expected that lower displacements lead to a higher failure time, which is not the case here, the calculated failure time is lower than the reference one.
Table 1: Results for Example 1 62 68 74 71 34 37 46 44 24 28 37 34 16 18 28 24 10 13 18 16 6 7 13 10 2 4 7 6 1 3 4 2 46 51 63 60 37 39 51 46 28 29 39 37 18 22 29 28 13 15 22 18 7 9 15 13 4 8 9 7 3 5 8 4 51 53 66 63 39 43 53 51 29 32 43 39 22 25 32 29 15 20 25 22 9 14 20 15 8 12 14 9 5 11 12 8 53 62 71 66 43 50 62 53 32 41 50 43 25 31 41 32 20 26 31 25 14 21 26 20 12 19 21 14 11 17 19 12 44 46 60 57 50 56 68 62 41 47 56 50 31 40 47 41 26 33 40 31 21 30 33 26 19 27 30 21 17 23 27 19 68 72 77 74 56 65 72 68 47 55 65 56 40 49 55 47 33 42 49 40 30 38 42 33 27 36 38 30 23 35 36 27 72 76 79 77 65 73 76 72 55 69 73 65 49 59 69 55 42 54 59 49 38 52 54 42 36 48 52 38 35 45 48 36 76 80 81 79 73 78 80 76 69 75 78 73 59 70 75 69 54 67 70 59 52 64 67 54 48 61 64 52 45 58 61 48 Time [s] Calculated Temperature [°C] Deviation [%] / [K] Limit 0 1000 0 0 ± 1 % and ± 5.0 K 60 998.6 -0.07 -0.7 300 892.5 0.07 0.6 600 719.1 0.20 1.4 900 576.4 0.26 1.5 1200 461.9 0.33 1.5 1500 370.1 0.38 1.4 1800 296.3 0.34 1.0
Table 2: Results for Example 2
Time [min] Calculated Temperature [°C] Deviation [%] / [K] Limit 30 32.5 -11.9 -4.4 for t ≤ 60 min ± 5.0 K for t > 60 min ± 3 % 60 132.5 -3.6 -4.9 90 241.6 -1.2 -3 120 362.6 0.4 1.5 150 469.6 0.7 3.4 180 559.7 0.9 4.9
Table 3: Results for Example 3
Time [min] Calculated Temperature [°C] Deviation [%] / [K] Limit 30 337 -1.0 -3.5 ± 1 % and ± 5.0 K 60 721.7 0.6 4.6 90 885.3 0.4 3.7 120 952.7 0.2 2.1 150 980.5 0.1 1.2 180 992 0.0 0.3
Table 4: Results for Example 4 Θ [°C] Reference ∆l [mm] Calculated ∆l′ [mm] Deviation [%] / [mm] Limit 100 0.09984 0.10 0.16 0.00016 for Θ ≤ 300 °C ± 0.05 mm for Θ > 300 °C ± 1 % 300 0.37184 0.37 −0.49 −0.00184 500 0.67584 0.68 0.61 0.00416 600 0.83984 0.84 0.02 0.00016 700 1.01184 1.01 −0.18 −0.00184 900 1.18000 1.18 0.00 0.00000
Table 5: Results for Example 5
Θ °C Stress/ Strength Reference ∆l [mm] Calculated ∆l′ [mm] Deviation [%]/ ∆l’- ∆l Limit [%] 20 0.2 −0.0334 −0.03 −10.18/ -0.0034 ± 3 0.6 −0.104 −0.10 −3.85/ -0.004 0.9 −0.176 −0.18 +2.27 200 0.2 +0.107 −0.11 +2.80 0.6 −0.0474 −0.05 +5.48/ +0.0026 0.9 −0.2075 −0.21 +1.20 400 0.2 +0.356 +0.36 +1.12 0.6 +0.075 +0.07 −6.66/ -0.005 0.9 −0.216 −0.22 +1.85 600 0.2 +0.685 +0.69 +0.73 0.6 −0.0167 −0.02 +19.76/ +0.0033 0.9 −0.744 −0.74 −0.53 800 0.2 +1.066 +1.07 +0.37 0.6 +0.365 +0.36 −1.35 0.9 −0.363 −0.36 −0.82
Table 6: Results for Example 6 (concrete) Θ [°C] Calculated NR,fi,k’ [KN] Deviation [%] / [KN] Limit 20 -20.0 0 ± 3 % and ± 0.5 KN 200 -19.0 0 400 -15.0 0 600 -8.99 -0.11/0.01 800 -3.0 0
Table 7: Results for Example 7
Temperature load case Calculated value Deviation [%] Limit [%] 120/ 120 N [KN] −2587 +0.08 N: ± 1 M: ± 1 σ: ± 5 M[KNm] 0 0 σ [N/mm²] −258.73 +0.09 20/ 220 N [KN] −2457 −2.15 M [KNm] −40.35 +0.12 σ [N/mm²] −478.60 −0.08
Table 8: Results for Example 8
Fire resistance Reference value
As [cm²] Calculated value As′ [cm²] Deviation [%] Limit [%] R90 3.56 3.77 +5.90 ± 10
Figure 3: Example 9 Figure 4: Temperature distribution at 90 min
Table 9: Results for Example 9
Fire resistance Reference value
As [cm²] Calculated value As′ [cm²] Deviation [%] Limit [%] R90 9.76 9.28 -4.91 ± 10
Table 10: Results for Example 10
Requested results Calculated value Deviation [%] Limit [%] Failure time [min] 92 -1.08 ± 3 Displacement [mm] 405 +6.30 ± 15 Bending Moment [kNm] 74.93 -0.75 ± 5
Table 11: Results for Example 11 Requested results Reference value Calculated value Deviation [%] Limit [%] Failure time 92 88 −4.35 ± 5 Displ. [mm] 30 min 4.40 4.44 +0.82 60 min 5.50 5.04 −8.18 3. Conclusion
The results generally comply with the criteria and tolerances allowed by the DIN EN1991-1-2 procedure, thus demonstrating that SAFIR is a suitable advanced calculation model available for the structural analysis at elevated temperatures. For three examples, there are some deviations from the accepted limits. For one example of a concrete element with very small dimensions, the deviation is due to the number of digits that SAFIR could provide, for reference results with values smaller than one millimeter. For each of the two other examples, only one reference value was not within the limits, while all other results fulfilled the criteria, generally with very small deviations; there seems to be an inconsistency on the reference values for these two examples. It would be helpful to identify the origin of the procedure results. The paper could thus serve as a base for the validation of other computer software via the German national annex, an exercise that has so far not been performed systematically by all software written for the simulation of structures subjected to fire. It is to be mentioned that a program is not validated through the DIN procedure for all situations that may be considered in a structural fire analysis. For instance, for the thermal analysis, the effects of moisture or the presence of cavities in the cross-section are not covered by any example, while for the mechanical analysis only beam elements are considered. All examples are limited to 2D for both thermal and mechanical analysis.
4. References
[1] Franssen J. M. (2005), Safir – A thermal/structural program modelling structures under fire, Engineering Journal, AISC, Vol. 42, No 3, 143-158
[2] DIN EN 1991-1-2/NA (2010) National Annex - National determined parameter – Eurocode 1: Actions on structures – Part 1-2: General actions – Actions on structures exposed to fire, DEUTSCHE NORM
[3] EN 1992-1-2 (2005) Eurocode 2: Design of concrete structures – Part 1-2 – General rules – Structural fire design
[4] EN 1993-1-2 (2005) Eurocode 3: Design of steel structures – Part 1-2 – General rules – Structural fire design
[5] EN 1994-1-2 (2005) Eurocode 4: Design of composite steel-concrete structures – Part 1-2 – General rules – Structural fire design
![Table 11: Results for Example 11 Requested results Reference value Calculated value Deviation [%] Limit [%] Failure time 92 88 −4.35 Displ](https://thumb-eu.123doks.com/thumbv2/123doknet/5596230.134542/8.892.138.768.110.332/results-example-requested-results-reference-calculated-deviation-failure.webp)
