HAL Id: hal-02493499
https://hal.univ-lille.fr/hal-02493499
Submitted on 27 Feb 2020
HAL is a multi-disciplinary open access archive for the deposit and dissemination of sci-entific research documents, whether they are pub-lished or not. The documents may come from teaching and research institutions in France or abroad, or from public or private research centers.
L’archive ouverte pluridisciplinaire HAL, est destinée au dépôt et à la diffusion de documents scientifiques de niveau recherche, publiés ou non, émanant des établissements d’enseignement et de recherche français ou étrangers, des laboratoires publics ou privés.
Indicators
Laurent Sparrow, Hugo Six, Lauren Varona, Olivier Janin
To cite this version:
Laurent Sparrow, Hugo Six, Lauren Varona, Olivier Janin. Validation of Affect-tag Affective and Cognitive Indicators. [Research Report] Université de Lille. 2020. �hal-02493499�
Validation of Affect-tag Affective and Cognitive Indicators
Laurent Sparrow
1, Hugo Six
2, Lauren Varona
2, Olivier Janin
21 Univ. Lille, CNRS, CHU Lille, UMR 9193 - SCALab - Sciences Cognitives
et Sciences Affectives, F-59000 Lille, France
2 Neotrope, Tourcoing, France
Address correspondence to: [email protected] 2019
Abstract
The Affect-tag solution measures physiological signals to deliver indicators derived from cognitive science. In order to provide the most accurate and effective results, a database of electrodermal activity signals acquired using the Affect-tag A1 band was created. An experimental paradigm was designed to measure action-taking, autonomic regulation, cognitive load, emotions and stress, affects, and social stress. The Affect-tag Emotional Power, Emotional Density, and Cognitive Load affective and cognitive indicators were refined based on the physiological responses of 48 participants during these tasks. Statistical significance was obtained for all indicators in tasks they were designed to measure resulting in a total accuracy score of 89% for the combined indicators. Data obtained during this study will be further analyzed to define emotional and affective states.
Keywords: Electrodermal Activity, Bio-signals, Cognitive Load, Emotional States, Affective Computing, Wearable
1
Introduction
NEOTROPE is a design and creation laboratory made up of hardware, software, and cognitive engineers dedicated to providing scientifically based products to the global market. Specializing in the design, development, integration and publishing of electronic biometric measurement and software solutions for the processing of physiological data, NEOTROPE makes available intra- and interpersonal affective and cognitive indicators based on neuroscientific and cognitive principles for affective researchers in various fields.
Using principles of embodied cognitive and emotional functioning that can be objectively measured, NEOTROPE has created the Affect-tag solution. Where questionnaires and self-reporting on emotional and cognitive behaviors are subjective and are often difficult to interpret, Affect-tag captures the spontaneous
information about mental functions, affective states, and arousal. The relationship between physiological readings and mental functioning are well known and have been used for many years in academic research. Thanks to miniaturization and progress in signal processing algorithms, it is now possible to measure these mobile indicators with only a connected wristband device.
In order to strengthen the tools for validating the affective and cognitive indicators delivered by the Affect-tag solution and validate future indicators, the creation of a database of reference samples was necessary. Requirements for this sample included:
• data obtained using the Affect-tag system developed by NEOTROPE that measures electrodermal activity (EDA), cardiac activity (heart rate, HR) and acceleration (ACC)
subjected to different emotional stimuli at different levels
To carry out this sampling and to ensure that it complies as closely as possible with current scientific standards, NEOTROPE collaborated with the teams of the SCALab laboratory, Centre National de la Recherche Scientifique (CNRS), and the University of Lille on the Equipex IrDIVE platform for their methodological expertise, recruitment and procurement of samples, and rigorous criteria of measurements.
2
Theoretical Framework
2.1 Interpreting Physiological Signals
The body's electrodermal and cardiac responses can be transformed into indicators that provide information about the functioning of the peripheral nervous system (PNS). The acting arm of the Central Nervous System, the PNS (which includes the somatic and autonomic nervous systems) is able to control the functioning of the peripheral organs and ensure the internal balance of the body independently of any conscious control.
Consequently, HR and EDA are under the influence of both central commands (cognitive and/or conscious) and purely autonomous homeostatic processes (unconscious and triggered by subcortical centers). Among these, the limbic system acts as an interface between cognition and the autonomic division of the PNS: it controls many emotional behaviors, like defense behaviors (stress), aggressiveness, fear and pleasure. The limbic system is directly linked to the sympathetic branch of the autonomic nervous system (ANS).
In order to distinguish between the different branches and possible origins of the measured signal, a number of precautions must be taken when interpreting them. The most common solution used to control variability is to intentionally induce specific peripheral reactions and sample the signal immediately after stimulation. By comparing the responses obtained during this time window with those collected during other phases (such as those without any induced stimulation), it is possible to evaluate the effects of the stimulation on peripheral responses.
2.2 Physiological Response to Stimuli
The ANS manages the physiology of the body by balancing internal physical and chemical conditions (homeostasis). In the event of a provocation, the body's
resources are mobilized resulting in observable physiological changes. Therefore, if an individual is stimulated or stressed, a momentary physiological imbalance and return to balance will be observed (allostasis, McEwen et al., 2015) and tools exist to measure these direct changes in EDA and HR specifically.
A stressor representing danger or threat is accompanied by a particular configuration of brain electrical activity. This autonomic defensive reaction, commonly known as the fight or flight response, has a significant impact on the body (Cannon, 1927) which can be simulated in order to extract patterns of EDA and HR.
In humans, cardiovascular reactions to mental tasks generally result in increased blood pressure, faster heart rate, renal vasoconstriction, skeletal muscle vasodilation and decreased (or steady) vascular resistance (Callister, Suwarno & Seals, 1992). These responses are caused by an activation of the sympathetic branch of the ANS (Heidbreder, Ziegler, Heidland, Kirsten & Grüninger,1982). Since this branch also controls the activity of the sweat glands, it is therefore not surprising that mental activities also cause electrodermal reactions (Boucsein, 2012).
The EDA can be separated into its phasic and tonic components that yield information about specific processes. The phasic component, or Skin Conductance Response (SCR), measures rapid transient changes and is related to cognitive and emotional processes and arousal. The tonic component, or Skin Conductance Level (SCL), describes the background activity of the ANS and measures general activation and changes in cognitive processes (Dawson, Schell & Filion, 2007).
Although it is possible to objectively measure cognitive and emotional reactions using these physiological indicators, the majority of scientific studies do not distinguish the different functions involved in the tasks used or do not systematically study several physiological responses simultaneously in the same individual. This study was therefore carried out in order to allow cardiac and electrodermal measurements to be made by a single measuring device, the Affect-tag A1 band, and for the same individual confronted with different standardized tasks involving cognitive and affective functions.
Cognition is the set of mental processes that involve memory, language, reasoning, learning, intelligence, problem solving, decision making, perception and attention. All these processes enrich knowledge. The intensity with which these different functions are implemented can be measured and is referred to as cognitive load. The study of cognition is carried out using various scientifically validated and standardized experimental tasks.
The definition of affective functions is much more complex. Emotions are commonly referred to as emotions when they represent only a small part of the various emotional behaviors. Given the complexity of the field, it is necessary to rely on solid and recognized scientific foundations to implement this concept, such as the work of Scherer (2005), which is precise in defining the various concepts. According to him, there are 5 types of affect: emotions (anger, sadness, joy…), moods (being cheerful, dark, depressed...), interpersonal stances (being distant, warm, caring...), attitudes (sympathetic, affectionate, hateful...), and affect dispositions (nervous, anxious, thoughtless...). These different affects are complex to manipulate and control: emotions are intense and difficult to reproduce experimentally, while moods, postures and attitudes are personality traits that are stable over time but dependent on individuals and therefore difficult to control. On the other hand, affect dispositions are more accessible because they reflect tendencies to experience certain moods and types of emotions, even when the stimulation is low (Scherer, 2005). This definition opens the door to experimental and controlled manipulations because it is possible to create transient (sad, happy...) and moderate moods to objectively measure cognitive and affective functions using different experimental tasks. The results will produce distinct impacts on the physiological functioning of the body that can be measured and interpreted using electrodermal and cardiac indicators.
As mentioned above, these peripheral responses may come from a central control (cognitive or affective) but also from subcortical or autonomic commands. It is therefore necessary to add a task that specifically activates the ANS without the intervention of cognition or other central commands.
3
Design of Experimental Procedure
As mentioned above, SCV-Irdive and researchers at the SCALab laboratory designed and conducted a study
to collect physiological data using standard tasks from a representative sample of the population. These data, recorded using the Affect-tag band, were used to correlate specific configurations of physiological responses (electrodermal and cardiac activity) with specific psychological states induced by controlled experimental situations.
The psychological states studied are as follows: • Decision-making and action
• Cognitive load:
o Engagement of cognition in a task requiring large mental resources and involving memory, concentration, mental calculation
• Affective reactions:
o Emotional: situations with positive and negative valence, reactivity to unpleasant memories
o Social: surprise reactions to a situation of social pressure.
In addition to these main states, a provoked reflex reaction was also measured through breathing exercises to study autonomous physiological responses.
3.1 Decision Making & Reactivity
To measure cognitive engagement, decision making and reaction, the participant was prepared (engaged) to detect the appearance of a stimulus and then react by pressing a key on the keyboard. The physiological reactions indicate sympathetic activation with moderate inhibition of the parasympathetic system. The slope of tonic activation of EDA during the preparation phase is an indicator of the ability to mobilize cognitive resources. Behavioral response (reaction time) is also a relevant indicator.
3.2 Cognitive Load
Al-Shargie et al. (2016) showed that a mental calculation tasks based on addition and subtraction using 3 digits (i.e. 7 - 3 +1) from the Montreal Imaging Stress Task (Montreal Imaging Stress Task, Dedovic et al., 2005) provided typical hormonal, physiological and electroencephalographic responses to cognitive stress, particularly when the participant is under time pressure (Al-Shargie, et al., 2016). For this task, participants performed 25 increasingly difficult arithmetic operations and wrote the result on a sheet of paper. Compared to the previous task, there is a similar motor
component but with a much higher working memory load. In addition to noticeable and progressive sympathetic activation, inhibition of the parasympathetic system should also be observed, particularly on frequency indicators of cardiac variability. The accuracy of the responses can also be correlated with physiological indicators.
3.3 Emotional Tasks
3.3.1 Emotional Stress
A video showing the harmful consequences of dangerous and irresponsible driving has the ability to provoke emotional reactions in a systematic way. Sympathetic activation, especially in the phasic component of EDA and the low-frequency HRV, and a pronounced inhibition of the parasympathetic system is expected. Because of the immersive nature of videos in general, compared to static images, we expect physiological responses that are close to emotional stress. Since events with a strong emotional charge are better retained, three images presenting the faces of the actors in the video are presented at the end of the affective test. This allows testing the effect of the video on the felt emotions: if the participant experiences an emotion, the probability of obtaining physiological responses for these three faces will then be higher.
3.3.2 Affective Dispositions
Many studies have examined the effects of emotional stress on peripheral responses (see Kreibig, 2010, for a review). Different types of paradigms have been implemented (presentation of videos, standardized images, sounds, etc.) but the effects of these paradigms on physiological responses are quite modest and variable from one individual to another. However, under certain conditions the responses can be amplified. For example, when emotional inducers are images, EDA responses are more pronounced for large stimuli (Codispoti & De Cesarei, 2007) and when presented for more than 6 seconds (Codispoti, Bradley & Lang, 2001). Since EDA is also correlated with certain personality variables and anxiety can influence both SCL and SCR (Naveteur & I Baque, 1987), the level of anxiety of each participant must be assessed. This was done using the Positive and Negative Affect Schedule (PANAS, Watson, 1988) questionnaire.
3.3.3 Social Stress
In their paper, Kirschbaum, Pirke & Hellhammer (1993) defined a form of public speaking as a trigger for social stress (Trier Social Stress Test, TSST). This situation causes significant hormonal release (ACTH, prolactin, cortisol) and physiological changes (increase in HR) and are therefore comparable to emotional stress. It also provokes specific responses to phasic characteristics of EDA (mainly amplitude, but also frequency). However, the TSST requires conditions that are complicated to implement (presence of a jury of three people, audio equipment) and requires that the participants be standing and active, which causes motor activation that interferes with purely emotional responses. We used a test similar to the TSST and Sing-a-Song-Stress Test (SSST) that is simpler to implement and gives rise to the intended emotional response. In the modified SSST used in this experiment, the participant was asked to sing a song in the presence of the investigator. There was a countdown timer (5 seconds) for the activity during which social stress increases. However, as the counter reaches zero, the participant was told they did not have to sing after all. This situation is expected to cause sympathetic activation coupled with marked inhibition of the parasympathetic system.
3.4 Independent Tasks
Breathing exercises included asking the participant to rapidly inhale and slowly exhale. This pattern of breathing leads to parasympathetic activation and decrease sympathetic activation, as observed on EDA measurements (Cappo & Holmes, 1984). This breathing cycle specifically activates the parasympathetic system (Strauss‐Blasche et al., 2000; Hirsch & Bishop, 1981; Moser et al., 1994) because respiratory sinus arrhythmia (RSA) is influenced by breathing and is under the exclusive control of the parasympathetic system.
4
The Affect-tag Solution
After four years of research and development, NEOTROPE has created Affect-tag, a mobile solution for measuring affective and cognitive reactions using physiological data via a connected electronic bracelet. Every component of the solution has been designed and developed by the team: the hardware to capture physiological data, the signal processing algorithms to extract information, the mobile application to
synchronize context, and a cloud architecture for visualization of processed results.
4.1 Hardware and Raw Signal Validation
The Affect-tag A1 band, worn on the wrist like a watch, continuously records Electrodermal Activity (EDA), Heart Rate (HR), and Acceleration (ACC). Hardware components are medical grade sensors and materials, including 4mm Ag/Cl electrodes for precise EDA measurement and a silicon encasing for comfort and portability. The sampling rates are 20 Hz and 50 Hz for EDA and HR respectively. The band went through a series of in-house and external comparative tests to validate the physiological data acquisition precision using laboratory grade equipment. The wristband is connected to the Affect-tag mobile application via Bluetooth and transmits filtered EDA and HR which is displayed on the smart device in real time.
4.1.1 EDA
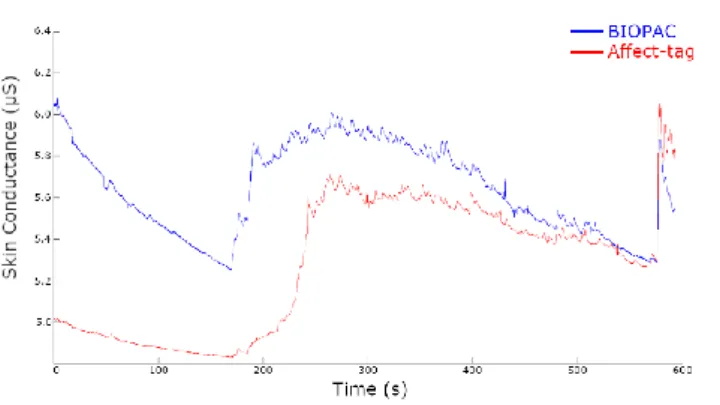
The current standard for measuring EDA is to use the physiological acquisition tool from BIOPAC Systems, Inc. Values for this device are precise and respond to quick changes due to sensors placed on fingertips and the addition of a gel to amplify the sensitivity of the measurements. The downside of this device is that it is cumbersome, is not mobile, and is expensive. A preliminary test was conducted with SCALab to verify the raw EDA data capture between BioPac and Affect-tag using a series of repeatable protocols to control for expected outcomes.
Visual inspection of the raw data acquisition shows comparable results between Affect-tag and BIOPAC (see Figure 1). The lower values registered with Affect-tag are expected since the use of a conducting gel is not used.
Figure 1: Raw EDA signals for a single participant simultaneously measured using BIOPAC and Affect-tag.
Correlation results from the comparison tests yielded the following results:
Table 1: Average correlation between Affect-tag and BIOPAC signals during specific tasks.
Correlation Affect-tag - BIOPAC Cognitive Stress 0.87 Social Stress 0.92 Rest 0.94 Overall 0.92
Based on these results we concluded that Affect-tag is suitable as a tool for measuring raw Electrodermal responses.
4.1.2 Affective and Cognitive Indicators
Neotrope has developed five affective and cognitive indicators in order to provide clear, straightforward results that represent the emotional experience. These indicators have been created and refined using data obtained in various experimental situations, including laboratory settings (e.g. product testing) and real-world settings (e.g. driving a car).
The indicators are:
Emotional Power (EP): From EDA, this indicator reflects the strength of emotional reactions and is calculated using the amplitudes of the EDA phasic peaks at a given time frame.
Emotional Density (ED): From EDA, this indicator reflects the frequency of emotional reactions and is calculated using the number of EDA phasic peaks at a given time frame.
Cognitive Load (CL): From EDA, this indicator reflects the amount of mental effort exerted and is calculated from the slow moving tonic components of EDA at a given time frame.
The creation of this database and purpose of this testing is to further refine specific parameters and minimize errors for each Affect-tag indicator.
5
Method
The study included 50 adults (25 males, 25 females) between the ages of 20 and 55 years old. All testing took place between May 2 and July 15, 2019. Recruitment was carried out in different locations in the north of France to diversify recruitment and all participants were paid 10€ for their involvement.
5.2 Procedure
Testing took place at the Imaginarium in Tourcoing, France and other local laboratories. Upon arrival, participants signed a consent form, the Affect-tag band was placed on the left wrist, and they were seated in front of a laptop computer. The participants completed the PANAS questionnaire to correct anxiety levels and their influence on physiological signals. All instructions and tasks were displayed using E-Prime without any operator intervention. A marker was used to align the physiological data acquisition from Affect-tag with the start of the E-Prime program and for each task.
The tasks were as follows: • Reaction time task • Breathing exercises • Mental calculation
• A video sequence, with negative valence • Several images, which may be pleasant or
unpleasant
• Affective memory task
• Social stress test (preparation to sing out loud) • A final calibration phase
A 60-second decompression phase occurred between each task. Table 2 outlines the progression of the tasks.
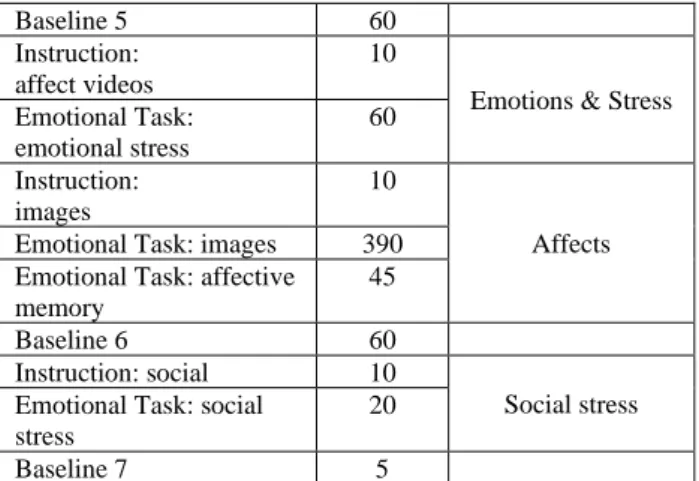
Table 2: Progression of emotional and cognitive tasks tested. The purpose of each phase and their lengths are noted. All participants followed a programmed paradigm with unvarying lengths.
Task time (s) Purpose
Introduction 10
Baseline 1 60 Calibration Instruction:
countdown and reaction
15
Reaction: decision and action taking Reaction Task 8 Baseline 2 60 Instruction: breathing 20 Autonomic regulation Breathing Tasks 120 Baseline 3 60 Instruction: mental workload 20 Cognitive Load Cognitive Load (weak) 30
Cognitive Load (strong) 60
Baseline 5 60 Instruction:
affect videos
10
Emotions & Stress Emotional Task: emotional stress 60 Instruction: images 10 Affects Emotional Task: images 390
Emotional Task: affective memory
45 Baseline 6 60 Instruction: social 10
Social stress Emotional Task: social
stress
20 Baseline 7 5
All data is anonymous and no participant information is retained except for age and gender.
5.3 Stimuli
5.3.1 Affects
The International Affective Picture System (IAPS, Lang et al., 2008) database was used for the video and image sequences based on 2 factors: valence (positive and negative) and activation (low and high). Each block of images had a mean valence score and a mean arousal score. These values (along with their standard deviations) are presented in table 3.
Table 3: Mean valence and arousal scores for the images taken from the International Affective Picture System used during the passive testing phases. Values in bold represent valence, values in italics represent arousal. The standard deviations are in parentheses.
Valence and Arousal Scores
low arousal high arousal positive valence 6.5 (0.3) 2.7 (0.1) 7.5 (0.2) 7 (0.3) negative valence 2.9 (0.6) 4 (0.3) 1.6 (0.2) 7 (0.2)
Five images were presented for each block for a total of 75 seconds per block. Between each block, two neutral images were presented in order to neutralize the emotion.
The affective memory task entailed showing images related to the video with negative valence shown just before. Three images, which included characters from the video, designed to evoke an emotional response were shown to participants in order to test the presence of affective memory
5.3.2 Cognitive Load & Autonomic Regulation
Tasks
The cognitive load tasks required participants to perform 25 arithmetic operations and record the result for each on a response sheet provided. This test allows for variation in mental load level by adjusting the complexity of the operations. The first 10 operations are very simple to perform (e.g. 2+1+4) while the final 15 are more complex (e.g. 3-9+7).
The breathing tasks involved a short period of inhalation, holding the breath, and a long period of exhalation because this respiratory time ratio increases cardiac parasympathetic tone. This method was adapted from Strauss-Blasche, et al. (2000).
6
Analysis
6.1 Data Preparation
Data from the first two participants were excluded due to procedure adjustments. Data for 24 males and 24 females was analyzed.
The precise timing for responses and execution of each task was imported from E-Prime in order to synchronize it with the physiological data from Affect-tag. Data for each individual was then stored into phases by task, with the image tasks being separated by each block and the mental calculation phases separated into “easy” and “difficult”. In order to remove the contamination of the previous block, the instruction phases were used as baseline.
6.2 Method Validation
In order to ensure the validity of each presented task, statistical significance was performed on the results. The following sections explain the validation method.
6.2.1 Anxiety Levels
The participants were asked to take the PANAS questionnaire in order to verify their capability to balance positive and negative affects. Analysis revealed that the distribution of scores on the positive scale is Gaussian and centered on a value slightly higher than the theoretical average. The distribution on the negative scale, however, is rectangular and centered on the minimum values of the scale. It can therefore be concluded that the population tested has rather positive feelings (mean = 27.39) without intrusion of negative
affects (mean = 13.06). This population therefore leans to a more positive affect.
6.2.2 Reaction Time
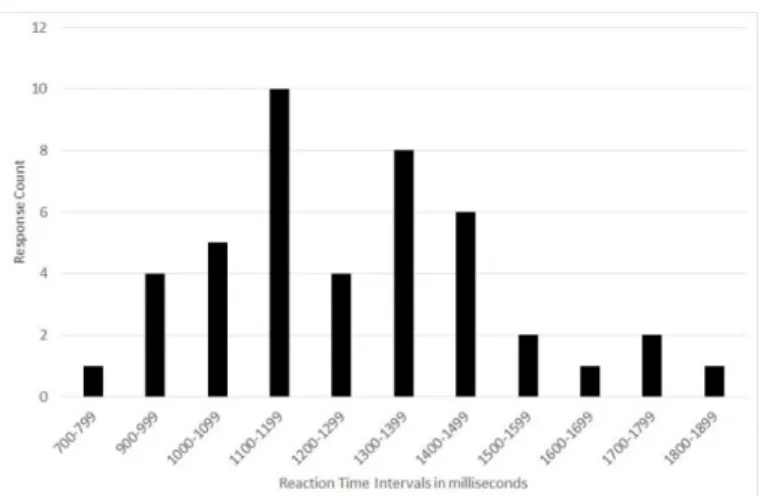
Analysis of the reaction times revealed that four participants did not complete the task as expected, the reaction times were too long for the type of task, indicating the response was not detected by the computer.
After removing these 4 participants from the global analysis, the distribution of results is asymmetric Gaussian. Therefore, the median was used as the central index rather than the average.
Figure 2: Number of participants vs. Average reaction time during the reaction time tests showing an asymmetric Gaussian distribution.
6.2.3 Calculation Task
The 25 arithmetic operations were separated into weak and strong levels of mental load. The success rate of the arithmetic problems for the weak mental load (mean = 84%) was statistically significant and lower than the success rate of the strong mental load problems (mean = 61, t(48) = -7.96, p-value = 0). The items chosen for this experiment therefore make it possible to create two very different levels of difficulty.
6.3 Affect-tag CogTech
The Affect-tag Cognitive Technology (CogTech) is first applied using the electronic components built into the wristband. The EDA is measured and transformed into readable data that are displayed in real-time on the Affect-tag mobile application.
For offline analysis, a “sanitation” algorithm was applied to the raw EDA signal in order to determine
signal quality and reconstruct data identified as artefacts. This algorithm includes correction of gaps or duplicate data entries and an application of a median filter to reconstruct artefacts identified as noise or movement artefacts. A Signal Quality Index (SQI) score was calculated for each data set for the length of the signal (mean = 95%) and for each separated phase of the data. A threshold is set for an acceptable level of correction; if there are too many artefact corrections in the signal and the SQI is too low, that phase of the data will not be included in the analysis. For optimization of indicators, the threshold for acceptable signal quality was a variable that was tested.
Affect-tag tonic algorithms extract the tonic component of the measured EDA signal by using a series of specially designed signal filters. The Ledalab Continuous Decomposition Analysis (CDA) method was used as the gold standard for EDA signal decomposition (Benedek & Kaernbach, 2010) for the development and refinement of the Affect-tag algorithms. From the Ledalab documentation: “this method extracts the phasic (driver) information underlying EDA, and aims at retrieving the signal characteristics of the underlying sudomotor nerve activity (SNA).” When correlated with the Ledalab CDA algorithms, the Affect-tag algorithms achieved a 98% correlation over 30 tests from data sets in multiple contexts. Before being displayed or recorded, an artefact detection algorithm is passed to remove artefacts in the tonic component based on signal shape and physiological feasibility.
The fast-changing phasic component peaks are detected using a set threshold level, time minimum between detected peaks, and achievable slope. Normalization is applied to both the tonic and phasic components in order to perform interindividual analysis and compare results across participants.
6.4 Accuracy Metrics
Before calculating the Affect-tag emotional indicators for each phase of the test, the expected outcomes by indicator were defined. For example, we expect to see a significant positive difference between the reaction task and baseline for Emotional Power but the same comparison is not of interest for Cognitive Load where a much longer time is needed to measure an effect. A summary of the expected outcomes for each task and the
baseline to which they were compared is shown in Table 6.
Some phases, such as Baseline 2, were omitted from the analysis due to possible contamination with data from other testing windows. This decision was made after the testing procedure was carried out and ensure the slow EDA changes have had ample time to return to baseline in between tasks.
To refine the algorithm that calculates the emotional indicators, certain parameters were altered in order to attain results that were congruent with hypotheses and significantly different. The following parameters were modified until an acceptable error emerged:
• SQI threshold
• Minimum peak detection threshold • Amplitude correction
• Stimulus window
• Minimum acceptable time between successive peaks
• Normalization method
7
Results
7.1 Validity of Passive Tasks
The analysis of the PANAS results revealed that the population tested was not balanced between positive and negative affect. Results for emotional measurements could therefore be skewed, with values for Emotional Power and Emotional Density not reflecting the general population. The test phases were therefore separated into “active” tasks and “passive” tasks, with the passive tasks being those using the valence and arousal media and the active tasks being the phases where participants were invited to perform an action. Since the analysis revealed the analysis of the passive tasks was not representative of the population, they have been ruled inconclusive.
7.2 Statistical Significance Tests
A two-sided Student t-test (t(46)=2.013) was performed for every test case listed in Table 6 in Appendix A.
The Emotional Power indicator reached significant differences for the reaction time task, breathing task, and all social stress situations (p-value < 0.05). There were no significant differences for the cognitive charge tasks or the arousal images; however, the results were consistent with expectations. The affective memory and negative valence tasks produced no effect.
The Emotional Density indicator reached significant differences for the reaction time task and cognitive charge tasks. There were no significant differences for the arousal images showed and social stress tasks but, however, the countdown part of the social stress tasks exhibited a trend towards significant (p-value = 0.059).
The Cognitive Load indicator reached significant differences for the social stress tasks and comparisons using high cognitive charge (p-value < 0.001). Only the comparison between baseline and low cognitive charge had a non-significant difference yet still exhibited a trend in the expected direction.
7.3 Accuracy Representation
For every test case, a score was assigned for each indicator based on the significance of the expected results. This permitted calculation of a weighted accuracy for each indicator in the active tasks for which they are essential. Below are the results for each indicator.
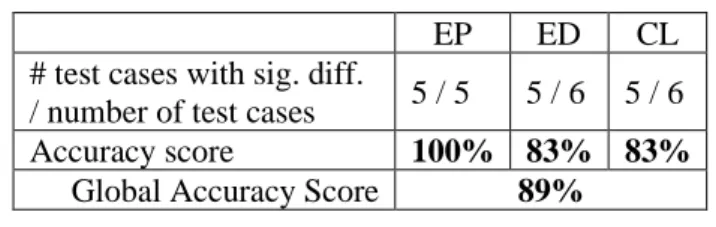
Table 4: Accuracy for each Affect-tag Emotional Indicator based on test cases with statistically significant results.
EP ED CL
# test cases with sig. diff.
/ number of test cases 5 / 5 5 / 6 5 / 6
Accuracy score 100% 83% 83%
Global Accuracy Score 89%
8
Discussion
In order to provide scientifically validated affective and cognitive indicators, it was important to create a database of expected physiological behavior. This database served as a basis for the refinement of the Affect-tag indicators which resulted in viable representations of emotional intensity, frequency, and cognitive load.
The database for the affective tasks remains inconclusive. Affective memory depends on the ability to call on the memory of details from a similarly emotional situation. To have a database that can be generalized to the population, a normal distribution of affective responses is required on the PANAS questionnaire. An acceptable database can be obtained by measuring additional participants that results in a normal distribution of affective sentiments.
Perhaps a redesign of the paradigm to measure affect is required to ensure an accurate database. The IAPS, for
example, was created for measuring certain pathologies versus control groups. This database consists of only a control group with no specific pathology to measure against.
For this study, only the EDA data was used to refine the Affect-tag indicators even though during the study, the heart rate was also recorded. Future work will take the heart rate and heart rate variability into account for creation and refinement of additional indicators and the separation of reactions into specific emotional states.
9
Conflict of Interest
The authors declare that there is no conflict of interest.
10 Acknowledgments
The authors wish to thank Antoine Deplancke for his help in software development and technical expertise.
References
Al-Shargie, F., Kiguchi, M., Badruddin, N., Dass, S. C., Hani, A. F. M., & Tang, T. B. (2016). Mental stress assessment using simultaneous measurement of EEG and fNIRS. Biomedical optics express, 7(10), 3882-3898.
Benedek, M. & Kaernbach, C. (2010). A continuous measure of phasic electrodermal activity. Journal of Neuroscience Methods, 190, 80-91.
Benedek, M. & Kaernbach, C. (2010). Decomposition of skin conductance data by means of nonnegative deconvolution. Psychophysiology, 47, 647-658.
Boucsein, W. (2012). Electrodermal activity. Springer Science & Business Media.
Brouwer, A. M., van Beurden, M., Nijboer, L., Derikx, L., Binsch, O., Gjaltema, C., & Noordzij, M. (2017, December). A comparison of different electrodermal variables in response to an acute social stressor. In International Workshop on Symbiotic Interaction (pp. 7-17). Springer, Cham.
Brouwer, A. M., & Hogervorst, M. A. (2014). A new paradigm to induce mental stress: the Sing-a-Song Stress Test (SSST). Frontiers in neuroscience, 8, 224.
Callister, R. O. B. I. N., Suwarno, N. O., & Seals, D. R. (1992). Sympathetic activity is influenced by task difficulty and stress perception during mental challenge in humans. The Journal of physiology, 454(1), 373-387.
Cannon, W. B. (1927). The James-Lange theory of emotions: A critical examination and an alternative theory. The American journal of psychology, 39(1/4), 106-124.
Cappo, B. M., & Holmes, D. S. (1984). The utility of prolonged respiratory exhalation for reducing physiological and psychological arousal in non-threatening and threatening situations. Journal of Psychosomatic Research, 28(4), 265-273. Codispoti, M., Bradley, M. M., & Lang, P. J. (2001). Affective
reactions to briefly presented pictures. Psychophysiology, 38(3), 474-478.
Codispoti, M., & De Cesarei, A. (2007). Arousal and attention: Picture size and emotional reactions. Psychophysiology, 44(5), 680-686.
Cuitún Coronado, J., Chandola, T., & Steptoe, A. (2018). Allostatic load and effort-reward imbalance: associations over the working-career. International journal of environmental research and public health, 15(2), 191.
Dawson, M. E., Schell, A. M., & Filion, D. L. (2007). The electrodermal system. In Handbook of psychophysiology (3rd ed, pp. 159–181). New York: Cambridge University Press. Dedovic, K., Renwick, R., Mahani, N. K., Engert, V., Lupien, S. J.,
& Pruessner, J. C. (2005). The Montreal Imaging Stress Task: using functional imaging to investigate the effects of perceiving and processing psychosocial stress in the human brain. Journal of Psychiatry and Neuroscience, 30(5), 319.
Heidbreder, E., Ziegler, A., Heidland, A., Kirsten, R., & Grüninger, W. (1982). Circulatory changes during mental stress in tetraplegic and paraplegic man. Klinische Wochenschrift, 60(15), 795-801.
Hirsch, J. A., & Bishop, B. (1981). Respiratory sinus arrhythmia in humans: how breathing pattern modulates heart rate. American Journal of Physiology-Heart and Circulatory Physiology, 241(4), H620-H629.
Kreibig, S. D. (2010). Autonomic nervous system activity in emotion: A review. Biological psychology, 84(3), 394-421. Kirschbaum, C., Pirke, K. M., & Hellhammer, D. H. (1993). The
‘Trier Social Stress Test’–a tool for investigating psychobiological stress responses in a laboratory setting. Neuropsychobiology, 28(1-2), 76-81.
Lang, P.J., Bradley, M.M., & Cuthbert, B.N. (2008). International affective picture system (IAPS): Affective ratings of pictures and instruction manual. Technical Report A-8. University of Florida, Gainesville, FL.
McEwen, B. S., Bowles, N. P., Gray, J. D., Hill, M. N., Hunter, R. G., Karatsoreos, I. N., & Nasca, C. (2015). Mechanisms of stress in the brain. Nature neuroscience, 18(10), 1353.
Moser M, Lehofer M, Sedminek A et al. Heart rate variability as a prognostic tool in cardiology. Circulation 1994; 90: 1078–82
Naveteur, J., & Freixa, I., & Baque, E. (1987). Individual differences in electrodermal activity as a function of subjects’ anxiety. Personality and Individual Differences, 8(5), 615–626.
Powell, D. A., Milligan, W. L., & Furchtgott, E. (1980). Peripheral autonomic changes accompanying learning and reaction time performance in older people. Journal of gerontology, 35(1), 57-65.
Scherer, K. R. (2005). What are emotions? And how can they be measured?. Social science information, 44(4), 695-729. Strauss‐Blasche, G., Moser, M., Voica, M., McLeod, D. R.,
Klammer, N., & Marktl, W. (2000). Relative timing of inspiration and expiration affects respiratory sinus arrhythmia. Clinical and Experimental Pharmacology and Physiology, 27(8), 601-606.
Watson, D., Clark, L. A., & Tellegen, A. (1988). Development and validation of brief measures of positive and negative affect: the PANAS scales. Journal of personality and social psychology, 54(6), 1063.
Appendix A – Comparisons by task
Table 5: Difference by task: The phases used as the baseline are listed in the first column and the tasks are listed in the second column. Each line represents a different test case (baseline vs. task) where the Affect-tag Emotional Indicators were compared. The last 3 columns separated by Affect-tag indicator include the mean difference in value between the two phases compared (EP = Emotional Power; ED = Emotional Density; CL = Cognitive Load, all indicators are expressed in percentages so the difference in value is also expressed in percentages).
Baseline Task ΔEP
(%)
ΔED (%)
ΔCL (%)
Baseline 1 Reaction Task 10.60 6.80 Instruction: breathing Breathing Task 2.23 0.66 -1.25 Baseline 3 Low Cognitive Charge 1.28 5.02 0.66 Baseline 3 High Cognitive Charge 3.85 8.44 4.05 Low Cognitive Charge High Cognitive Charge 2.57 3.42 3.39 Instruction: affect videos Video Task (negative valence) -2.90 -5.48 -0.35 Image: neutral Image: low arousal -1.19 0.21 0.44 Image: neutral Image: high arousal -0.94 -0.10 -1.22 Image: low arousal Image: high arousal 0.25 -0.31 -1.67 Image: neutral Affective Memory Task -2.63 2.02 -3.37 Baseline 5 Social Stress: instructions 11.22 3.55 5.90 Baseline 5 Social Stress: countdown 7.85 5.91 8.04 Baseline 5 Social Stress: singing 25.40 4.09 Baseline 5 Social Stress: all 13.35 4.36 9.81
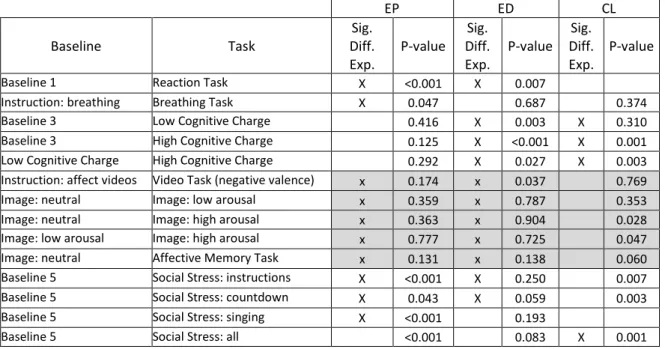
Table 6: Comparisons by task: The phases used as the baseline are listed in the first column and the tasks are listed in the second column. Each line represents a different test case (baseline vs. task) where the Affect-tag Emotional Indicators were compared. The last 3 columns separated by Affect-tag indicator include an “X” where there was a significant difference expected for that indicator (EP = Emotional Power; ED = Emotional Density; CL = Cognitive Load). The columns in grey are the passive tasks that incorporated images or video with positive or negative valence. These results were considered
inconclusive due to the affective tendancies of the population tested. It is to be noted that t(46)=2.013 for p=0.05.
EP ED CL Baseline Task Sig. Diff. Exp. P-value Sig. Diff. Exp. P-value Sig. Diff. Exp. P-value
Baseline 1 Reaction Task X <0.001 X 0.007 Instruction: breathing Breathing Task X 0.047 0.687 0.374 Baseline 3 Low Cognitive Charge 0.416 X 0.003 X 0.310 Baseline 3 High Cognitive Charge 0.125 X <0.001 X 0.001 Low Cognitive Charge High Cognitive Charge 0.292 X 0.027 X 0.003 Instruction: affect videos Video Task (negative valence) x 0.174 x 0.037 0.769 Image: neutral Image: low arousal x 0.359 x 0.787 0.353 Image: neutral Image: high arousal x 0.363 x 0.904 0.028 Image: low arousal Image: high arousal x 0.777 x 0.725 0.047 Image: neutral Affective Memory Task x 0.131 x 0.138 0.060 Baseline 5 Social Stress: instructions X <0.001 X 0.250 0.007 Baseline 5 Social Stress: countdown X 0.043 X 0.059 0.003 Baseline 5 Social Stress: singing X <0.001 0.193 Baseline 5 Social Stress: all <0.001 0.083 X 0.001