HAL Id: hal-01056993
https://hal.inria.fr/hal-01056993
Submitted on 21 Aug 2014
HAL is a multi-disciplinary open access
archive for the deposit and dissemination of
sci-entific research documents, whether they are
pub-lished or not. The documents may come from
teaching and research institutions in France or
abroad, or from public or private research centers.
L’archive ouverte pluridisciplinaire HAL, est
destinée au dépôt et à la diffusion de documents
scientifiques de niveau recherche, publiés ou non,
émanant des établissements d’enseignement et de
recherche français ou étrangers, des laboratoires
publics ou privés.
Leveraging Random Forests for Interactive Exploration
of Large Histological Images
Loic Peter, Diana Mateus, Pierre Chatelain, Noemi Schworn, Stefan Stangl,
Gabriele Multhoff, Nassir Navab
To cite this version:
Loic Peter, Diana Mateus, Pierre Chatelain, Noemi Schworn, Stefan Stangl, et al.. Leveraging
Ran-dom Forests for Interactive Exploration of Large Histological Images. Int. Conf. on Medical Image
Computing and Computer Assisted Intervention, MICCAI 2014, Sep 2014, Boston, United States.
�hal-01056993�
Leveraging Random Forests for Interactive
Exploration of Large Histological Images
Lo¨ıc Peter1, Diana Mateus1,2, Pierre Chatelain1,3, Noemi Schworm4, Stefan
Stangl4, Gabriele Multhoff4,5, Nassir Navab1,6
1
Computer Aided Medical Procedures, Technische Universit¨at M¨unchen, Germany
2
Institute of Computational Biology, Helmholtz Zentrum M¨unchen, Germany
3
Universit´e de Rennes 1, IRISA, France
4
Department of Radiation Oncology, Technische Universit¨at M¨unchen, Germany
5
CCG - Innate Immunity in Tumor Biology, Helmholtz Zentrum M¨unchen, Germany
6
Computer Aided Medical Procedures, Johns Hopkins University, USA
Abstract. The large size of histological images combined with their very challenging appearance are two main difficulties which considerably com-plicate their analysis. In this paper, we introduce an interactive strategy leveraging the output of a supervised random forest classifier to guide a user through such large visual data. Starting from a forest-based pixel-wise estimate, subregions of the images at hand are automatically ranked and sequentially displayed according to their expected interest. After each region suggestion, the user selects among several options a rough es-timate of the true amount of foreground pixels in this region. From these one-click inputs, the region scoring function is updated in real time using an online gradient descent procedure, which corrects on-the-fly the short-comings of the initial model and adapts future suggestions accordingly. Experimental validation is conducted for extramedullary hematopoesis localization and demonstrates the practical feasibility of the procedure as well as the benefit of the online adaptation strategy.
1
Introduction
Analyzing histological images is usually an extremely challenging task. Due to the complex appearance of objects of interest, the accuracy of fully-automatic techniques is generally insufficient for clinical use, e.g. in the case of mitosis detection [1] for which a variety of automatic approaches has been recently com-pared quantitatively [2]. In fact, the accurate identification of patterns within such images is often only achievable by well-trained human experts and remains prone to inter-experts disagreements in some cases [3]. Moreover, histological data are very tedious to process for a human because of their large dimension, which commonly reaches tens of thousands of pixels along each direction. When aiming at finding rare objects within images of this size, a manual search for these instances requires a painstaking exploration of the whole content, and a huge amount of time is spent scrolling through uninteresting background areas. To overcome this, we propose to leverage fully-automatic pixelwise classi-fication techniques to recover candidate areas of interest (i.e. where positive
Trainingkdata Largektestkslice Pre-trainedk randomkforest Initialkforest-basedkestimate Newkestimatek fromkuserkinput Selectkregionkofk interest Combinedk estimate User Notkavailablekatktestktime Training Testing Display Userkfeedback Interactionkloop ...
Fig. 1.Summary of our approach
instances are found), leaving the task of interpreting the visual content within these regions to an expert user. To this end, assuming that an available auto-matic method provides a label confidence at each pixel, an intuitive strategy would be to rank subregions of the images in decreasing order of confidence and display them accordingly one after the other. Having thereby patterns of interest shown early in the process, an exhaustive search would not be necessary any-more. However, such a scenario relies entirely on the accuracy of the automatic detector and can fail if the latter suffers from difficulties on the images at hand. In the case of detectors based on supervised learning procedures, difficulties may arise due to the common mismatches between the training and test data, caused by e.g. differences in noise or illumination. In this context, it would be beneficial to allow the user to interact after each suggestion (in particular after wrong ones) so that the procedure can be adapted to the characteristics of the test data and eventually avoid mistakes for the upcoming region suggestions.
Online transfer learning (OTL) frameworks [4, 5] address this problem by combining (i) a kernel-based classifier pre-trained on some source data, and (ii) an online classifier continuously trained on arriving instances from the tar-get data, given by the user input in our case. On the closely related problem of domain adaptation, an unsupervised algorithm based on Gaussian process regression was introduced to adapt the decision boundary of a face detector to a test image [6]. In the case of medical data, random forest classifiers [7, 8] demonstrated high accuracy and tractability and are especially used for their ability to handle high amounts of training data and descriptors. Although an online version of random forests exists in the literature [9], replacing the kernel classifiers of the OTL approach by forests is not straightforward: only few sam-ples are available to train the target classifier, and a forest-based OTL scheme would handle the source classifier as a whole, without exploiting the diversity and possibly heterogeneous relevance of its local models on the target data.
In this work, we introduce a regression-based method able to leverage the knowledge carried by a pre-trained random forest classifier to guide the user through the data by suggesting candidate regions of interest. Our approach ex-ploits the multiple partitionings of the feature space defined by the trained forest to perform local updates of the model from one-click inputs provided by the user.
Thereby, characteristics of the test data can be captured and future suggestions are adapted accordingly. These updates are performed in real time between two iterations and do not require the original training data, which makes our method particularly tractable for clinical use. Experimental evaluation is conducted on a high-resolution dataset for hematopoesis identification within mouse liver slices, as well as on synthetic deformations of it, and demonstrates the general feasibil-ity of our approach and the benefit of the adaption scheme.
2
Methods
We first summarize the general scenario of our approach. Let us consider a given set of images composed of pixels. Each pixel p has a true label y(p) ∈ {0, 1} and we aim at detecting the positive instances within our images, i.e. the pixels psuch that y(p) = 1. We make the assumption that a random forest classifier has been trained beforehand on some available labeled data and hence provides a probability PRF(y(p) = 1) ∈ [0, 1] for each pixel p. Here, we implicitly assume
that this forest has been originally designed for a binary classification task, but any multi-class forest could also be used by grouping as positive the labels considered as interesting for the given application. For tractability, the original training data is not made available during the whole process and is thus only encoded through this forest. In our scenario, a user runs this classifier which is based on prior data on a new set of images that are correlated but potentially slightly different, e.g. because of different imaging conditions. From the resulting pixelwise output, an area of interest, expected to contain positive labels, is then displayed to the user, who provides in return an estimate of the proportion of positive pixels actually observed. In doing so, the bias of the initial model can be progressively assessed and compensated to ultimately increase the relevance of the upcoming region suggestions.
Under these conditions, we can formalize our scenario mathematically. The test images are partitioned into a set of rectangular regions R = {R1, . . . , Rn}
whose sizes are tractable for a human user. At iteration k, i.e. after the user saw k − 1 regions, we proceed as follows:
1. The region ˆR ∈ R, maximizing a scoring function φk : R → R stating the
expected relevance of each region, is displayed to the user.
2. The user interacts to provide information about the content observed in ˆR. 3. Using this feedback, φkis updated, resulting in a new scoring function φk+1.
4. ˆR is removed from the pool of candidate regions R.
The initial scoring function φ1 is based on the initial random forest classifier
only. We summarize the random forest model in Sec. 2.1. In Sec. 2.2, we expose our choice of scoring functions φk and how they can be parametrized. Finally,
the update strategy of φk from the user inputs is described in Sec. 2.3.
2.1 Random Forest Model
Our approach uses a trained random forest classifier as starting point, which provides for each pixel p a probability of being a positive instance. A random
forest is a collection of T decorrelated binary decision trees. Each tree (indexed by t ∈ {1, . . . , T }) is a hierarchical collection of decision rules based on visual features, leading to a partition of the domain into l(t) leaves Lt,1, . . . , Lt,l(t).
Each leaf Lt,i contains a probability model πt,i ∈ [0, 1]. For each tree t,
ev-ery newly observed pixel p reaches exactly one leaf, and we will denote πt(p)
the corresponding probabilistic model. Averaging over trees, the final pixelwise probability provided by the random forest for each pixel p is
PRF(y(p) = 1) = 1 T T X t=1 πt(p) . (1)
We follow the standard procedure [7, 8] to train such a classifier, i.e. to infer the decision rules and the leaf models. Starting from a root node, the decision rules are recursively chosen within a set of randomly drawn splitting functions to maximize an information gain criterion. The proportion of positive training samples contained in a leaf defines its probabilistic model.
2.2 Region Scoring Function
In this subsection, we describe our region scoring model. Given a pixelwise esti-mate Pk(y(p) = 1) at iteration k, we define the relevance of a region R ∈ R as
the expectation of the proportion of positive pixels in R. Modeling the pixel la-bels as independent Bernoulli distributions of success probability Pk(y(p) = 1),
this expectation and hence the scoring function φk can be written as
φk(R) = 1 |R| X p∈R Pk(y(p) = 1) , (2)
where |R| denotes the number of pixels in the region R. In this work, we would like to define the pixelwise probabilistic model Pk as a combination of (i) the
prior knowledge acquired on training data that is encoded by the initial random forest classifier, and (ii) the k − 1 inputs provided by the user based on the test data. Therefore, we propose to obtain Pk(y(p) = 1) from the forest estimate
of Eq. 1 by adding to each prior leaf model πt,i a signed offset ǫkt,i ∈ R whose
value will be progressively adapted from the user inputs. Let us denote ǫk the
vector (ǫk
t,i)t,i and rewrite the scoring function φk(R) as φ(R|ǫk) so that this
parametrization clearly appears. Introducing this additive model in Eq. 2 and after some algebraic manipulations, the scoring function can be rewritten as
φ(R|ǫk) = φRF(R) + φnew(R|ǫk) , (3)
where φRF(R) is obtained by using the forest probabilistic output (Eq. 1) as
pixelwise model in Eq. 2, and
φnew(R|ǫk) = 1 |R| 1 T T X t=1 l(t) X i=1 ǫkt,iht,i(R) = hr, ǫki . (4)
In Eq. 4, ht,i(R) denotes the number of pixels p in R which reached the leaf Lt,i,
and r = ( 1 |R|
1
Tht,i(R))t,i. Before the user starts providing inputs, the ǫ 1
t,i are set
to 0 such that φ1 = φRF. As the user gives information after each suggestion,
the acquired knowledge is encoded through the leaf-dependent ǫk
t,ithat allow the
scoring function φk to vary around the initial model φRF. The next subsection
describes how these ǫk
t,i are inferred from the collected user feedbacks.
2.3 Online Model Update
After each suggestion of a region Rj, a feedback Puser(Rj) ∈ [0, 1] stating the true
proportion of positive pixels in Rj is requested from the user. We assume for the
sake of formalism that the exact proportion is given, but we will demonstrate in our experiments that providing a discretized approximation of this input does not decrease the performance (Tab. 1). This reduces drastically the necessary amount of interaction, since giving a discrete estimate of this proportion requires only one click from the user, whereas computing the exact value would involve a pixelwise region labeling. Note that this feedback does not provide any information at pixel level and hence excludes a direct update of the leaf statistics [9].
Assuming that k regions R1, . . . , Rk have been suggested and their respective
user inputs Puser(R
1), . . . , Puser(Rk) collected (k ≥ 1), we would like to find
a new scoring function φk+1, or equivalently a coefficient vector ǫk+1, which
matches with these k user inputs. Considering a squared loss function, we solve the following minimization problem
ǫk+1= argmin ǫ k X j=1 (φ(Rj|ǫ) − Puser(Rj)) 2 + λ kǫk2 , (5)
which can be rewritten from Eq. 3 and Eq. 4 as a linear ridge regression problem
ǫk+1= argmin ǫ k X j=1 (hrj, ǫi − δj)2+ λ kǫk2, (6)
where δj = Puser(Rj) − φRF(Rj). The regularization term aims at keeping the
deviation from the initial random forest classifier small and is driven by a hyper-parameter λ. The minimization problem defined by Eq. 6 is equivalent to a linear ridge regression problem with k training instances of feature vectors r1, . . . , rk
and labels δ1, . . . , δk, i.e. a regression problem at the region level. As a
conse-quence, Eq. 6 could be naturally extended to a kernel ridge regression problem if one desires to remove the linearity assumption. The solution ǫk+1of Eq. 6 can be
found in closed form [10]. However, computing this exact value at each iteration involves the computationally expensive inversion of a large matrix, which could force a user to wait between two suggestions of regions. Instead, we adopt an online gradient descent scheme [11] leading to the following incremental update rule:
ǫk+1= ǫk−1
λ(hrk, ǫki − δk) rk. (7) Thereby, the kth user input can be incorporated in real time in our model.
0 0.2 0.4 0.6 0.8 1 0 0.1 0.2 0.3 0.4 0.5 0.6 0.7 0.8 0.9 1
Proportion of slice displayed to the user
Propo rtio n of p osi tive p ixe ls f o un d
Global illumination change
0 0.2 0.4 0.6 0.8 1 0 0.1 0.2 0.3 0.4 0.5 0.6 0.7 0.8 0.9 1
Proportion of slice displayed to the user
Prop o rtio n o f p osi ti ve pi xe ls fou n d
Local illumination change
0 0.2 0.4 0.6 0.8 1 0.1 0.2 0.3 0.4 0.5 0.6 0.7 0.8 0.9 1
Proportion of slice displayed to the user
Prop o rtio n o f p osi ti ve pi xe ls fou n d Local blurring 0 0.2 0.4 0.6 0.8 1 0.1 0.2 0.3 0.4 0.5 0.6 0.7 0.8 0.9 1
Proportion of slice displayed to the user
Prop o rt io n o f p o si ti ve p ixe ls fo un d Real data
No update Strong supervision With update Strong supervision No update Weak supervision With update Weak supervision
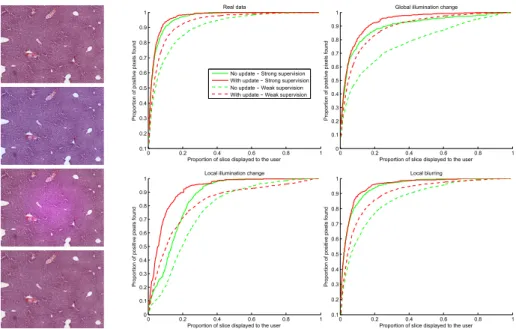
Fig. 2. ResultsThe curves display the average proportion of recovered positive pixels as a function of the proportion of the slice shown to the user. These experiments are driven under different synthetic conditions, examples of which are shown on the left. From top to bottom: real image, global illumination change, local illumination change, local blurring. The discretized version of the user input was used in these experiments.
3
Experiments
Dataset: Extramedullary hematopoesis, i.e. hematopoesis located outside of the bone marrow, is a rare event in human adults. Yet, in some animals like mice, its presence in the liver can be a reaction to an immense inflammation or to a tumor stimulating extensively the immune system of the organism [12]. Localiz-ing these relatively small lesions as well as estimatLocaliz-ing their number can be useful to compare the influence of different therapeutic strategies. 34 high-resolution images entirely labeled at pixel level were extracted from 8 mouse liver slices of resolution 0.498 µm/pixel. This restriction to subimages was necessary to obtain accurate labels from a pathologist, since a slice is typically too big (34200×21052 pixels) to be labeled entirely. Since images taken from a same slice share com-mon visual properties, we kept them together for training or testing. Images were downsized by a factor 3 to speed up the training and testing procedures.
Experimental Setup: We performed our experiments at two levels of supervision: (i) a standard leave-one-out strategy (strong supervision), where the initial ran-dom forest is trained on 7 slices (i.e. approximately 30 images) and tested on the 8th one, and (ii) the inverse setting where one trains only on one slice and
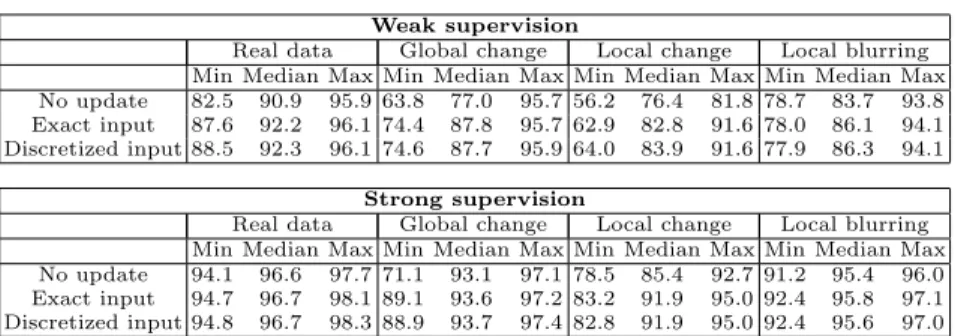
Table 1.Area under the curves in our different settings.
Weak supervision
Real data Global change Local change Local blurring
Min Median Max Min Median Max Min Median Max Min Median Max
No update 82.5 90.9 95.9 63.8 77.0 95.7 56.2 76.4 81.8 78.7 83.7 93.8
Exact input 87.6 92.2 96.1 74.4 87.8 95.7 62.9 82.8 91.6 78.0 86.1 94.1
Discretized input 88.5 92.3 96.1 74.6 87.7 95.9 64.0 83.9 91.6 77.9 86.3 94.1
Strong supervision
Real data Global change Local change Local blurring
Min Median Max Min Median Max Min Median Max Min Median Max
No update 94.1 96.6 97.7 71.1 93.1 97.1 78.5 85.4 92.7 91.2 95.4 96.0
Exact input 94.7 96.7 98.1 89.1 93.6 97.2 83.2 91.9 95.0 92.4 95.8 97.1
Discretized input 94.8 96.7 98.3 88.9 93.7 97.4 82.8 91.9 95.0 92.4 95.6 97.0
in practical situations due to the difficulty of obtaining pixelwise labels, it also suggests another application of our approach as a way to facilitate collecting hard-to-find positive samples to enrich an existing weak training set. Training samples were collected on a regular grid of step 30, resulting in approximately 500 k instances in the leave-one-out setup. Each pixel was described by its visual content at offset locations. We used the CIELab color space that we enriched with the output of a bank of filters [13]. 40 trees were grown without depth limit but with at least 10 training samples per leaf. The images were partitioned into regions of size 123 × 123 pixels, which fits to the size of usual hematopoesis patterns. If a hematopoesis pattern is not fully included in a displayed region, the field of view can be extended with a simple click revealing the next adjacent region in the indicated direction. We investigated ways to handle pools of regions of heterogeneous sizes, but this raised issues in terms of scoring function (finding a reliable rule that does not always favor the smallest or the largest regions is not straightforward) and evaluation. The retained solution requires almost no effort from the user and eventually seemed to be the most practical one.
Evaluation: Our approach aims at performing an interactive online adaptation to new imaging conditions, and more generally to mismatches between training and test data. The aforementioned weakly supervised scenario favors naturally such a bias, since training on only one slice is unlikely to generalize well. To go further into this direction, we propose, as additional experiments, to keep the initial training sets and apply three types of synthetic modifications on the test images to simulate classical difficulties occurring in histological imaging: (i) global illumination change, (ii) local illumination change, and (iii) local blur-ring. These changes were randomly generated on each image. To evaluate our method, we studied the average proportion of positive pixels recovered over time (Fig. 2) and measured the area under these curves (Tab. 1). The results demon-strate that our update framework allows a faster retrieval of interesting areas. As mentioned in Sec. 2.3, we also show that discretizing the user input into 7 prede-fined bins (i.e. enforcing Puser(R
j) ∈ {0, 0.1, 0.3, . . . , 0.9, 1}) does not reduce the
performance and thus lightens the user interaction. Finally, in the leave-one-out setting on real data, we assessed the influence of the parameter λ (Eq. 6). From
Eq. 7, low (resp. high) values of λ are expected to lead to numerical instabili-ties (resp. negligible updates). These asymptotic behaviors were experimentally observed for λ ≤ 0.05 and λ ≥ 100, respectively. Between these two extremes, a wide range of values of λ led to improvements, and we chose λ = 1 for simplicity.
4
Conclusion
We proposed an interactive method able to suggest sequentially regions of inter-est within large data from the output of a pre-trained random forinter-est classifier at pixel level. After each suggestion, one-click user inputs are collected to capture the specificities of the images at hand and update the region scoring function accordingly and in real time via an online gradient descent scheme. We evalu-ated our approach in the context of hematopoesis localization, with and without synthetic deformations simulating common sources of variability in histological imaging. As future work, we would like to extend our method to mitosis detection tasks [2] and generalize it to 2D video sequences and 3D volumes.
Acknowledgments This work was partially supported by the DFG-funded Collaborative Research Centre 824: “Imaging for Selection, Monitoring and In-dividualization of Cancer Therapies”.
References
1. Veta, M., Pluim, J., van Diest, P., Viergever, M.: Breast cancer histopathology image analysis: A review. IEEE Transactions on Biomedical Engineering (2014) 2. http://amida13.isi.uu.nl/
3. Crowley, R.S., Naus, G.J., Stewart, J., Friedman, C.P.: Development of visual diagnostic expertise in pathology - an information-processing study. Journal of the American Medical Informatics Association 10(1) (2003) 39–51
4. Zhao, P., Hoi, S.C.: OTL: A framework of online transfer learning. In: Proceedings of the 27th International Conference on Machine Learning. (2010) 1231–1238 5. Tommasi, T., Orabona, F., Kaboli, M., Caputo, B.: Leveraging over prior
knowl-edge for online learning of visual categories. In: BMVC. (2012)
6. Jain, V., Learned-Miller, E.: Online domain adaptation of a pre-trained cascade of classifiers. In: CVPR. (2011) 577–584
7. Breiman, L.: Random forests. Machine Learning (2001)
8. Criminisi, A., Shotton, J.: Decision Forests for Computer Vision and Medical Image Analysis. Springer (2013)
9. Saffari, A., Leistner, C., Santner, J., Godec, M., Bischof, H.: On-line random forests. In: ICCV Workshops. (Sept 2009) 1393–1400
10. Hastie, T., Tibshirani, R., Friedman, J.: The elements of statistical learning: data mining, inference and prediction. 2 edn. Springer (2009)
11. Shalev-Shwartz, S.: Online learning and online convex optimization. Found. Trends Mach. Learn. 4(2) (February 2012) 107–194
12. Tao, K., Fang, M., Alroy, J., Sahagian, G.: Imagable 4t1 model for the study of late stage breast cancer. BMC Cancer 8(1) (2008)
13. Winn, J., Criminisi, A., Minka, T.: Object categorization by learned universal visual dictionary. In: ICCV. (2005)