HAL Id: cea-02339326
https://hal-cea.archives-ouvertes.fr/cea-02339326
Submitted on 7 Jan 2020
HAL is a multi-disciplinary open access
archive for the deposit and dissemination of
sci-entific research documents, whether they are
pub-lished or not. The documents may come from
teaching and research institutions in France or
abroad, or from public or private research centers.
L’archive ouverte pluridisciplinaire HAL, est
destinée au dépôt et à la diffusion de documents
scientifiques de niveau recherche, publiés ou non,
émanant des établissements d’enseignement et de
recherche français ou étrangers, des laboratoires
publics ou privés.
Modelling of x-ray radioscopy for phase topology
estimationduring corium sodium interaction
Shifali Singh, Nathalie Cassiaut-Louis, Christophe Journeau, Magali Zabiego
To cite this version:
Shifali Singh, Nathalie Cassiaut-Louis, Christophe Journeau, Magali Zabiego. Modelling of x-ray
radioscopy for phase topology estimationduring corium sodium interaction. 26th International
Con-ference on Nuclear Engineering (ICONE - 26), Jul 2018, Londres, United Kingdom. �cea-02339326�
Proceedings of the 2018 26th International Conference on Nuclear Engineering ICONE26 July 22-26, 2018, London, England
ICONE26-82400
MODELLING OF X-RAY RADIOSCOPY FOR PHASE TOPOLOGY ESTIMATION
DURING CORIUM SODIUM INTERACTION
Shifali Singh∗
CEA, DEN, Cadarache, SMTA/LEAG 13108 St Paul lez Durance, France
Email: shifali.singh@cea.fr
Nathalie Cassiaut-Louis
CEA, DEN, Cadarache, SMTA/LEAG 13108 St Paul lez Durance, France
Christophe Journeau
CEA, DEN, Cadarache, SMTA/LEAG 13108 St Paul lez Durance, France
Magali Zabi ´ego
CEA, DEN, Cadarache, SMTA/LMAG 13108 St Paul lez Durance, France
ABSTRACT
In case of a severe accident scenario in a Sodium cooled Fast Reactor (SFR) such as the ASTRID demonstrator, the fuel might melt and interact with the coolant i.e. liquid sodium. This molten Fuel Coolant Interaction (FCI) can generate an energetic vapor explosion that can jeopardize the reactor structures. The yield of the vapor explosion is strongly dependent on the local distribution of the fragmented melt with respect to the local vapor fractions. The medium is composed of three phases, i.e. corium, liquid sodium and vapor sodium. Thus, a study of the three phase distribution within the system is a key to understand the extent of the explosion.
PLINIUS-2, the future large mass experimental platform of CEA Cadarache will be dedicated to conduct experiments to un-derstand the behavior of prototypic corium in case of severe ac-cidents. In order to study these interactions, a high energy X-ray imaging system is being developed. This system consists of a 15 MeV Linear accelerator producing high energy X-rays with significantly high flux, which are attenuated as it passes through the highly dense test section. The transmitted radiation forms a visual spectrum on the scintillator screen Gadox coupled to the CMOS camera. Using this system to study the interaction be-tween corium and sodium is particularly challenging due to the
small corium particulates of size of the order of 1 mm. The quali-fication of the foreseen radioscopy system on the visualization of such an interaction requires development of physical phantoms. This paper presents the preliminary simulations of expected im-ages of corium fragments in sodium, vapor bubbles and vapor film around the fragments. The simulations are carried out using a CEA Cadarache in-house tool MODHERATO, which produces radiographic images in satisfactory agreement with the real time imaging. The simulation of particles is based on the knowledge of interaction phenomenology gained from past experiments and on the statistical analysis of the size of corium particles formed. The models which, according to MODHERATO results, qualify to be detected and resolved, help manufacturing physical phan-toms to conduct the experiments.
1. INTRODUCTION
Over the years, Fuel-Coolant Interaction (FCI) in Sodium cooled Fast Reactors (SFRs) has become an important safety concern. The understanding of an FCI mechanism has evolved but it still remains incomplete. The possibility of occurrence of large scale FCIs [1] creates a need to investigate the underly-ing phenomena and develop a clear understandunderly-ing of the
(referred to as corium) and a colder more volatile liquid (sodium in SFRs and water in PWRs), is expected to be occurring in four stages [2]:
1. Premixing phase: When molten corium jet is injected into the coolant, it breaks up into coarse fragments. In case of water as a coolant, a stable vapor film is formed around the particles. The stable vapor film causes relatively low heat transfer between the two liquids. In case of sodium, it is difficult to obtain a very stable film for subcooled sodium but it seems possible in case of saturated sodium. Therefore, stable film boiling might be possible with nearly saturated sodium, but with subcooled sodium it seems unlikely. Thus, in saturated sodium, the behavior is similar to water-corium interaction where premixing time scale is in the range of seconds [2]. In subcooled sodium where stable film boiling is very difficult to establish, it is more difficult to premix large quantities of materials. Its duration strongly depends on the initial conditions and remains to be studied.
2. Triggering phase: In this phase, an external event (ex-perimentally represented by a pressure pulse) causes the destabilization of the vapor film allowing liquid-liquid
contacts. These contacts lead to fine fragmentation of
the particles, causing enhanced surface exchange area
for heat transfer and vaporization. In case of sodium,
the destabilization of the vapor film is spontaneous. The fragmentation can be of thermal nature or of hydrodynamic nature, depending on the physical conditions.
3. Propagation phase: The intense fragmentation leads to the formation of ”vapor bubbles” and a pressure wave that propagates through the medium [1].
4. Expansion phase: The high pressure mixture can then result into an expansion of the ”vapor bubble” which might then damage the surrounding structures and threaten the reactor integrity.
The strength of the explosion, characterized by an energetic pres-sure wave, strongly depends on the state of the corium-sodium mixture prior to the explosion. Therefore, the knowledge of the local distribution of melt droplets with respect to the local void fractions during the premixing phase is one of the key points. This knowledge of the three phase distribution within the mix-ture (corium, liquid sodium and its vapor) during an experiment is acquired by utilizing a real time high energy X-ray radiogra-phy.
The evolution of the FCI phenomenology with the sodium temperature was studied by Berthoud in 1994 [1] by analyzing a series of experiments. It was observed that with saturated sodium (either as initial temperature, or because it is warmed up by mul-tiple interactions) the pressure buildup time and the mechanics of
energy outbursts are closer to a fuel-water interaction. An inter-action with lightly subcooled sodium (nearly saturated) can be more violent. This phenomenon was observed in experiments like CORECT 2 Test 21 at CEA, Grenoble and B05, B06 Win-frith MFTF-B series test [1]. However, most of the experiments till date have been performed with highly sub-cooled sodium (T
∼400◦C) for instance the RIG-B, Winfrith [3, 4]. Efforts have
been made in the past to study the evolution of this interaction with large masses of melt and sodium close to saturation [5, 6]. This has been achieved by means of experiments. Due to vari-ous limitations these experiments lack information to study the detailed evolution. The limitation of the availability of a high energy X-ray source and imaging software which could analyze and differentiate the three phases formed in the interaction was a major drawback in these experiments. Hence, if there is a need of new experiments to extend our knowledge of FCI phenomenol-ogy, these experiments will have to be carefully instrumented so that valuable information could be obtained.
With this aim, CEA is currently designing the test facil-ity PLINIUS-2 to carry out tests involving significant masses of corium (about 50 kg) with high temperature range of sodium
(from 400◦C to the sodium saturation temperature) and
visual-ize the interaction with X-ray radioscopy system. The aim of this CEA research is to better understand the fragmentation mecha-nism, the pressure buildup and the morphology of the debris bed issuing from the interaction. Section 2 describes the ongoing experimental and modeling activities in regard to FCI studies at CEA. A detailed review of the past experiments and the statis-tical analysis of their experimental observations is presented in section 3. In the section 4, results of the simulated radiographies are presented. Finally, section 5 presents the conclusions and the future prospects of this study.
2. Facilities to study FCI at CEA
CEA is interested in studying FCIs incorporating both sim-ulations and performing new experiments. Modeling of corium-sodium heat transfer and corium fragmentation is being achieved by developing the code SCONE (Software for COrium Na inter-action Evaluation) [7].
2.1 Experimental facilities
2.1.1 Corium-water facility: The KROTOS facility at CEA Cadarache, investigates the corium-water interactions involving energetic events i.e. steam explosions. Several tests with ∼5-8 kg corium melt mass with water at temperatures ∼60
◦C have been performed at this facility. It employs an X-ray
radioscopy system to simultaneously visualize the premixture composed of corium, water and steam. This is accomplished with the help of a 9 MeV linear electron accelerator (LINAC) which emits an X-ray pulsed cone-beam. It passes through a
ries of filters, the lead collimator and penetrates the test section. The transmitted radiation forms a visual spectrum on the scin-tillator screen GADOX. The image formed on the rear side of the screen is recorder with four high-framerate scientific CMOS cameras, each with a frequency of 50 Hz. The images formed are analyzed and interpreted with the help of an in-house soft-ware called KIWI (KROTOS Image analysis for Water-corium Interaction) [8].
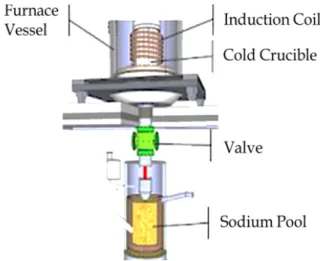
2.1.2 Corium-sodium facility: PLINIUS-2, a large mass experimental platform is under design at CEA, Cadarache supporting the ASTRID reactor conception. This platform will facilitate performing tests with sodium and large masses of pro-totypic corium (upto 500 kg). It is devoted to the study of fuel-sodium interaction, fuel-water interaction and corium-sacrificial material interaction. A small test section, PLINIUS-2-FR, of 300 mm diameter and 2500 mm in height, is designed to study frag-mentation mechanism of corium in high temperature sodium us-ing X-ray radioscopy. This facility is capable of receivus-ing 50 kg
of corium in sodium of temperature in the range ∼400◦C to
sat-uration temperature. Such a high temperature is maintained by the thick thermal insulation around the test vessel. A pictorial representation of the facility is shown in Fig. 1. Readers are suggested to refer to [9] for a detailed description of the facility.
FIGURE 1: SCHEMATICS OF PLINIUS-2 CORIUM-SODIUM FRAGMENTATION FACILITY
In order to visualize the fragmentation mechanism of the corium jet in sodium and the three phase mixture, a high energy X-ray radioscopy is being developed. This is based on the knowl-edge and experience gained from the X-ray radioscopy of the KROTOS facility. The scheme of the foreseen X-ray radioscopy system is presented in Fig. 2. Due to the large sodium column
and the thick thermal insulation, a high energy 15 MeV Linear accelerator will be used. The high energy X-ray flux is attenuated as it passes through the highly dense test section. The transmit-ted radiation forms a visual spectrum on the scintillator screen Gadox coupled to 4 CMOS cameras.
FIGURE 2: FORESEEN X-RAY RADIOSCOPY SYSTEM FOR PLINIUS-2 FR TEST SECTION
2.2 Simulation tools
CEA Cadarache has developed an in-house radiography and tomography support software called MODHERATO for high en-ergy imaging applications. It allows to simulate radiographies of a 3-D object. It is used to help designing new equipments, looking for the best measurement conditions and obtaining pre-cisions about the contrast, the resolution and the detection limits for a given object [10]. As a preliminary step, MODHERATO is utilized to qualify the radioscopy system of the PLINIUS-2 test section to visualize the corium sodium interaction. MODHER-ATO allows understanding the performance of the corium par-ticulates in terms of resolution, detectability, contrast precision, etc., when subjected to X-rays. The simulation involves defining a virtual 3D object between an X-ray source and a detector. Ma-terials interacting with X-rays are characterized by their material density. The simulation algorithm of the software is based on the Beer Lambert’s law of attenuation:
I= I0exp (−µx) (1)
where I0is the intensity of the incident flux; I is the attenuated flux on the detector screen; µ is the linear attenuation coeffi-cient of the interacting material, and x is the width of the ma-terial. The code has been recently upgraded to include the scat-tered photon flux to the attenuated direct flux I, thereby obtaining good agreement between the simulated images and the images obtained from the experiments [10].
3. METHODOLOGY
Before performing tests at PLINIUS-2, it is necessary to un-derstand the phenomenology of FCI and qualify the X-ray imag-ing system to visualize the interaction. To carry out this, as a first step, a review and analysis of the existing experiments of interest to characterize the size and shape of the particles formed during an FCI was done.
3.1 Review of the past experiments
There is a very limited information about the fragmentation of molten corium in sodium. Certain experiments have been performed in the past to understand the interaction phenomenol-ogy of oxidic (UO2) and/or metallic fuel materials with sodium. Some of the experiments used simulants, such as alumina for
UO2[11] and aluminium for metallic fuel [12] to study the
in-teraction mechanism, while some used prototypic corium. Due to large differences that exist between alumina and prototypic corium [13], the representativeness of this system is question-able. For this reason, only UO2and metal fuel tests are consid-ered in this study.
1. Experiments concerning particle size: When a liquid jet at high temperature is injected in a relatively cold liquid, a susceptible vapour film is expected to be formed around the jet. Under the effect of instabilities, the jet breaks up. The jet break up is highly dependent on several parameters, for example, the melt geometry, its velocity, its tempera-ture and the temperatempera-ture of the surrounding coolant. In the
FARO-TERMOS experiments where 100 kg of pure UO2
were poured into sodium at initial temperature ∼400◦C, a
series of FCIs occurred when the fuel was injected into the sodium [6]. These FCIs result in increasing the temperature of the mixing zone (to around saturation) and in pressure ex-cursions limiting the quantities of melt penetrating into the sodium. So, in case of subcooled sodium, there are chances of sodium reaching elevated temperatures due to multiple interactions and thus causing FCIs. But, if a similar
exper-iment of 100 kg scale of UO2 is performed with sodium,
initially at such elevated temperatures of ∼800◦C, the sce-nario is unknown even if past experiments have shown that behaviors similar to water-FCI could be expected, especially in terms of energy release. Chu tried to demonstrate this
through FRAG SERIES 6F experiment with 20 kg of UO2
-ZrO2injected into sodium with initial temperature 690 ◦C
[5]. He observed that the melt stream was able to reach all the way to the bottom of the pool without fragmenting completely and resulted in some fragments of the order of 5 cm. This behavior is very similar to what is observed in water- FCIs. Thus, the observed behavior is different with subcooled sodium and saturated sodium. At PLINIUS-2, performing tests with metallic fuel especially stainless steel is of interest. In the literature, there is just one test with
stainless steel and sodium i.e. NaSS test [14]. But in this test, sodium is injected from the bottom of stainless steel column which does not match the PLINIUS-2 configura-tion. So, another series of tests that are of interest, were conducted at Argonne National Lab to observe the breakup behavior of kilogram quantities of metal melt such as molten uranium, uranium-zirconium alloy and uranium-iron alloys
poured into 600◦C sodium. ANL T6 test is one of these
tests which will be analyzed in this study [15]. Several ex-periments to compare the particle size for oxide and metal
fuels were carried out. Johnson et al. suggested that UO2
fragments tends to take smaller particle size than metallic materials, as would be expected from considerations of the stresses on liquid drops of metal and oxide quenched in
sodium [4]. Armstrong et al. also found that molten UO2
quenched in sodium formed finer particles than molten stain-less steel [16].
2. Experiments concerning particle shape: Some tests were performed at the JRC BETULLA 1 and 2 facilities, to study the difference in the behavior of metallic fuel interaction with sodium and that of oxidic fuel with sodium [3]. The
study suggested that small fractions of UO2debris bed
par-ticles tend to take smooth and nearly spherical shapes while most of the oxidic fragments displayed angular outlines. Metallic fragments were mostly found to be smooth. Similar observation was also made by T.Y. Chu [5].
These past experiments mainly report data of the particle sizes
obtained from the debris bed. It was assumed that particles
formed during the fragmentation mechanism will have a similar distribution to the ones retrieved in the debris bed. But, actually these debris bed particles might be smaller than those expected in the premixing stage due to the stresses during the phase of parti-cles reaching debris bed or might be larger due to the coagulation of smaller fragments into large lumps.
These experiments conclude different interaction behaviors of metallic fuel and oxidic fuel with different temperatures of sodium. Therefore there is a need of sorting the study into three groups, i.e., oxide fuel interaction with nearly saturated sodium, oxide fuel interaction with subcooled sodium, and metallic fuel
interaction with subcooled sodium. For UO2 melt interaction
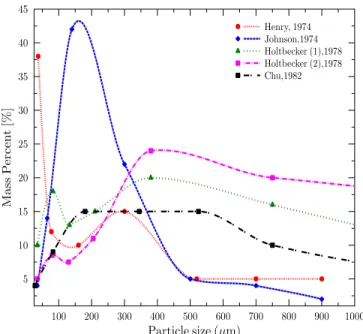
with sodium close to saturation, the data of the particle size dis-tribution is limited to ANL-USA M3 test [4], ANL-USA EDT#2 test [17], 2 tests at Betulla-1-JRC tests [18] and FRAG SERIES test [5]. The size distribution (in mass percentage) issuing from these different experiments are plotted in Fig. 3
3.2 Particle size distribution analysis
In the statistics presented in Fig.3, two bumps were observed in each test, representing two steps of fragmentation. In the first step, the hot molten fuel comes in contact with sodium, leading to coarse fragmentation and do not undergo any further
FIGURE 3: STATISTICS OF DEBRIS PARTICLES FORMED
BY INTERACTION BETWEEN UO2 AND NEARLY
SATU-RATED SODIUM
tation and reach the bottom of the test section (larger sizes). In the second step, thermal and hydrodynamic effects cause finer fragmentation. The difference between the particle size distribu-tion in each of the experiment may be due to the difference in boiling regime of sodium at different temperatures.
For the FCI safety studies, the density function of the finest particle size distribution holds importance. The particle size dis-tributions in Fig. 3 appears to be a bimodal log-normal, i.e. there are two bumps in all the experiments. Instead of visually esti-mating the parameters of the two log-normals and their respec-tive weights, the gaussian mixture model available in the mix-tools package of the R software [19] was used, to fit the log transform of the mixture distribution. This tool is based on a maximum likelihood method and the expectation-maximization algorithm. The Gaussian mixture model groups the distributions into two clusters to obtain two fitted gaussian distributions de-fined by their respective mean µ1and µ2, standard deviation σ1 and σ2and weighted by their estimated probability of occurrence λ1and λ2. Thus, the bimodal mixture probability density distri-bution f for the particle diameter D is represented by equation 2: f(lnD) =λ1 1 σ1 √ 2πexp h −(lnD − µ1) 2 2(σ1)2 i + λ2 1 σ2 √ 2πexp h −(lnD − µ2) 2 2(σ2)2 i (2)
The above methodology was appliead on the experimental data and observe the particle size distribution. To represent the UO2 interaction tests with saturated sodium, FRAG SERIES 6F test
was chosen out of the five tests in Fig. 3. The UO2interaction
with subcooled sodium was represented by FARO-TERMOS test and the metallic fuel test with subcooled sodium by ANL-T6 test. 1. FRAG SERIES 6F test: The logged data from the frag-series test [5] was fitted normally as shown in Fig. 4 for each of the two peaks shown in solid lines in red and blue. The
mix-0.0 0.1 0.2 0.3 0.4 4 6 8 ln (Particle size) Density
FIGURE 4: FITTED BIMODAL NORMAL CURVE FOR THE PARTICLE DISTRIBUTION IN FRAG SERIES 6F TEST
ture of the two curves gives a bimodal normal fit represented in black dotted line. Thus, the bimodal mixture probability density distribution f for the particle diameter D is repre-sented by: f(lnD) =0.33 1 0.63√2πexp h −(lnD − 4.54) 2 2(0.63)2 i + 0.67 1 0.65√2πexp h −(lnD − 6.53) 2 2(0.65)2 i (3)
With this fitting, µ1and µ2for the two peaks were observed
to be 4.54 and 6.53 respectively and their corresponding σ1
and σ2as 0.63 and 0.65 respectively. The mean particle size was thus obtained as 0.09 mm and 0.69 mm, with a weight factor of 33% and 67% respectively.
2. FARO-TERMOS test: The particle size distribution with more subcooled sodium is observed in FARO-TERMOS test [6]. The normal fitting of its distribution is shown in Fig. 5. Likewise, the bimodal mixture probability density distribu-tion for this test is computed to be:
f(lnD) =0.60 1 0.37√2πexp h −(lnD − 4.19) 2 2(0.37)2 i + 0.40 1 0.32√2πexp h −(lnD − 5.16) 2 2(0.32)2 i (4)
With this fitting, µ1and µ2for the two peaks are 4.19 and
0.0 0.2 0.4 0.6 3 4 5 6 7 ln (Particle size) Density
FIGURE 5: FITTED BIMODAL NORMAL CURVE FOR THE PARTICLE DISTRIBUTION IN FARO-TERMOS TEST
5.16 respectively and their corresponding σ1and σ2are 0.37 and 0.32 respectively. The mean particle size was thus com-puted to be 0.07 mm and 0.17 mm, with a weight factor of 60% and 40% respectively. Hence, it was observed that the range of particle size is way smaller than the FRAG SERIES experiment with sodium close to saturation.
3. ANL T6 test: To observe the particle size distribution of metal melt (U-Zr) with sodium, the ANL T6 test was consid-ered [15]. Upon fitting the log data of particle size normally, the fitted curve was observed to be lying in a bit higher range of particle size. The distribution curve is shown in Fig. 6. The bimodal mixture probability density distribution for this
0.0 0.2 0.4 7 8 9 10 11 ln (Particle size) Density
FIGURE 6: FITTED BIMODAL NORMAL CURVE FOR THE PARTICLE DISTRIBUTION IN ANL T6 TEST
case is as follows: f(lnD) =0.70 1 0.54√2πexp h −(lnD − 9.60) 2 2(0.54)2 i + 0.30 1 0.51√2πexp h −(lnD − 8.02) 2 2(0.51)2 i (5)
With this fitting, µ1and µ2for the two peaks were observed
to be 9.60 and 8.02 respectively and their corresponding σ1
and σ2as 0.54 and 0.51 respectively. The mean particle size for this test was computed to be 14.76 mm and 3.04 mm, with their respective weight factor of 70% and 30%. These mean values are in agreement to the experimental results. This is considerably bigger than the oxide particles and will thus be easier to detect these particles with the X-ray system.
3.3 Simulations with MODHERATO
This section details the application of MODHERATO in ob-taining preliminary results of expected images of the corium fragments predicted from the statistical analysis in the previous section. The understanding of the phenomenology of the inter-action with the obtained images, will thus help concluding a pre-mixing design. Simulations with MODHERATO are carried out in the following manner:
1. Description of the 3-D objects placed between the source
and the detector: This involves defining their dimensions, material and density. For instance, description of the design of the test section, the corium, liquid sodium and sodium vapor;
2. Definition of the energy and angular distributions of the X-ray Linear Accelerator;
3. Discription of the detector at which the energy is deposited by the X-rays;
4. Definition of the camera properties;
5. Definition of the distance between the source, object and the detector.
Initial simulations to obtain the detection limit for the PLINIUS-2 configuration have been described by Berge et al. [10]. Phantoms i.e., 3D models of corium fragmentation in re-actor coolant, were used to investigate the criterion of object de-tectability (detection limit). The KROTOS phantom, comprising of several steel balls (representing corium fragments) of dimen-sion ranging from 1 mm to 30 mm, fixed inside a polyethylene plate (representing water), was simulated with MODHERATO in the PLINIUS-2 configuration. A contrast of more than five times the background noise level has been computed to be the detec-tion limit of this simuladetec-tion. The particle size corresponding to this order of contrast to noise ratio which defines the detection limit is around 5 mm.
As discussed in the previous section, the analysis of the past experiments provides an estimate of the particle size, i.e, ∼0.01 to 0.7 mm. This size is considerably smaller than the detection limit of MODHERATO. Thus, it was opted to simulate clouds of particles (a group of small fragments) instead of detecting parti-cle by partiparti-cle. The size of the cloud of partiparti-cles was chosen to be slightly greater than the detection limit of MODHERATO, i.e. 5.5 mm. The volume of such a cloud will be considerably larger than the volume of actual corium particles of size ∼ 0.01 to 0.7 mm. Thus, in order to simulate a cloud of particles (a group of small fragments) each cloud consists of a mixture of corium in sodium in different proportions. In this study, clouds of 5.5 and 10 mm will be simulated with corium mass fraction varying from 50 to 100% in the mixture, the rest being sodium.
4. RESULTS
The simulated images of clouds of size 5.5 and 10 mm with corium mass fraction varying from 50 to 100% in the mixture is shown in Fig. 7a and 7b respectively. It consists of cubic and spherical clouds placed at a distance of roughly 3 cm and 4 cm from the centre. Also, a cylindrical cloud of corium jet of diameter 1 cm and length 4 cm is simulated and can be seen at the top in both Fig. 7a and 7b. The 5.5 mm clouds with 80% or more of corium are observed to be detectable in 7a. While the 10 mm clouds with 60% or more of corium are detectable in 7b.
The variation of contrast of the clouds of size 5.5 mm and
(a) Clouds of size 5.5 mm (b) Clouds of size 10 mm
FIGURE 7: SIMULATED IMAGE OF THE CLOUDS OF SIZE 5.5 MM AND 10 MM
10 mm, using ImageJ tool [20] is shown in Fig. 8a and 8b re-spectively. The contrast image gives a better picture of the dif-ferent density of both 5.5 mm and 10 mm clouds. It appears that even though less dense clouds have very less contrast to noise ratio, it is clearly possible to visualize them. Therefore, it can be concluded that the limit of contrast of more than five times the background noise level is just a quality ratio on the radioscopy. It is expected that the development of an advanced image process-ing and analysis tool, would help detectprocess-ing these particles more
(a) Clouds of size 5.5 mm (b) Clouds of size 10 mm
FIGURE 8: CONTRAST IMAGE OF THE CLOUDS OF SIZE 5.5 MM AND 10 MM
efficiently.
The simulation was then extended to the PLINIUS-2-FR fa-cility, where about 50 kg of corium is expected to be injected into sodium. For simplicity, a spherical cloud of 45 kg of corium in sodium was simulated as shown in Fig. 9a. This cloud was simulated with a variation of density from the center (the densest i.e. 100% of corium) to the peripheries (the least densest around 40% of corium in sodium). The contrast image of this simula-tion using ImageJ tool is shown in Fig. 9b. The contrast to noise ratio of this image is way over the detection limit i.e. 13 for the least dense 40% corium fraction cloud, which is good enough to be clearly detectable. Thus, with a higher mass of corium in the cloud, the detectability improves.
(a) Simulated image (b) Contrast image
FIGURE 9: SIMULATED IMAGE AND CONTRAST IMAGE OF THE CLOUDS OF 45 KG OF CORIUM
5. CONCLUSIONS AND FUTURE WORK
This article focuses on the observations of fragmented corium when it interacts with the surrounding coolant i.e. sodium in SFRs. The aim is to visualize a three phase medium during the interaction. Based on the current knowledge of the interaction mechanism and on the particles size from the past experiments, the fragmentation of molten corium and its resulting particle size is studied. The size of the particles formed when interacting with different levels of sub-cooling of sodium is discussed. Mean Par-ticle size of angular shaped oxide melt is observed to be 0.07 mm and 0.69 mm, and for smoother metal melt it is 3.04 mm to 14.76 mm. This is found to be in agreement with the observations made in the experiments. These corium fragments are then simulated
with the CEA-software MODHERATO to simulate the images expected when using an X-ray system. However, the expected corium particles being smaller than the detection limit of the sys-tem as estimated with MODHERATO, it was chosen to represent clouds of particles containing given mass fraction of corium and liquid sodium. Upon simulating the clouds of particles of size 5.5 mm and 10 mm with varying densities, it is observed that the particles are detectable as cloud of particles. A cloud of parti-cles with all together 45 kg is also simulated and the contrast to noise ratio is good enough to be clearly visible. Depending on these simulations and the interaction scenerio during the premix-ing stage, various physical phantoms (models of the fragmented corium in sodium with similar attenuation properties that can be used to investigate the effect of radiography) have been designed and manufactured. Experiments with these manufactured phan-toms will be carried out shortly.
ACKNOWLEDGMENT
The author would like to thank Nicolas Estre and L´eonie Ta-magno (CEA/DEN/DTN/SMTA/LMN) for their valuable com-ments and discussions during the course of this study.
REFERENCES
[1] Berthoud, G., Jacobs, H., and Knowles, B., 1994. Large scale fuel-sodium inetarctions: synthesis of european
pro-grams. Fast Reactor Coordinating Committee/ Safety
Working Group, WAC(94)-D375).
[2] Berthoud, G., 2000. “Vapor Explosions”. Annual Review
of Fluid Mechanics, 32(1), pp. 573–611.
[3] Schins, H., 1988. “A critical review of fuel coolant
interac-tions with particular reference to UO2-Na”. Res
Mechan-ica, 23(1), pp. 65–88.
[4] Johnson, T. R., Pavlik, J. R., and Baker, L. J., 1975. Postac-cident Heat Removal: Large-Scale Molten-Fuel-Sodium Interaction Experiments. Tech. Rep. ANL–75-12, Argonne
National Lab., Argonne, IL (United States), Feb. DOI:
10.2172/4228270.
[5] Chu, T. Y., 1982. Fragmentation of molten core material by sodium. Tech. Rep. SAND–82-0300C, Sandia National Labs.
[6] Magallon, D., Hohmann, H., and Schins, H., 1992. “Pour-ing of 100-kg-Scale Molten UO2 into Sodium”. Nuclear
Technology; (United States), 98:1.
[7] Zabiego, M., and Fochesato, C., 2017. “Corium-sodium interaction: the development of the SCONE software”. NURETH17.
[8] Brayer, C., Piluso, P., Cassiaut-Louis, N., and Grishchenko, D., 2013. “Application of X-Ray radioscopy for investiga-tions of the 3-phase-mixture resulting from the
tion of a high temperature molten material jet in water”. In 8th International Conference on Multiphase Flow.
[9] Journeau, C., Aufore, L., Berge, L., Brayer, C., Cassiaut-Louis, N., Estre, N., payot, F., Piluso, P., Prele, J., Singh, S., and Zabiego, M., 2017. “Sodium and Corium-Water fuel-coolant-interaction experimental programs for the PLINIUS2 prototypic corium platform”. In NURETH-17.
[10] Berge, L., Estre, N., Tisseur, D., Payan, E., Eck, D., Bouyer, V., Cassiaut-Louis, N., Journeau, C., Le Tellier, R., and Pluyette, E., 2017. “Fast high-energy X-ray imaging for Severe Accidents experiments on the future PLINIUS-2 platform”. In ANIMMA 2017.
[11] Matsuba, K.-i., Kamiyama, K., Konishi, K., Toyooka, J.-i., Sato, I., Zuev, V. A., Kolodeshnikov, A. A., and Vasilyev, Y. S., 2016. “Experimental study on material relocation during core disruptive accident in sodium-cooled fast reac-tors. Results of a series of fragmentation tests for molten oxide discharged into a sodium pool”. Mechanical
Engi-neering Journal, Vol.3, No.3.
[12] Matsuba, K.-i., Isozaki, M., Kamiyama, K., and Tobita, Y., 2016. “Distance for fragmentation of a simulated molten-core material discharged into a sodium pool”. Journal of
Nuclear Science and Technology, 53(5), May, pp. 707–712.
[13] Huhtiniemi, I., Magallon, D., and Hohmann, H., 1999. “Re-sults of recent KROTOS FCI tests: alumina versus corium melts”. Nuclear Engineering and Design, 189(1), May, pp. 379–389.
[14] Asher, R. C., 1979. The injection of liquid sodium into stainless steel: a report of further experiments NaSS/4, NaSS/5, NaSS/6. Tech. rep., Bournemouth UK, Apr. [15] Gabor, J. D., Purviance, R. T., Aeschlimann, R. W., and
Spencer, B. W., 1988. “Breakup and quench of molten metal fuel in sodium”. In Proceedings of the ANS ”Safety of next generation power reactors” meeting, Argonne Na-tional Lab.
[16] Armstrong, D., Testa, F., and Raridon, D. J., 1971. Interac-tion of sodium with molten UO2 and stainless steel using dropping mode of contact. Tech. Rep. Report ANL-7890.
[17] Henry, R., 1974. “Large scale vapor explosions”.
pp. CONF–740401 – P2.
[18] Holtbecker, H., Schins, H., Jorzik, E., and Klein, K., 1978. Sodium-fuel interaction: dropping experiments and sub-assembly test. Tech. Rep. EUR–5854, Commission of the European Communities.
[19] Benaglia, T., Chauveau, D., Hunter, D. R., and Young, D., 2009. “mixtools : An R Package for Analyzing Finite Mix-ture Models”. Journal of Statistical Software, 32(6). [20] Schneider, C. A., Rasband, W. S., and Eliceiri, K. W., 2012.
“NIH Image to ImageJ: 25 years of image analysis”. Nature