HAL Id: tel-02425680
https://pastel.archives-ouvertes.fr/tel-02425680
Submitted on 31 Dec 2019HAL is a multi-disciplinary open access
archive for the deposit and dissemination of sci-entific research documents, whether they are pub-lished or not. The documents may come from teaching and research institutions in France or abroad, or from public or private research centers.
L’archive ouverte pluridisciplinaire HAL, est destinée au dépôt et à la diffusion de documents scientifiques de niveau recherche, publiés ou non, émanant des établissements d’enseignement et de recherche français ou étrangers, des laboratoires publics ou privés.
Competition and regulation of the advertising financed
media platforms
Jiekai Zhang
To cite this version:
Jiekai Zhang. Competition and regulation of the advertising financed media platforms. Economics and Finance. Université Paris sciences et lettres, 2017. English. �NNT : 2017PSLEM049�. �tel-02425680�
THÈSE DE DOCTORAT
de l’Université de recherche Paris Sciences et Lettres
PSL Research University
Préparée à MINES ParisTech
Concurrence et régulation des plateformes médias financées par la
publicité
École doctorale n
o396
ECONOMIE, ORGANISATION, SOCIÉTÉ
Spécialité
ECONOMIE ET FINANCESoutenue par
Jiekai ZHANG
Dirigée par
Olivier Bomsel
le 12 Septembre 2017
COMPOSITION DU JURY :
M. Pierre Dubois
Toulouse School of Economics (Rapporteur)
M. Xavier d’Haultfoeuille Crest-Ensae
(Rapporteur)
Mme. Margaret K. Kyle Mines ParisTech (Présidente du jury) M. Marc Ivaldi
Toulouse School of Economics (Examinateur)
M. Olivier Bomsel Mines ParisTech (Examinateur)
Acknowledgments
I would like to firstly thank my supervisor, Olivier Bomsel, for giving me the opportunity to work for his chair and to get in touch with different media companies. It is a useful starting point for my thesis.
I am grateful to Marc Ivaldi for having been a great support during my difficult times. I am thankful to Nicolas Bouy who has helped me to collect data from the Conseil Supérieur de l’Audiovisuel and from whom I learnt a lot about the French television industry. I also wish to thank Margaret Kyle, Pierre Fleckinger, Petyo Bonev, Jean-Michel Loubes and Jocelyn Donze, for having taken time when I needed help.
I thank Pierre Dubois and Xavier d’Haultfoeuille for having kindly accepted to evaluate my work.
I am indebted to CREST that generously financed the last year of my PhD and provided me an excellent research environment. I specially thank Laurent Linnemer and Alessandro Iaria for their advice, encouragement and kindness. I am also thankful to my three colleagues on empirical IO: Julien, Hugo and Ao. I have benefited so much from our discussions.
Thank you, Victor, for your kindness and patience over the past few years. Many thanks to my friends: Lucie, Ángela, Johanna, Stefan, Morten and to my fellow PhD students: Char-lène, Damien, Carlotta, Sabrine, Paul-Hervé, Romain, Philipe, Laurie, Btissam, Maddalena, Morgane, Tomas, Arthur, Emmanuel. . . for their company. I acknowledge administrative as-sistance of Sésaria Ferreira.
Finally, I thank my family, for their unconditional love.
Financial supports from Fondation Mines ParisTech through the chair of Media and Brand Economics and from Labex GENES-ECODEC are gratefully acknowledged.
Contents
ACKNOWLEDGMENTS 1
Introduction 5
1 Advertising Competition in the Free-To-Air TV Broadcasting Industry 9
1.1 Introduction . . . 10
1.2 Market and data analysis . . . 12
1.2.1 Market characteristics . . . 12 1.2.2 Data . . . 14 1.3 Structural model . . . 15 1.3.1 Demand of TV viewers . . . 15 1.3.2 Demand of advertisers . . . 17 1.3.3 Supply of TV channels . . . 17 1.4 Econometric specification. . . 19 1.4.1 Demand of TV viewers . . . 19 1.4.2 Demand of advertisers . . . 19 1.5 Estimation . . . 20 1.5.1 Identification . . . 20 1.5.2 Estimates . . . 22 1.6 Empirical analysis. . . 23 1.6.1 Demand elasticities . . . 23
1.6.2 Marginal costs and market conduct . . . 23
1.7 Competitive analysis . . . 25
1.7.1 Lerner Index . . . 25
1.7.2 Evaluation of a merger between advertising sales houses. . . 26
1.8 Conclusion . . . 27
1.9 Appendix: Tables . . . 28
2 Regulating Advertising Quantity: Is This Policy Efficient? 41 2.1 Introduction . . . 42
2.2 Context . . . 46
2.2.1 Free-Broadcast TV Industry . . . 46
2.2.2 French Regulatory Framework . . . 47
2.2.3 Data and Descriptive Statistics . . . 47
2.2.4 Model-Free and Reduced-Form Evidence . . . 50
2.3 Econometric Model . . . 52
2.3.1 Demand for TV Viewers . . . 52
2.3.3 Supplies of TV Channels . . . 54
2.4 Identification and Estimation . . . 56
2.4.1 Demand of TV Viewers. . . 56
2.4.2 Demand of Advertisers . . . 57
2.4.3 Supply of TV Channels. . . 57
2.5 Results . . . 58
2.5.1 Demand of TV Viewers and Advertising Elasticity of Audience . . . 58
2.5.2 Demand of Advertisers and Advertising Price Flexibility . . . 60
2.5.3 Shadow Prices of Regulation Caps on Advertising . . . 61
2.6 (Short-run) welfare effects of regulation . . . 62
2.7 Conclusion and Discussion . . . 65
2.8 Appendix: Additional Tables and Figures. . . 68
3 Merger of Advertising Financed Media Platforms 87 3.1 Introduction . . . 88
3.2 Theoretical Model. . . 89
3.3 Empirical Counterfactual Simulation on the French Merger Case . . . 95
3.4 Conclusion . . . 98
3.5 Appendix . . . 100
Introduction
Advertising-financed media platforms include broadcast TV, radio, video-sharing websites (YouTube), internet searches engines (Google), social networks (Facebook) and online shopping malls (Ama-zon). These platforms provide services (or contents) free of charge to their users but bill heavily the advertisers. By using the platforms, users see the advertisements and thereby generate pos-itive network externalities to the advertisers. Depending on the service (contents) proposed by the platforms, users may either appreciate or disappreciate the advertising. In other words, advertisers can generate either positive or negative externalities to the platform users. This preference determines the functioning of a market. When users welcome advertising, the media platforms connect two groups of consumers (users and advertisers) both generating positive net-work externalities on each other. In such case, the media platforms are facing similar netnet-work externalities as the two-sided credit card system. However, when the advertising is undesirable to the platform users, the media platforms have to internalize two opposite network externalities in order to make their strategic decisions. On the one hand, media platforms has an incentive to enlarge their advertising spaces as they earn revenues from advertising; on the other, too many ads may reduce the platforms’ usererships, which in turn reduce the willingness to pay of advertisers. Testing the platform users’ preference for advertising is an empirical issue. Feed-back loop between users and advertisers complicate the strategic behaviors of the platforms. As a consequence, the competition landscapes and regulation implications on these markets differ from the other markets. This thesis aims at exploring the particularity of the advertising-financed media platforms as two-sided markets. In particular, it evaluates the competition and regulation policies on these markets from a welfare perspective.
The thesis is composed of three essays. The two first ones are empirical. The third one combines a theoretical model and an empirical test. All the empirical works use data on the French broadcast TV market, mainly collected from the Conseil Supérieur de l’Audiovisuel (CSA). The reason why I chose broadcast TV market as an example of advertising-financed media platforms is twofold: first, data are relatively rich and accessible on this market; second, the television continuously dominates the leisure time of consumers. As reported by the Bureau of Labor Statistics’ American Time Use Survey (ATUS), American consumers spend more than 10% of all available time, and more than 50% of the leisure time, watching TV. This trend is stable over the past 10 years, from 2003 to 2013. (See Handbook of Media Economics, 2015, Chapter 5.) According to the published report of the Observatoire des loisirs des Français in 2014, the television consists of an essential medium of leisure for 22% of the total French population (for 33% of the seniors, 29% of the pensioners, and 21% of women).
French broadcast TV industry
The economics of television markets are largely common across countries. For most of the television industry’s history, we distinguish typically the broadcast and pay television. The recent development of digital broadcast distribution of (free and pay) television has weakened this distinction. To avoid misunderstanding, I will frequently use the term “free-broadcast television” all along this thesis. Pay television is supported as least in part by payments from subscribers (viewers). Free-broadcast television, in contrast, cannot charge the TV viewers, but relies mainly on advertising revenue. The broadcast television in France began in 1945. Until 2005, it was transmitted to audience through the analogue network. The commercial launch of digital terrestrial television in France took place on 31st March, 2005. This new technology gradually replaced the aged analogue broadcasting mode of free TVs. The French households
used to watch free-broadcast television. According to the survey of the CSA, in 2014, there are in total 207 pay TV channels in France, while their cumulative audience share is equal to 14%. Broadcast TV stations are generally licensed by a national regulatory authority because the electromagnetic spectrum used by broadcasters is a public resource and licensing is required to prevent interference among broadcasters. In France, they are licensed by the Conseil Supérieur de l’Audiovisuel (CSA). The broadcasters do not pay license fee in France. However, as an exchange to the broadcasting rights, the broadcasters are subject to different obligations of par-ticipation in audiovisual production. As well, the broadcast TV stations are entirely responsible for the programming expenditure in France. This feature is different to the US broadcast TV market, where there is often a separation of ownership between content providers (broadcast networks) and distributors (broadcast stations). Figure below describes the two-sided business model of the French broadcast TV stations.
The first chapter of the thesis studies the advertising competition on the French broadcast TV market. We use a unique dataset on the French broadcast television market including
audience, prices, and quantities of advertising of twenty-one TV channels from March 2008 to December 2013. We specify a structural model of oligopoly competition and identify the shape and magnitude of the feedback loop between TV viewers and advertisers. We also implement a simple procedure to identify the conduct of firms on the market. We find that the nature of competition in the French TV advertising market is of the Cournot type. Further, we provide empirical evidence that the price-cost margin is not a good indicator of the market power of firms operating on two-sided markets.
In the second chapter, I study the welfare implications of the widespread regulation on TV advertising quantity. To my knowledge, this is the first work which structurally investigates this issue within a two-sided market framework. The essay exploits a novel dataset of per hour data on 12 broadcast TV channels in France during one year (2014). I first estimate the demand of TV viewers and of advertisers, which allows me to account for the two-sidedness of the market in the supply decision of TV stations. I identify the shadow prices of regulation based on the observed regulatory constraints. Finally, I conduct two counterfactual experiments to calibrate the welfare effects of the regulation. My results suggest that regulating advertising quantity is unnecessary on a competitive market, given the two-sided market structure of the broadcast TV industry. However, if TV broadcasters collude on their advertising supply, the regulation can improve upto 5.75% of consumer surplus, but decrease until 4.8% of the industry’s profit.
Finally, in the last chapter, I use a theoretical model to analyze the competitive behavior of advertising financed media platforms. The platforms are specified to be horizontally differ-entiated and the market form is an oligopoly. The first major insight of the model is that the different platforms behave as strategic complements under Cournot competition. In particular, if a platform increases its quantity of advertising, it is optimal for its competitors to raise their respective advertising quantities as well. The model suggests that the merger of advertising sales houses of several platforms increases the advertising offers of all the competing platforms of the market (both the merged and unmerged), holding the quality of platforms unaffected. I further test the theoretical prediction with TV market data and model used in the first chapter, the empirical counterfactual simulation suggests same results as the theoretical model.
Chapter 1
Advertising Competition in the
Free-To-Air TV Broadcasting Industry
1English summary
This chapiter empirically investigates the advertising competition in the French broadcast tele-vision industry within a two-sided market framework. We use a unique dataset on the French broadcast television market including audience, prices, and quantities of advertising of twenty-one TV channels from March 2008 to December 2013. We specify a structural model of oligopoly competition and identify the shape and magnitude of the feedback loop between TV viewers and advertisers. We also implement a simple procedure to identify the conduct of firms on the market. We find that the nature of competition in the French TV advertising market is of the Cournot type. Further, we provide empirical evidence that the price-cost margin is not a good indicator of the market power of firms operating on two-sided markets.
Résumé français
Ce chapitre étudie la situation concurrentielle du marché de la télévision en clair. A l’aide d’un modèle de concurrence oligopolistique, nous identifions la nature et l’ampleur des externalités entre téléspectateurs et annonceurs publicitaires. Nous contribuons à la littérature en mettant en œuvre une procédure simple permettant de tester le type de comportement des entreprises sur un marché. Nous démontrons que la nature de la concurrence sur le marché publicitaire de la télévision est de type Cournot (i.e. une concurrence sur la capacité d’offre d’écrans publicitaires). En outre, nos estimations nous permettent de conclure que, sur un marché biface, des taux de marge élevés sur une des faces du marché ne signifient pas une absence de concurrence. Nous validons ainsi empiriquement un résultat théorique établi par Tirole et Rochet en 2006.
1
1.1
Introduction
Consider a platform which provides two goods (or services) to two distinct but interrelated groups of consumers. By using the platform, each group generates either positive or negative externalities to the other groups of consumers. When one group of consumers is desirable (undesirable) to another group, the platform can strategically decrease (increase) the fee charged to the desirable (undesirable) group, thereby increasing the willingness to pay of the other group. In the case of free TV, the platforms (i.e., the TV channels) enable interactions between two groups of end users, namely the viewers and the advertisers; more precisely, they broadcast TV programs free-to-air to the TV viewers but charge the advertisers, observing that the advertisers’ willingness to pay increases with the viewership of TV channels. In other words, the broadcast TV market is a particular two-sided market.2 As explained in Rochet and
Tirole (2008), taking into account the two-sidedness of markets can challenge the usual tests in competition analysis since the pricing strategies of two-sided platforms differ to those of firms operating on one-sided markets. This paper aims to provide an empirical evaluation on the significance and the magnitude of two-sided network externalities in a two-sided market. More specifically, we explore the two-sidedness of the broadcast TV industry in order to identify the shape of the feedback loop between TV viewers and advertisers, to clarify the conduct of TV channels on the advertising market, and to provide a credible evaluation of traditional economic tools implemented by competition authorities on this market.
Our work is motivated by a recent acquisition case in the French broadcast TV industry. On 26 January 2010, the French competition authority (Autorité de la concurrence, AdC) autho-rized the acquisition of two free broadcast TV channels TMC and NT1 by the media-holding company, the TF1 Group, subject to various conditions. Before the acquisition, the TF1 Group, as the most active media group in the French free TV broadcasting industry, already enjoyed a dominant position on the national TV advertising market by holding approximately 40% − 50% of the market. The acquisition of these two free channels strengthens the Group’s position. If all three channels (i.e., TF1, TMC and NT1) could offer their advertising spaces through one common advertising sales house, the operation could lessen the degree of competition in the advertising market. For this reason, the AdC approved the acquisition only under behavioral remedies, among which the preservation of the separation in advertising offers of TF1 on the one hand, and of TMC and NT1 on the other hand.3
Behavioral remedies are usually difficult to administer, and the non-discriminatory firewalls are best implemented when the firms involved are subject to the scrutiny of the industry regu-lator (See Motta, 2004). Being aware of this fact, the practice of the TF1 Group was monitored by the Conseil supérieur de l’audiovisuel (CSA) for five years, i.e., from 26 January 2010 to 26 January 2015, during which time the remedies should have been respected.4 According to the CSA, the commitments have been respected, particularly because TMC and NT1 on one side and TF1 on the other side have managed their advertising offers through independent adver-tising sales houses. It remains to be seen whether the aim of the remedies has been achieved, i.e., whether the implemented remedies have been efficient in protecting the consumer surplus. This evaluation exercise is not straightforward, as the decision of the authority coincided with the launch of the digital terrestrial TV (DTTV) in 2005 and with the extension of its
2
Note that this situation is similar to the case of internet. Indeed users search on the web free of charges; however, when they click on specific hyperlinks, they also trigger ads which generate revenues for the owner(s) of web browsers.
3
See the AdC’s decision at
http://www.autoritedelaconcurrence.fr/pdf/avis/10DCC11decisionversionpublication.pdf. 4
The Conseil Supérieur de l’audiovisuel is an independent authority whose main objective is to protect audiovisual communication freedom.
coverage over the French territory until 2012.5 This new technology has boosted the audience
for TVs; thus, without market concentration, the surplus of French households’ free TV con-sumption would have been expected to rise over the period. At the same time, the acquisition could allow the TF1 Group to broadcast the same TV programs on the different channels of the Group through a coherent programming, which may contribute to a widening of the audience. To decipher the role of respective determinants in the change in consumer surplus following the adoption of the above behavioral remedies, a complete market analysis is required.
Contrary to pay TV channels for which the subscription fees of TV viewers represent a significant share of income, the TV channels broadcasting free-to-air draw their revenue only from advertising. Their business model is distinctive in the sense that the demand of TV viewers can affect their revenues only indirectly through its interaction with the demand of advertisers. The larger the audience size of a TV channel, the higher advertiser willingness to pay for advertising spaces; however, the TV viewers may be ad-averse, in which case, the larger the quantity of advertising, the higher the risk that the audience size of the TV channel shrinks. In other words, the free TV channels experience a feedback loop between viewers and advertisers. If these network externalities are identified to be significant, it is necessary to consider the feedback loop in the analysis of competition outcomes.
This calls for considering the free TV channels as two-sided platforms selling two distinct products: TV programs to viewers on the one side and advertising slots to advertisers on the other side. A first econometric task here amounts to specifying a structural model of oligopoly competition among free TV channels and identifying the two-sided nature of this industry.
Rochet and Tirole (2003) and Armstrong (2006) provide a framework for analyzing two-sided markets. Based on this approach, theoretical articles by Anderson and Coate (2005), Cunningham and Alexander (2004), and Nilssen and Sørgard (2000), among others, have ad-dressed TV advertising competition by assuming that the ads are a nuisance to TV viewers and the TV channels compete by setting advertising quantity. However, only a few empiri-cal analyses use this approach. Until now, the empiriempiri-cal studies have examined the two-sided structure of the industries of newspapers (Chandra and Collard-Wexler,2009; Argentesi and Ivaldi, 2007; Argentesi and Filistrucchi, 2007), magazines (Song, 2011), yellow pages (Rysman, 2004), and radios (Jeziorski, 2014). Wilbur (2008) used the two-sided concept to analyze the importance of TV viewers’ and advertisers’ preferences in driving TV channels’ programming choices and the impact of ad-avoidance technology on TV channels’ advertising revenues with data of six US TV channels. Previous empirical findings suggested that the attitudes of the audience (readers/viewers/listeners) toward advertising vary by industry: The audience tends to appreciate advertising in magazines, yellow pages, and certain types of newspapers, but it dislikes advertising in broadcasting industry (radio and TV). Hence, it is an empirical issue to identify the sign of the network effects between the two sides of the market, and this is crucial because depending on this sign, one can expect from the theory that it impacts the pricing of the distinct product on each side of the market.
Broadcasting TV channels constitute the most important medium for advertising. However, only a few papers have empirically analyzed the advertising competition in this industry. Some, such as Masih (1999) and Ekelund et al. (2000), have estimated the price-elasticity of adver-tising demand, but in models that do not account for the feedback loop between TV viewers and advertisers. Our paper contributes to this literature by investigating the advertising com-petition in the French free TV industry cast in a two-sided market framework using a unique monthly dataset on 21 French national free TV channels from March 2008 to December 2013. Estimating the demand of both sides (viewers and advertisers) of TV channels, our estimation
5
results suggest that the TV viewers dislike advertising on TV and that the network effects between TV viewers and advertisers are significant.
To perform the competitive analysis raised by the merger between the channels TF1, TMC, and NT1 in this setup, it is necessary to well identify the conduct of TV channels. In quanti-tative analysis for competition policy, it is usual to assume Bertrand competition; however, in the context of broadcasting markets, Cournot competition is often considered. In the French case, because of some regulatory rules limiting TV advertising, there is a strong presumption that the Cournot case is well adequate. To confirm this conjecture, we implement a simple procedure to test for the market conduct of French free broadcast TV channels by checking for the realism of estimated marginal costs that we derive from the estimates of our model under the two alternative conduct assumptions.
We are in the position to perform a competitive analysis of the outcomes in the French broadcast TV industry after the merger that we propose to investigate. Our results show that, everything else being equal, there is no significant difference in terms of advertising quantities between the observed situation under which the remedies imposed by the competition authority apply and the counterfactual scenario where the remedies have not been implemented. This means that, with or without remedies, the market outcomes are equivalent. This result is mainly explained by the fact that the effect of a higher level of cooperation among advertising sales houses is defeated by the viewers’ adverse taste for advertising.
This paper is organized as follows. In Section 2, we present the market characteristics and data sources. In Section 3, we propose a structural model for the TV industry. Section 4 is devoted to the econometric specification, Section 5 to the estimation method and results, and Section 6 to the economic analysis of our estimated model to determine, in particular, the conduct that provides the best representation of the data generating process. The competitive analysis is carried out in Section 7 to assess the market power of TV channels and to discuss the counterfactual experiment aimed at evaluating the impact of a merger between advertising agencies in the French TV market. We then conclude in Section 8. representation of the data generating process. The competitive analysis is carried out in Section 7 to assess the market power of TV channels and to discuss the counterfactual experiment aimed at evaluating the impact of a merger between advertising agencies in the French TV market. We then conclude in Section 8.
1.2
Market and data analysis
1.2.1 Market characteristicsDigital terrestrial television (DTTV) was formally introduced in France in the beginning of 2005 and gradually replaced the aged analogue broadcasting mode of free TV.6 This new technology
offers more broadcasting capacity, and its implementation stimulated the arrivals of several new TV channels. Before the commercial launch of DTTV, there were only five national TV channels broadcasted free-to-air in France. After the CSA officially allowed and promoted the adoption of DTTV, 11 new free-broadcast TV channels were launched at once. Later, in December 2012, six additional channels were initiated. Currently, French households have access to a total of 22 free broadcasting TV channels.7
6
With DTTV, households can receive many more channels than with a traditional TV aerial, all in digital quality. To switch to DTTV, households need an adapter (a set top box) for their television and to adapt their aerials.
7
Notice that our analysis only focuses on the free-broadcast TV market. Pay TV channels are included in the outside goods of our econometric model below. During the period of observation (2008–2013), while there are between 184 and
The newly launched DTTV channels, as entrants in the national TV market, do not enjoy the same market position as the five incumbent channels. In Table1.1 and Table 1.2, we provide comparative statistics on audience shares and advertising revenue shares of the incumbent channels versus the new arrivals. The market shares of new entrants are remarkably lower than the incumbents on both sides.
Among these 22 free TV channels, 17 channels are private and 5 are publicly owned. Fifteen of them are general, offering a wide range of program genres and targeting a large audience. Aside from these, two channels are specialized in news broadcasting, one in music, one in children’s programs, one in documentaries, one in films and another in sports. Many of these channels belong to the same TV group. In Table 1.3, we provide a list of TV channels in our dataset with their type (generalist, news, music, movie, sport, child, or documentary), ownership nature (public or private), and TV group membership.
Broadcast TV stations are two-sided platforms connecting TV viewers to advertisers. TV viewers value the media content and are willing to pay for it. As they watch TV, they generate audiences that, in turn, are valuable for advertisers. Contrary to pay TV channels that charge subscription fees to viewers, the broadcast TV stations only require the viewers to bear the advertising.
On the advertising market, advertisers look for audiences, and TV channels supply them. Advertisers value audience for the ability to inform and/or persuade viewers on the merits of products or services they have to commercialize. The TV channels sell their advertising spaces through advertising sales houses (ASHs). In general, each TV group that holds several TV channels owns or cooperates with one ASH. In practice, each TV group determines the capacity of advertising spaces for all of its channels based on their program schedules and communicates the various advertising spots to its ASH. Advertisers search for ad-spots that match their expected audience (in terms of number of viewers and their demographics) from different ASHs. Advertisers and ASHs agree, for each ad-slot, on a cost per thousand (CPT), which corresponds to the value of reaching 1000 viewers. A channel’s revenue from an advertising spot is equal to the spot’s CPT times the number of viewers of the spot. On this basis, we derive the average price per minute of an advertising spot by dividing the observed revenue by the corresponding number of advertising minutes.
In France, TV programs are published one month prior to the broadcasting time; last minute adjustment occurs rarely. In contrast, the advertising campaigns are adjusted in real time to reach the desired effects.
We notice from our data that the number of advertising spots does not vary much from one channel to another, while there is a large difference in the prices of the advertising spots of incumbent channels and new entrants (See Table 1.4 for details on the standard errors of advertising prices and quantities). The prices considered in this study are average prices of an advertisement but are not on a per-viewer basis. Differences in the prices of advertising spots between two categories of TV channels reflect differences in their viewerships.
In France, the number of advertising minutes on TV is regulated. The CSA imposes double caps on different TV channels on the basis of clock hours and daily average levels.8 As we use
207 pay TV channels available in France, their cumulated audience share amounts to not more than 10% in total, and their cumulated revenue share is approximately 16% to 18%. The individual market share of any of these pay TV is then negligible, and statistics on the market share of each pay channel are not available.
8 The average time per hour per day devoted to advertising must not exceed 6 minutes for public TV chan-nels, 9 minutes for the incumbent private chanchan-nels, and 12 minutes during the first 7 years of broadcasting for the new channels launched in 2005 and 2012. Moreover, the advertising time cannot exceed 12 minutes within any given clock hour for the private TV broadcasters and 8 minutes for the public TV broadcasters. (Source: https://www.legifrance.gouv.fr/affichTexte.do?cidTexte=JORFTEXT000019986596dateTexte.)
monthly average level of advertising herein, what matters is whether the regulation caps on maximum minutes of advertising per day are binding. In Table 1.5, we compare the observed advertising minutes to the maximum minutes authorized by the CSA. Note that the regulation constraints (at monthly average level) are never binding over the entire period of observation.9
1.2.2 Data
The CSA has given us access to a first dataset consisting of information on audience, gross ad-vertising revenues and adad-vertising quantities. This dataset covers detailed monthly information on 21 free TV channels in France from March 2008 to December 2013.10
The broadcasting data come originally from Médiamétrie, which provides a measurement on the television audience, based on a panel of households equipped with one or more TV sets in their main residence. This panel has been built to account for both the socio-demographic characteristics of households in metropolitan France and the structure of the television supply. It is made up of nearly 4,300 households, which corresponds to approximately 10,500 individuals aged 4 and over. In each home, Médiamétrie installs one or more (depending on how many pieces of equipment they have) audimeters fitted with a remote control with individual keys, which constantly record all uses of the television set(s) in the household and all the viewing habits of each member of the household and their guests.11 This survey gathers information of the audience shares, the total population having access to TV services (all reception modes together) in metropolitan France, and the average watching time per day per individual. The average watching time per day per individual is at aggregate level, as we do not have detailed per channel data for this variable.
The advertising data are measured by Kantar Media. We have access to the number of ad-vertising minutes and the gross adad-vertising revenues per month of different TV channels. From these data, we construct the number of advertising spots and their corresponding prices. The number of advertising spots is obtained by dividing the number of advertising minutes by the standard length of an advertising spot, which lasts for 30 seconds. The price of an advertising spot is calculated by dividing the gross advertising revenues by their corresponding numbers of advertising spots. The prices calculated in such a way correspond to the equilibrium prices established on the market on the basis of the channels’ audience performance and quantities of advertising supply.
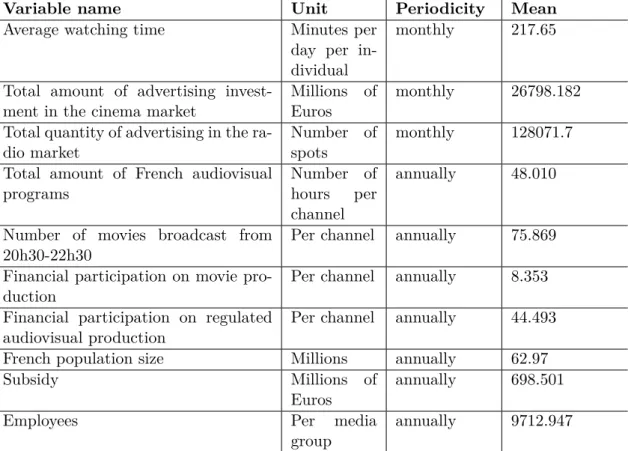
In addition to the dataset provided by CSA, we collected complementary information from published reports of the Centre national du cinéma et de l’image animée (CNC), Kantar Media and different TV channels. The list of variables include the total amount of advertising invest-ment in the cinema market, the total quantity of advertising on radio, the total number of hours of French audiovisual programs broadcast during the year, the number of movies broadcast dur-ing the prime time (20:30 - 22:20), the amount of subsidies allocated to the public broadcasters, the financial participation of each channel in the production of movies and French audiovisual programs, and the total number of employees of each TV group.12 These data either serve as
instrumental variables or as components of cost equations at the estimation stage. Their units,
9
The restrictions on advertising minutes is an important issue, though our data do not allow exploration of its effect. This topic is studied in Crawford et al. (2012) and Zhang (2016).
10
Our sample excludes Arte, the Franco-German public channel, because we have no information on its advertising revenues. Nevertheless, this should not affect the significance of our results because the audience share of this channel is very small, less than 2%.
11 Source Médiamétrie: http://www.mediametrie.fr . 12
Many channels in our sample share a common ownership, i.e., belong to the same media group. It is impossible to distinguish the number of employees of different channels in the same media group.
periodicities, and means are provided in Table 1.6.
1.3
Structural model
We specify a structural model of oligopoly competition for the French broadcast TV industry. There are J channels belonging to K owners that each broadcast 24 hours per day free-to-air. The TV channel operators face two interacting markets: a market for broadcasting and a market for advertising. The TV viewers watch the programs for free, so there is no direct profit generated from the broadcasting market. However, the audience of free channels affects the demand of advertisers. By allowing the channels to compete on the advertising market through audience, our model specification explicitly captures the interactions between viewers and advertisers. This model setting comprises three parts: the demand of audience, the demand of advertisers, and the supply of TV channels.
1.3.1 Demand of TV viewers
Let I be the potential market size corresponding to the total French population. At each point in time, an individual i = {1, ..., I} chooses to watch one and only one of the broadcasting channels j = {1, ...J }, or to exercise an outside option (like watching a pay channel, reading a magazine, going to a cinema, or another substitutable activity). As, in the empirical analysis, we consider the national TV channels for six calendar years only, the too weak variability in individual demographics at this level for such a short period of time cannot allow us to identify the heterogeneity of viewers’ tastes. This is why we here adopt a nested logit model to specify the demand of TV viewers.13
As already mentioned in Section 2.1, French households certainly differentiate between watching an incumbent and a newly launched channel. The implementation of DTTV ser-vice has been achieved region by region, and the newly launched DTTV channels were made accessible to the French households progressively during the entire period of our observation.14
Those who get used to watching the incumbent channels do not switch to the new channels immediately, as the latter lack notoriety. To account for the difference in notoriety between the incumbent and entrant channels denoted by m and n respectively, we classify them into two separate nests. Then, in what follows, we assume that a TV viewer first chooses among three categories g = {m, n, 0}, where 0 stands for the outside option that corresponds to all the activities other than watching the free TV; second, (s)he decides to watch a channel j ∈ Cg, where Cg refers to the set of channels belonging to the category g.15 Finally, to account for a change in notoriety over time, we introduce time specific effects at the empirical stage below.
At each given period t, the indirect utility of consumer i from watching channel j, belonging to the category g, is given by
Ujgti = δjt + ζjgti , (1.1)
13
Grigolon and Verboven (2014) address the issue about whether and when the logit and nested logit (NL) models can be used as reasonable alternatives to the computationally more demanding random coefficient logit (RC) model and find that the specific distributional assumptions of the RC and NL models regarding the evolution for the group dummy variable (i.e., the variable that characterizes the different nests) do not matter much.
14At the moment where the DTTV was formally adopted in 2005, only 35% of the French population was covered by its service. This coverage rate has been gradually raised to 85% in 2007 and to 97% by the end of 2011.
15We tested more complex specifications by adding nests according to the channels’ type, nature, and group member-ship. None of them allow us to obtain economically meaningful models and/or to identify the corresponding parameters of the additional nests.
with
δjt = ¯Vjt+ αAjt+ ξt+ ξjt, (1.2) and
ζjgti = εigt+ (1 − σ)εijt, (1.3) where δjt represents the mean utility level of TV viewers from watching channel j at time
tand ζjgti captures the departure of consumer i’s preference from the common utility level. The component ¯Vjt is a deterministic part that depends on the idiosyncratic characteristics of channel j, Ajt represents the quantity of advertising at channel j and time t, ξt is a time specific component, ξjt is a random term reflecting the effect of unobserved factors of channel
j at time t on the mean utility of TV viewers. The parameter of interest to be estimated, i.e., α, measures the audience’s attitude towards advertising. The error term ζi
jgt is specified as a weighted sum of two unobserved variables: εi
gt, which affects the individual i’s preferences common to all channels belonging to category g, and (1−σ)εijt, which impacts the individual i’s preferences specific to product j. The error terms εi
gt and εijt are distributed in such a way that the individual preferences have an extreme value distribution and are allowed to be correlated across channels j (See MacFadden et al., 1978 and Williams, 1977). The parameter of interest to be estimated, σ ∈ [0, 1), measures the degree of substitutability of TV channels belonging the same category from the TV viewers’ point of view. As σ approaches one, the different channels within the category g are perceived as highly substitutable for TV viewers, while as σ decreases, the correlation of preferences for channels within a same category decreases. Typically, σ = 0 signifies that the TV viewers are equally likely to switch between channels in different categories as between channels in the same category.
Note that there is no price in this model because watching TV is free. In fact, the quantity of advertising plays the role of price in the usual differentiated-products oligopoly model. However, here, the parameter α can be either positive or negative according to the attitude of viewers towards advertising: If α is positive, viewers value ads positively; if it is negative, they dislike advertising.
Following Berry (1994), the mean utility level for the outside good is normalized to 0, i.e.,
δ0 = 0, the demand of viewers is specified as
ln(sjt) = ¯Vjt+ αAjt+ σln(¯sjt/g) + ln(s0t) + ξt+ ξjt, (1.4) where sjt (s0t, respectively) is the probability that an individual chooses to watch channel j
(to take the outside option) at time t. The probability sjt is decomposed as the product of two probabilities: the probability ¯sjt/g of watching channel j given that channel j belongs to category g and the probability ¯sgt that the individual chooses to watch channels of category g. This decomposition matters because of the different accessibility of incumbent and new DTTV channels.
Given that we assume a representative consumer, the choice probabilities sjt, ¯sjt/g, s0t
coincide at the aggregate level with the market share of channel j, the market share of channel
j within its category and the market shares of the outside goods, respectively. If, at time t, Ytis the market size (that we precisely define later) and if yjt is the number of TV viewers watching TV j, the market share of channel j and its market share within its category are measured as
sjt = yjt/Yt and ¯sjt|g = sjt
. P
j∈Cg sjt, respectively, while the market share of the outside good
is obtained as s0t= 1 −Pjsjt.
From Equation (1.4), we define the number of viewers as yjt = sjtYt ≡ yjt(A), where
1.3.2 Demand of advertisers
In the spirit of the model in Rysman (2004), we consider a representative advertiser whose expected revenue per viewer from an advertising spot on channel j, denoted by rj, is such that
rj = τj(CP Tj/1000), where CP Tjmeasures how much (s)he received from reaching an audience of 1000 individuals and where τj is a scale factor at least larger than one.16 In what follows, for simplicity of notation, we consider the vector c = (c1, c2, . . . , cj, . . . , cJ), where cj = CP Tj/1000. Let p = (p1, p2, . . . , pj, . . . , pJ) be the vector of per minute price of advertising spots of different TV channels. We specify the representative advertiser’s profit function as17
ΠA= J
X
j=1
(τjCj − pjaj). (1.5)
On the advertising market, TV stations and the advertiser agree on a CP Tj (or cj) based on four variables: 1) the length of advertising messages, aj; 2) the total capacity of channel j, Aj; 3) the viewership of channel j, yj, and 4) the decomposition of audience, Dj, in terms of socio-demographic characteristics. We thus specify the market-determined cj using a Cobb-Douglas form, namely, cj = Dvj1a v2 j A v3 j y v4 j . (1.6)
Specifically, v2 measures the decreasing return of large advertisement,18 v3 captures the
“business stealing effect,”19 and v
4 measures the sensitivity of advertisers to the viewership of
TV channels. We expect the value of v2 to be between 0 and 1, the value of v3 to be negative,
and the value of v4 to be positive.
Replacing the expression (1.6) into Equation(1.5) and maximize ΠA over aj, we obtain the inverse demand of advertising as:
pj = v2τjDjv1a (v2−1) j A v3 j y v4 j . (1.7)
Denote the size of advertising market to be ¯m, then aj = Aj/ ¯m, thus,
pj = v2τjDjv1m¯
(1−v2)A(v2+v3−1)
j y
v4
j , (1.8)
which yields, with time index and in logarithmic form:
log pjt = log[v2τjtDvjt1m¯(1−v2)] + (v2+ v3− 1) log Ajt + v4log yjt. (1.9) The final empirical specification of this inverse demand function is discussed below.
1.3.3 Supply of TV channels
The J free-broadcast TV channels belong to K different media groups on the French market. Each media group owns or cooperates with a private advertising sales house through which
16
It is appropriate to assume that the willingness to pay of the advertisers (CP Tj) represents only a fraction of their
expected benefit from advertising (rj).
17
We drop the time index t in what follows, as it does not generate misunderstanding.
18 It is expected that a long advertising message has more chance to be remembered by the TV viewers, but the viewers may get tired of the same ad in time. Therefore, the advertiser’s willingness to pay takes parabola form with respect to the length of the advertising message.
19
That is to say, the fact that an advertisement is easily ignored in a broadcast network with a massive amount of advertisements.
its channels exchange with the advertisers. Channels within the same media group maximize jointly their profits taking account of the strategic reactions of other groups.
The profit function of a media group Gk, k = {1, ..., K} from selling advertising spaces is given by ΠGk = X j∈Gk Πj = X j∈Gk [(pj − cj) Aj− Fj] , (1.10) where cj and Fj are the marginal and fixed costs of channel j, respectively. TV stations broadcast their programs free-to-air but mainly cover their programming costs from advertising revenues. The fixed cost Fj measures the sunk investment of channel j on the acquisition of its programs’ broadcasting right. The variable costs of advertising include mainly the management cost of advertising and fixed discounts proposed by the TV channels to the advertisers. In practice, at the beginning of every year, the TV stations agree with each of their potential advertisers on a discount for the advertisers’ advertising messages during the year. Such a practice consists in a marketing strategy of TV stations to capture future clients. Because the discount is specific between each channel and advertiser, it varies with time and channels.
The conduct of TV groups affects the way the feedback loop between TV viewers and advertisers works. Under Cournot competition, when a media group raises the advertising quantity broadcast for one of its channels, the prices of advertising spots on this channel drop, and the channel attracts less ad-averse TV viewers; as a consequence of the loss in audience, the advertisers’ willingness to pay for ads on this channel diminishes. In the case of competition à la Bertrand on the advertising market, when a TV group raises the advertising prices for one of its channels, some advertisers will drop their advertising, while some of ad-adverse TV viewers will be attracted. However, as this attracts more viewers because of the lower quantity of advertising, advertisers’ willingness to pay for advertising on this channel will rise, so the channel will advertise more. This will in turn affect viewership and subsequently advertising, and so on.
Formally, under Cournot competition, each group Gk determines the optimal advertising quantities of channels within the group (Ajk, j ∈ Gk), taking the advertising quantities of other groups as given, namely,
max Ajk;j∈Gk {ΠGk|A−j} = maxA jk;j∈Gk X j∈Gk {[pj[Aj, yj(A)] − cj] Aj|A−j} , (1.11)
where pj[Aj, yj(A)] is the inverse-demand curve of advertisers and A−j is the set of strategic
ad-vertising decisions of all channels other than j. The associated first-order condition is obtained as (pj− cj) + Aj ∂pj ∂Aj + Aj ∂pj ∂yj ∂yj ∂Aj + X i6=j,j∈Gk Ai ∂pi ∂yi ∂yi ∂Aj = 0, ∀j ∈ Gk. (1.12) The advertising quantity affects the market clearing price through two ways: directly, by the standard price response to the advertising quantity supplied, which is given by the second term on the left-hand side of Equation (1.12), and indirectly, by the network effect between viewers and advertisers, represented by the third and fourth terms.
Under Bertrand competition, each group Gkdetermines the optimal spot price of advertising of channels within the group (Ajk, j ∈ Gk), taking the pricing of the other groups as given, namely, max pjk;j∈Gk {ΠGk|p−j} = max pjk;j∈Gk X j∈Gk {(pj − cj)Aj[pj, yj(A)] |p−j} , (1.13)
where Aj[pj, yj(A)] is the direct demand curve of advertisers, and p−j is the set of advertising
prices of all channels other than j. The associated first-order condition is
Aj+ (pj− cj) ∂Aj ∂pj + (pj− cj) ∂Aj ∂yj ∂yj ∂Aj ∂Aj ∂pj + X i6=j,i∈Gk (pi− ci) ∂Ai ∂yi ∂yi ∂Aj ∂Aj ∂pj = 0, ∀j ∈ Gk. (1.14)
The explanation of the different terms of Equation (1.12) applies here for Equation (1.14), as well.
In Section 6.2, we conduct a test on the estimated marginal costs to conclude on the nature of the competition in the French broadcast TV industry.
1.4
Econometric specification
1.4.1 Demand of TV viewersThe deterministic part of the indirect utility of consumers ¯Vjt in Equation (1.4) is specified as a linear combination of channel-fixed effects, i.e., dummies for all channels. In addition, two types of temporal effects are considered through the term ξtin Equation (1.4), which is composed with dummies for each year and for each month: the yearly dummies capture potential changes in policy, fluctuations of the economic climate and the generalization of the digital TV technology, while the monthly dummies capture the seasonality of TV advertising.
Here, the market share of TV channel j, sjt, differs from the so-called audience share, qjt, used in the jargon of media marketing. The audience share, which is directly available from media marketing companies such as Mediametrie, is measured in terms of the total population
watching the TV over a market. Here, for any given period of time, we consider the French
population choosing to watch a free TV channel (j) or to select an activity other than watching free TV, which includes the possibility to watch a pay channel or enjoy other entertainments, such as going to a movie theater or reading a newspaper. To do so, we consider, for each period, the total population having access to a TV service, Mt, and we derive the augmented audience
yjt, i.e., the total number of TV viewers watching channel j as yjt = qjtMt. Then, if Ytdenotes the size of the French population at period t, we estimate the market share of channel j as
sjt = (yjt/Yt).20
Finally, from Equation (1.4), the TV viewers’ demand function to be estimated is given by
ln(sjt) − ln(s0t) = αAjt + σln(¯sjt/g) + Xjtβ + ξjt, (1.15) where Xjt includes all the dummy variables mentioned above.
1.4.2 Demand of advertisers
From Equation (1.9), we specify the inverse demand of advertisers to be estimated as
ln(pjt) = θln(Ajt) + ν4ln(yjt) + XjtAβ
A+ ξA
jt, (1.16)
where
θ ≡ ν2+ ν3 − 1. (1.17)
20 As using the size of the population having access to a TV service to measure the total population watching TV is indeed an approximation, we implement a robustness check by estimating the model for different values of Mt. The
In other words, we approximate the term log[v2τjtDvjt1m¯(1−v2)] by XjtAβA+ ξjtA by XjtAβA+
ξA
jt, where XjtA and ξjtA represent, respectively, the observable and unobservable characteristics of channel j at time t that impact the demand of advertisers. We specify XA
jt as a linear combination of dummies to identify channel, monthly, and annual fixed effects. Note that
θ = ν2 + ν3 − µ−1 captures the joint effect of business stealing and decreasing return to scale
of advertising, and v4 measures the sensitivity of advertisers to the viewership of TV channels
as discussed in the model above. We expect the estimated value of θ to be negative and the estimated value of v4 to be positive.
1.5
Estimation
The demand of TV viewers (Equation (1.15)) and the demand of advertisers (Equation (1.16)) are separately estimated using the two-stage least squares (2SLS) estimator. Because both equations encounter problems of endogeneity, an IV method is required; below, we explain our choice of instrumental variables for each equation.
1.5.1 Identification
Equation (1.15) entails two identification problems. The first one concerns the parameter σ. Conceptually, observing the viewers’ switch between channels within the same category (i.e., incumbent, entrant, or outside channels) over time should allow for identification of σ, as it involves changes in the conditional probabilities of choosing the same category. These variations can be the result of either changes in channels’ characteristics or changes in the number of channels operating on the market. However, there is a potential endogeneity problem if viewers switch a channel because of some unobserved changes in the characteristics of the TV channel. Indeed, in Equation (1.15), when ξjt is high, the market share sjt is high, but the conditional market share, ¯sjt/g, is also high, not only because of the viewers’ switch from channels of its own category but also because of some viewers that have switched from channels of other categories. For instance, when an incumbent TV channel j increases the quality of its broadcasting content during period t, it attracts additional viewers both from other incumbent channels and from the new channels. We do not observe this change in the quality of channel j, which is captured by ξjt; however, we observe an increase in its market share sjt and its conditional market share ¯
sjt/g. As a consequence, the estimate of σ could be biased upwards unless ¯sjt/g is properly instrumented.
The second issue of identification comes from the fact that the market shares of TV channels
sjt and the advertising quantities Ajt are determined simultaneously. The random term ξjt includes characteristics of channel j during period t that are unobserved by econometricians but are likely to be observed by the TV stations. The equilibrium level of advertising Ajt should be high (or low) if the TV operator anticipates that its viewership (its market share sjt) will be high (or low). Hence, without controlling for this fact, the estimate of α would be biased upward (or downward, respectively).
Data on advertising in markets other than the free TV market can be used to instrument the advertising quantity of TV channels, Ajt. Variables such as the total amount of advertising investment in the cinema market and the total quantity of advertising (in number of advertising spots) in the radio market are available on a monthly basis and constitute the best candidates to instrument Ajt. Indeed, they are correlated with the quantities of TV channels’ advertising because of competition across media for advertising. However, as it is unlikely that consumers
switch from radio or cinema to TV because of the advertising on these two media, these two variables are potentially exogenous with respect to the number of TV viewers.
To instrument the channel’s audience share within its own category, i.e., ¯sjt/g, we need vari-ables reflecting the status of TV channels in their own categories. In France, the broadcasting contents of TV channels are partially regulated. French law stipulates that TV channels broad-cast more than 40% of French audiovisual programs within some particular hours of the day; the incumbent channels mush accomplish this obligation within the 5 hours in the evening, from 18:00 to 23:00, while the new digital TV channels must satisfy the obligation within the day. As a consequence, we expect the incumbent channels to broadcast more French audiovisual programs. In addition, as a policy intended to protect the French cinema sector, the capacity of TV channels to broadcast movies is restricted, especially during the prime time (i.e., the time slot between 20:30 and 22:30). However, this constraint is somehow less stringent for the new digital channels. Hence, we use the total number of hours of French audiovisual programs and the number of films broadcast during the slot 20:30 – 22:30 to instrument ¯sjt/g. We expect that their variations identify the demand for channels within the nests (incumbent and new). The quantity of French audiovisual programs and the number of movies during prime time do not determine the global demand for a TV channel during one month, i.e., these two variables should be exogenous in Equation (1.15). In Tables 1.7 and 1.8, we provide a comparison on how these two measures vary both between and within the nests.21 As expected, we observe, from
the means reported on column 5 of Tables 1.7 and 1.8, that the incumbent channels broadcast on average more French audiovisual programs each year, while the new channels broadcast more movies during the prime time. From the values of standard deviations on column 6, we conclude that the regulation rules result in more important variations within the incumbent nest than within the new channels nest.
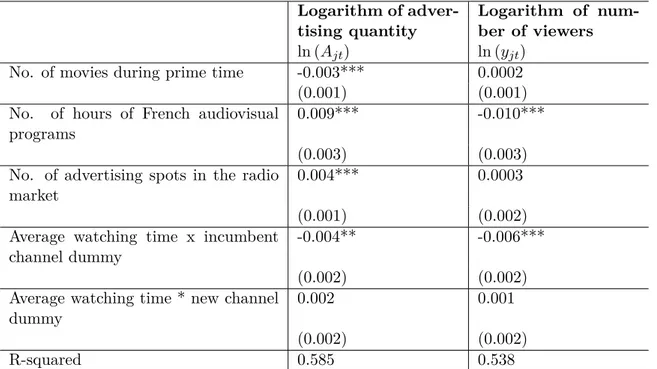
In Table 1.9, we report the OLS regression results of the instrumented variables on the instrumental variables to get a clearer idea of their explanatory relationships. Note that all of the four instrumental variables explain the quantity of advertising and the number of movies, while the quantity of French audiovisual programs explains the channels’ audience share within the nest.
The variables ln Ajtand ln yitmay be endogenous in Equation (1.16). While the fact that the analysts do not observe the quality of programs is taken into account through the unobserved component ξA
jt, the advertising agencies and the TV channels have more information on their respective qualities. In particular, they may anticipate when peaks (or drop) in audience on channel j at time t could happen. In this case, the advertisers are willing to pay more (or less) for the corresponding advertising spaces, while channel j sets more (or fewer) ads during time period t, as well. Then, ln Ajt and ξjtA are correlated. Now, if ln Ajt is positively (negatively) correlated with ξA
jt, the estimate of θ is biased upwards (downwards). Likewise, the quality of programs (in terms of attractiveness of audience) is unobserved by the econometricians but is likely to be observable by the advertising agency. That is, ln yit is correlated either positively or negatively with ξAjt. Without controlling for this potential endogeneity problem, the estimate of parameter v4 would be biased either upward or downward.
Summing up, the number of films broadcast during prime time, the total amount of French audiovisual programs broadcast, and the total quantity of advertising on the radio market are used to instrument ln Ajt. To instrument the number of TV viewers of TV channels, ln yit, we use a published indicator called the average watching time per day per individual. This
21 A referee has suggested using the “characteristics (type of programs) of other channels within the same group” as an alternative instrument. However, it is practically impossible to collect such information for the period under investigation.
variable measures the average number of minutes per day that an individual spent watching either a broadcast or a pay TV in France. It is an indicator of the change in consumption demand for TV; so, it is clearly correlated with the audience of any TV channel ln yit. However, this variable does not reflect the particular quality of any broadcast TV channel; therefore, it should be considered as exogenous in the equation of demand of advertisers. For the viewers’ demand, in Table 1.10, we report the OLS regression results of the instrumented variables on the instrumental variables to get a clearer idea of their explanatory relationships.
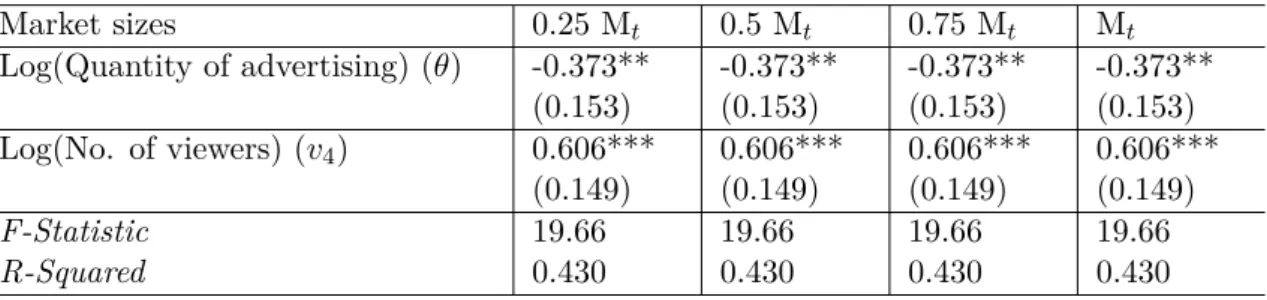
To validate our choice of instruments, we now proceed to the IV estimation of Equations (1.15) and (1.16) and conduct statistical tests for weak instruments and overidentification, which are reported in Table 1.11. Recall that, as using the size of the population having access to a TV service to measure the total population watching TV is indeed an approximation, we estimate the model for different values of the market size, Mt. For both equations and for all values of Mt, the Kleibergen-Paap rk LM statistic rejects the null of under-identification at the 1% significance level; the Stock-Yogo weak instrument test suggests the instruments are strong, while the Hansen J statistic does not reject the null hypothesis that the instruments are valid at the 5% and 10% significance levels. In other words, our instruments are statistically acceptable.
1.5.2 Estimates
The estimation results of Equations (1.15) and (1.16) are now separately reported in Tables 1.12 and 1.13. Note that scaling down the value of Mtdoes not significantly affect the estimated coefficients. This means that our estimates are robust and that, for the sequel, we can choose any market size. In practice, we use the total population watching TV.
For the TV viewers’ demand, both the coefficient of advertising and of within-nest shares are significant at the 5% significance level. As expected, the TV viewers respond to an increase of advertising by reducing their watching demand, i.e., ˆα < 0. The estimate ˆσ is significantly
less than 1, indicating that there exists competition between the five incumbents and the new channels; however, the significance level of ˆσ suggests that there is segmentation between
categories.
To determine whether the instruments used in the estimation are helpful in fixing the en-dogeneity bias, we compare the results from the IV estimation with those from OLS in Table 1.14. We observe that the parameter estimates associated with the advertising quantity and the within-nest share in the viewers’ demand function strongly differ under the two types of estimation. Without controlling for the endogeneity bias, the quantity of advertising reflects the quality of TV channel and is estimated to have a positive effect on the audience of the channel. The disutility effect of advertising can be isolated from the quality of the TV chan-nel only if the endogeneity bias is properly controlled. Moreover, with the nested-logit model specification, the value of ˆσ should be between 0 and 1. This constraint is not satisfied by the
OLS estimation, though it is respected with the instruments described above.
For the advertisers’ demand, the coefficient ˆθ associated with the logarithm of the advertising
quantity is significant at the 5% significance level, while the coefficient associated with the logarithm of the audience level ˆν4 is significant at the 1% significance level. The estimated
results are consistent with our expectation in theory: the parameter ˆν4 is positive, which
suggests that advertisers’ willingness to pay increases with the viewership of TV channels. The negative sign of ˆθ reflects the combined effect of business stealing and decreasing return to scale
As for the demand of TV viewers, we compare the results from the IV estimation with those from OLS in Table 1.15. We observe that the IV estimates are not significantly different from the OLS estimates. Our results suggest that the endogeneity problems in Equation (1.16) are not statistically significant. In the sequel, we adopt the IV estimates, while the results below would not change significantly by using the OLS estimates.
1.6
Empirical analysis
1.6.1 Demand elasticitiesThe estimated elasticities of demand of TV viewers are reported in Tables 1.16–1.18. On average, the TV viewers dislike advertising. It is estimated that a 1% increase in advertising reduces the audience of a TV channel by 0.5%. The TV viewers are more sensitive to ads on the new digital channels than on the incumbent channels. Moreover, we notice that the viewers become more and more sensitive to ads over time, i.e., their adverseness to advertising increases with time. This is may be due to the greater number of offers on the TV market. Finally, we observe that the own-advertising-elasticities of audience differ according to the nature of the TV channel: public channels, private news channels, and other private channels.
Looking at the viewers’ cross-advertising elasticities of demand between pairs of TV chan-nels, the estimates indicate that an increase in the advertising quantity of one TV channel has a non-negligible positive effect on the audience of the other TV channels. On average, a 1% increase in the advertising quantity of a TV channel raises the audience of another TV channel by 0.03%.22 Overall, it seems more likely to observe a raise in the audience of other channels
when an incumbent channel increases its advertising quantity.
Considering the side of advertisers, the own price elasticity is on average equal at 2.7. However, as shown by Huang (2007), this value is biased because it is derived from advertiser’s inverse demand function.23 Nonetheless, given the high value obtained, one can reasonably
suspect that the advertisers’ demand is rather elastic, which is a sign that the advertising market is competitive. However, this invites further investigation of the degree of competition in this market.
By estimating the inverse demand of advertisers, we can estimate the flexibility of advertising
prices.24 The ad-price flexibility with respect to audience and advertising can be directly
obtained from their associated parameters in Equation (1.16), i.e., θ and ν4. From the estimates,
a 1% increase in the audience of a TV channel increases the ad price by 0.6% on average, while a 1% increase in the ad quantity of a TV channel decreases its average ad price by 0.4%. 1.6.2 Marginal costs and market conduct
To derive the values of marginal costs of different TV channels, we solve the first-order con-ditions associated with the profit maximization function of different TV groups, under either Cournot or Bertrand competition, namely, Equation (1.12) and Equation (1.14). To do so, we need to take into account the ownership of TV channels. The 21 TV channels in our data set
22 More disaggregated cross-advertising elasticities of audience are available from the authors upon request. 23
Gregory Crawford et al. (2012) refer to Huang’s article, where it is shown that the price elasticity derived from an inverse demand elasticity can be biased upward or downward as the projection of one variable on another is not the inverse of the projection of that variable on the first one. Note that it is not straightforward to determine the sign of the bias.
24
The price flexibility is the percentage change in the price of a commodity associated with a 1% increase in the quantity demanded of that commodity or a related variable, all else remaining constant.” (See Houck, 1965).
belong separately to 10 different TV groups, and 9 groups of the 10 use one common advertising sales house for all channels within the groups. The exceptional case is the TF1 Group. The channels TMC and NT1 manage their advertising offers through an advertising sales house independent of that of the TF1 Group during the entire period of observation. We specify the four channels of the TF1 group as belonging to two independent entities, each with its own profit maximization problem.
A comparison of estimated marginal costs under these two alternatives is provided in Ta-ble 1.19. Clearly, the estimates under the Bertrand assumption do not sound economically meaningful, as they are either negative or much larger than observed prices. In practice, the quantities of advertising on TVs are at least physically constrained by the time of the day. In light of the literature on market conduct under capacity constraints, we conjecture that the channels compete in quantity setting on the advertising market.25
To test this conjecture, we implement a variant of the Davidson and MacKinnon (1981) J test, which aims to select the specification of an econometric model in the presence of one or more alternative hypotheses that purport to explain the same phenomenon. In our con-text, it can be applied using the estimated marginal costs of TV channels to test between the null hypothesis H0 of Cournot competition against the alternative hypothesis H1 of Bertrand
competition.
Let cco(cbe) and M Kco(M Kbe) denote the vectors of estimated marginal costs and estimated mark-ups under Cournot and Bertrand assumptions, respectively. Let p denote the vector of observed prices, and Z is a vector of variables affecting the marginal costs of different TV channels across different periods of time.
Under the Cournot assumption, we assume that
cco= Zµ + ε1 (1.18)
and p = M Kco+ cco, while under the Bertrand assumption,
cbe = Zλ + ε2 (1.19)
and p = M Kbe+ cbe, with ε1 and ε2 following centered normal distributions.
The Davidson and MacKinnon (1981) J test consists first in estimating by OLS a linear regression of the following form:
p = (1 − α)(M Kco+ Zµ) + α(M Kbe+ Z ˆλ) + u, (1.20) where ˆλ is the OLS estimate in Equation (1.19), and u is white noise. If α = 0, the conduct is of the Cournot type, while α = 1 corresponds to Bertrand competition. The value of remains to be tested by an asymptotic t-test.
In Appendix 2, we provide details on the test and prove that estimating Equation (1.20) is equivalent to estimate
cco= α(M Kbe− M Kco) + Zγ + u. (1.21) We cannot reject Cournot competition if ˆα ≈ 0 and ˆγ ≈ ˆµ, where ˆµ is the OLS estimate in
Equation (1.18).
To implement this procedure, we include in the vector Z the following variables: number of employees of different TV groups and dummies for controlling for channel and time fixed
25
On this point we refer to Kreps and Scheinkman (1983) who study a two-stage oligopoly game where, under a quantity precommitment, the Cournot outcome is the unique equilibrium solution of the price competition. In a related setting, Osborne and Pitchik (1986) show that, if capacities are chosen simultaneously before prices, the set of equilibrium capacities coincides with the set of Cournot quantities.