Subcellular distributions of trace elements (Cd, Pb, As, Hg, Se) in the livers of Alaskan yelloweye rockfish (Sebastes ruberrimus)
Benjamin D. Barst, Maikel Rosabal, Paul E. Drevnick, Peter G.C. Campbell, Niladri Basu
PII: S0269-7491(18)30204-5
DOI: 10.1016/j.envpol.2018.06.077 Reference: ENPO 11274
To appear in: Environmental Pollution Received Date: 15 January 2018 Revised Date: 29 May 2018 Accepted Date: 22 June 2018
Please cite this article as: Barst, B.D., Rosabal, M., Drevnick, P.E., Campbell, P.G.C., Basu, N., Subcellular distributions of trace elements (Cd, Pb, As, Hg, Se) in the livers of Alaskan yelloweye rockfish (Sebastes ruberrimus), Environmental Pollution (2018), doi: 10.1016/j.envpol.2018.06.077. This is a PDF file of an unedited manuscript that has been accepted for publication. As a service to our customers we are providing this early version of the manuscript. The manuscript will undergo copyediting, typesetting, and review of the resulting proof before it is published in its final form. Please note that during the production process errors may be discovered which could affect the content, and all legal disclaimers that apply to the journal pertain.
M
AN
US
CR
IP
T
AC
CE
M
AN
US
CR
IP
T
AC
CE
PT
ED
Subcellular distributions of trace elements (Cd, Pb, As, Hg, Se) in the livers of
1
Alaskan yelloweye rockfish (Sebastes ruberrimus)
2
3
4
Benjamin D. Barsta,b,*, Maikel Rosabalc, Paul E. Drevnicka,d, Peter G.C. Campbella, and Niladri Basub
5 6
a
Institut national de la recherche scientifique, Centre Eau Terre et Environnement (INRS-ETE), 490 de
7
la Couronne, Québec, QC, Canada G1K 9A9
8
b
Faculty of Agricultural and Environmental Sciences, McGill University, Montreal, QC, Canada, H9X
9
3V9
10
c
Département des sciences biologiques, Université du Québec à Montréal (UQÀM), Montréal, QC,
11
Canada, H2X 1Y4
12
d
Environmental Monitoring and Science Division, Alberta Environment and Parks, Calgary, AB Canada,
13 T2E 7L7 14 15 16 17 18 19 20 *
Corresponding author: Tel.: +1 514 216 6019; [email protected]
21
22
23
24
M
AN
US
CR
IP
T
AC
CE
PT
ED
Abstract 26Yelloweye rockfish (Sebastes ruberrimus) is an extremely long-lived species (up to ~120 years) of fish,
27
which inhabits the coastal waters of Alaska. Due to their long lifespans, yelloweye are known to
28
accumulate high levels of mercury, and potentially other trace elements, in their tissues. Relatively little is
29
known about the subcellular distribution of trace elements in the tissues of yelloweye rockfish; such
30
information can provide important insights into detoxification/toxicity mechanisms at the subcellular
31
level. To address this, we collected yelloweye rockfish (n=8) from the eastern coast of Prince of Wales
32
Island, Alaska in 2014. We determined the subcellular partitioning of trace elements (cadmium (Cd), lead
33
(Pb), arsenic (As), total mercury (Hg), and selenium (Se)) in yelloweye livers with a partitioning
34
procedure designed to separate liver cells into putative metal-sensitive fractions (cytosolic enzymes,
35
organelles) and detoxified metal fractions (metallothionein or metallothionein-like proteins and peptides,
36
granule-like structures) using differential centrifugation, NaOH digestion, and heat denaturation steps.
37
The resulting fractions were then analyzed for total Hg with a direct Hg analyzer and for trace element
38
concentrations by inductively coupled plasma-mass spectrometry (ICP-MS). For Cd, Pb, and As, the
39
greatest contributions were found in the detoxified fractions, whereas the majority of total Hg was found
40
in sensitive fractions. Selenium, an essential trace element, was distributed to a similar degree between
41
the sensitive and detoxified compartments. Results indicate that although yelloweye sequestered and
42
immobilized potentially toxic metals in detoxified fractions, the extent of binding differed among metals
43
and followed the order: Cd > As > Pb > Hg. In yelloweye rockfish livers, the accumulation of
non-44
essential elements at sensitive sites could lead to deleterious effects at the subcellular level, which should
45
be evaluated in future studies.
46
Keywords: subcellular partitioning; trace elements; mercury; detoxification; yelloweye rockfish; 47
Alaska 48
Capsule: Subcellular partitioning of yelloweye rockfish livers aids in understanding 49
detoxification of trace elements 50
M
AN
US
CR
IP
T
AC
CE
PT
ED
1. Introduction 51Yelloweye rockfish (YR; Sebastes ruberrimus) are one of the largest species of rockfish inhabiting the
52
marine waters of western North America, where their range extends from the Aleutian Islands to the Baja
53
Peninsula (Love et al., 2002). As their name would suggest, they often pass most their considerable
54
lifespans (up to ∼120 years) near steep rock piles on the ocean floor. Their long lifespans, large body size,
55
and late age at sexual maturity render them particularly susceptible to both recreational and commercial
56
fishing pressures. Currently, YR are listed as threatened in the Puget Sound-Georgia Basin of the United
57
States (NMFS, 2010) and as a species of special concern in Canada (COSEWIC, 2009). In addition to
58
overfishing, YR may be at risk from exposure to contaminants, as their tissues are known to contain
59
elevated concentrations of mercury (Hg) (Barst et al., 2015). For example, total Hg concentrations in the
60
edible muscle tissue of YR often exceed 0.5 µg g-1 wet weight (ww), the level at which sublethal effects
61
in fish are likely to occur (Sandheinrich and Wiener, 2011).
62
Despite reports of contamination of YR tissues, the associated health effects have remained
63
largely unexplored, as is the case for many wild species of fish. An exception, by Barst et al. (2015),
64
compared concentrations of essential (selenium (Se), copper (Cu), zinc (Zn)) and non-essential trace
65
elements (nickel (Ni), cadmium (Cd), mercury (Hg)) with the relative areas of melano-macrophage
66
aggregates (MA) in YR livers. Melano-macrophage aggregates are collections of immune cells that serve
67
to store and process the products of cell breakdown, and are considered a general biomarker of
68
contaminant exposure in fish (Wolke, 1992). An increase in MA area is often interpreted as an indication
69
of tissue damage. In YR livers, the relative areas of MA increased with increasing hepatic concentrations
70
of Hg, Se, Cd, and Cu, and these elements tended to be more concentrated in MA than the surrounding
71
tissues. The accumulation of non-essential metals in the MA of fish may indicate increased cell turnover
72
due to metals exposure. Interestingly, Hg and Se accumulated in MA to a similar extent, suggesting that
73
the two were present as a mercury selenide complex (Barst et al., 2015). The biological interaction of Hg
74
and Se has been well documented (Khan and Wang, 2009; Wang et al., 2012), and HgSe is widely
75
regarded as a non-bioavailable end-product of Hg detoxification in the organs of different species (Korbas
M
AN
US
CR
IP
T
AC
CE
PT
ED
et al., 2010; Palmisano et al., 1995). Furthermore, Se may also protect against Cd toxicity in wild fishes
77
(Ponton et al., 2016).
78
With this in mind, the determination of the subcellular distributions of trace elements may be
79
useful in determining the likelihood for toxic effects in the livers of YR, and may provide an overall
80
greater understanding of trace element partitioning in wild fish. Subcellular partitioning allows for the
81
distinction between metal-binding to potentially sensitive target molecules (e.g., cytosolic enzymes) and
82
organelles (e.g., mitochondria), where the binding of non-essential metals may lead to negative effects,
83
and metal accumulation in detoxified metal fractions (e.g., heat-stable proteins and metal-rich granules),
84
which may minimize toxic effects (Campbell and Hare, 2009; Wallace et al., 2003). In this context, we
85
determined the subcellular partitioning of Cd, Pb, As, total Hg, and Se in order to further our
86
understanding of the internal handling of these elements in the livers of YR collected in southeast Alaska,
87
USA. A subcellular partitioning procedure using differential centrifugation, NaOH digestion, and heat
88
denaturation steps was used to separate liver cells into operationally-defined metal-sensitive fractions
89
(mitochondria, microsomes and lysosomes, and heat-denatured proteins) and detoxified-metal fractions
90
(heat-stable proteins and metal-rich granules). Following separation, trace elements were measured in
91
each fraction to determine the degree to which YR are able to detoxify non-essential elements effectively,
92
and to identify non-essential elements of concern for risk assessment.
93
2. Material and Methods 94
2.1. Sampling site and fish collection
95
In July 2014, adult YR (n=8; Table 1) were collected from Ernest Sound (55°51'59"N, 132°12'46"W)
96
located near Prince of Wales Island, Alaska. The sampling location was selected based on metal
97
concentrations presented in Barst et al. (2015). Fish were caught using rod and reel and were euthanized
98
immediately after capture. Fish lengths (cm) and weights (g) were recorded. Livers were removed,
99
divided for subcellular and bulk tissue analyses, and immediately frozen and maintained at -25 °C in the
M
AN
US
CR
IP
T
AC
CE
PT
ED
field (2 weeks). After returning from the field, frozen samples were kept at -80 °C (at INRS-ETE) until
101
processing.
102
2.2. Subcellular partitioning procedure
103
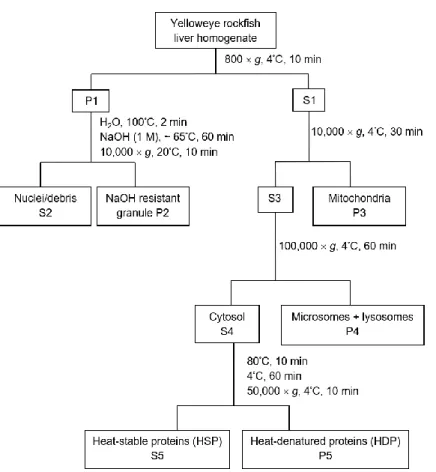
Yelloweye rockfish liver samples were separated into subcellular fractions (Figure S1, Supplementary
104
Information): nuclei and debris; granule-like; mitochondria; microsomes and lysosomes; heat-denatured
105
proteins (HDP), which include cytosolic enzymes; and heat-stable proteins and peptides (HSP), such as
106
metallothionein (MT) and glutathione (GSH). The subcellular partitioning procedure was adapted from
107
previous protocols described by Wallace et al. (2003) and Giguère et al. (2006). The effectiveness of the
108
procedure at isolating subcellular fractions has been assessed previously by using enzymes as molecular
109
markers for specific fractions or organelles (Rosabal et al., 2015). We stress that these fractions are
110
operationally-defined in nature. Furthermore, the designation “microsomes” refers to structures which
111
form a pellet at a given centrifugation speed, rather than structures found within cells. The details of the
112
partitioning procedure were based on previously published methods (Rosabal et al. 2012; Rosabal et al.
113
2014) and can be found in the Supplementary Information.
114
2.3. Trace element measurements and quality control
115
The preparation of tissue homogenates and subcellular fractions is provided in the Supplementary
116
Information. Total Cd, Pb, As, and Se concentrations in all subcellular fractions were measured using an
117
inductively coupled plasma-mass spectrometer (ICP-MS; Thermo Elemental X Series, Winsford,
118
England, United Kingdom). Samples of similar weight of a certified reference material (TORT-2, lobster
119
hepatopancreas, National Research Council of Canada, NRCC, Halifax, Nova Scotia, Canada) were
120
subjected to the same digestion procedure and analyzed concurrently with YR fractions. The recovery of
121
elements from TORT-2 (n = 2) was 91 ± 0.11% for Cd, 79 ± 4.6% for Pb, 106 ± 0.1% for As, and 90 ±
122
5.6% for Se. The relative percent difference (RPD) between duplicate samples for Cd, Pb, As, and Se
123
were 0.1%, 8.3%, 0.07%, and 8.8%, respectively.
M
AN
US
CR
IP
T
AC
CE
PT
ED
Total Hg measurements were carried out using a direct mercury analyzer (DMA-80, Milestone Inc.,
125
Monroe, CT), which uses thermal decomposition, amalgamation, and atomic absorption
126
spectrophotometry according to the U.S. Environmental Protection Agency (US EPA) Method 7473 (US
127
EPA, 2007). Quality assurance consisted of analysis of certified reference materials MESS-3 (marine
128
sediments; n=7) and DOLT-4 (dogfish liver; n=6), National Research Council of Canada, NRCC, Halifax,
129
Nova Scotia, Canada). Mean percent recovery of total Hg from MESS-3 was 97 ± 1.4 % and the relative
130
standard deviation (RSD) was 1.5 %. Mean percent recovery of total Hg from DOLT-4 was 98 ± 3.8 %
131
and the RSD was 3.9 %. Mass balances for Cd, Pb, As, Hg, and Se are reported in the Supplementary
132
Information.
133
2.4. Total mercury measurements in bulk muscle tissue
134
Freeze-dried samples of bulk muscle tissues were analyzed for total Hg using a direct Hg analyzer
(DMA-135
80, Milestone Inc., Monroe, CT). Quality assurance consisted of the analysis of certified reference
136
materials (DORM-4: fish protein, National Research Council Canada, Ottawa, Canada) and duplicate
137
samples. The recovery of total Hg from DORM-4 was 96 % (n=2) and the RPD between duplicate
138
samples was 0.80 % (n=2). In order to compare Hg concentrations to published values, wet weight
139
concentrations in YR muscle samples were estimated by assuming a moisture content of 80%, which is
140
consistent with a previous study with YR (Barst et al. 2015).
141
2.5. Data analyses
142
The contribution of each subcellular fraction relative to the total element burden was estimated as a ratio
143
defined by the element burden in a given fraction divided by the sum of element burdens in all fractions,
144
multiplied by 100 to give results as percentages (%). Element concentrations in all subcellular fractions
145
are expressed as total element burden (nmol) divided by the liver dry weight (g, dw). Liver dry weights
146
were determined by weighing subsamples of liver tissue before and after freeze-drying. All numerical
147
data are represented by means ± standard deviations (SD), unless otherwise noted. Relationships among
148
variables (trace element concentrations and relative contributions) were initially examined in bivariate
M
AN
US
CR
IP
T
AC
CE
PT
ED
scatterplots and tested by simple correlation (Pearson r) after checking the assumption of normality
150
(Shapiro–Wilk test) and testing for outliers (Grubb’s test). Percentage data (relative contribution of each
151
subcellular fraction to the total metal burden) were arcsine transformed. If normality persisted, a
non-152
parametric correlation was reported (Spearman r). When bivariate plots indicated a possible linear
153
relationship, simple regression models were tested using the ordinary least-squares equation when the
154
necessary assumptions (normality and homoscedasticity of residuals) were satisfied. The Shapiro–Wilk
155
test was used to verify the normality of distributions of the regression residuals. The Breusch-Pagan test
156
was used to test the homoscedasticity of the regression residuals. For the trace elements (Pb, Hg, and Se)
157
that showed significant increases in more than one subcellular fraction within either the sensitive or
158
detoxified compartments, the slopes of the linear regressions were compared using analysis of covariance
159
(ANCOVA) in order to compare the responses along the bioaccumulation gradient. Note that a parametric
160
assessment of covariance was preferred given that the residuals of the linear regressions were normally
161
distributed. To explore similarities (or differences) in how hepatic trace metals were partitioned between
162
both subcellular compartments (detoxified and metal-sensitive), we performed two separate PCA analyses
163
that combined data into two-component models and explained 80 - 86% of the variation. The first PCA
164
used trace element concentrations in combined sensitive fractions, and the second used trace element
165
concentrations in combined detoxified fractions. An α ˂ 0.05 was used as the threshold of significance for
166
all statistical tests. All statistical analyses were performed with JMP Pro 13 Statistical Analysis Software
167
(SAS Institute, Cary, NC, USA).
M
AN
US
CR
IP
T
AC
CE
PT
ED
3. Results 1693.1. Trace element accumulation in yelloweye rockfish liver
170
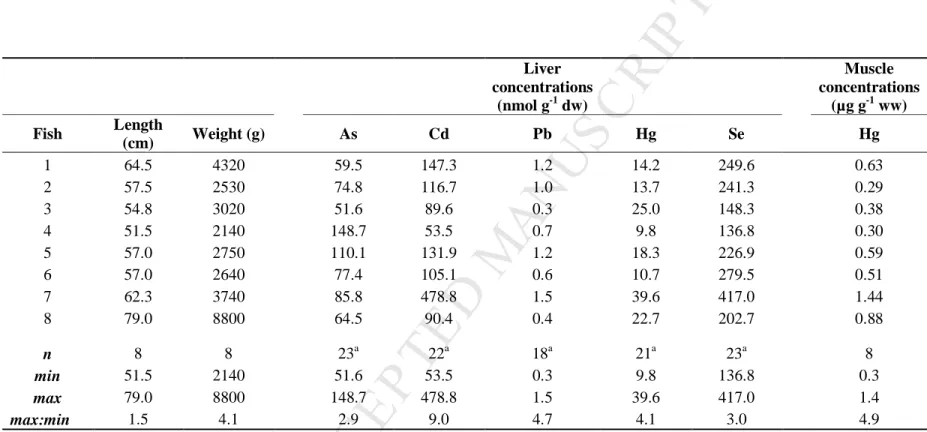
Trace element concentrations in YR livers, as well as YR lengths and weights, are reported in Table 1.
171
Liver trace element concentrations did not vary significantly with the length or weight of the fish. The
172
ratio of maximum to minimum trace element concentrations ([M]max/[M]min) in YR livers was greatest for
173
Cd (9.0), followed by Pb (4.7), Hg (4.1), Se (3.0), and As (2.9). Total Hg concentrations (µg g-1 ww) are
174
also reported for YR muscle in Table 1. Note that the simplest explanation for the variations in
175
[M]max/[M]min ratios is that the uptake : elimination ratio along the sampling gradient differs for the
176
measured trace elements (Luoma and Rainbow, 2005). Muscle total Hg concentrations ranged from 0.3 to
177
1.4 µg g-1 ww. Muscle total Hg concentrations are reported in µg g-1 ww so that concentrations are easily
178
comparable to established toxicity thresholds (Dillon et al., 2010; Sandheinrich and Wiener, 2011). Note
179
that we did not determine the ages of the rockfish in the present study, however Barst et al. (2015)
180
reported ages of YR, collected from the same sampling location and of comparable size, ranging from 16
181
to 119 years.
182
3.2. Trace element subcellular partitioning
183
We plotted trace element concentrations in whole liver against concentrations (nmol g-1 dw) in potentially
184
sensitive (mitochondria, microsomes and lysosomes, and heat-denatured protein fractions) and detoxified
185
subcellular fractions (heat-stable proteins and granule-like fractions), in order to explore potential changes
186
in partitioning with increasing element concentrations in whole liver (Figures 1 and 3). We also
187
investigated possible relationships between the percentage of each trace element found in the various
188
subcellular fractions relative to the total trace element concentrations (nmol g-1 dw) (Figures S2 and S3,
189
Supplementary Information). If the percentages of trace elements in each fraction did not change
190
significantly along the bioaccumulation gradient, then data for all fish were combined to produce mean
191
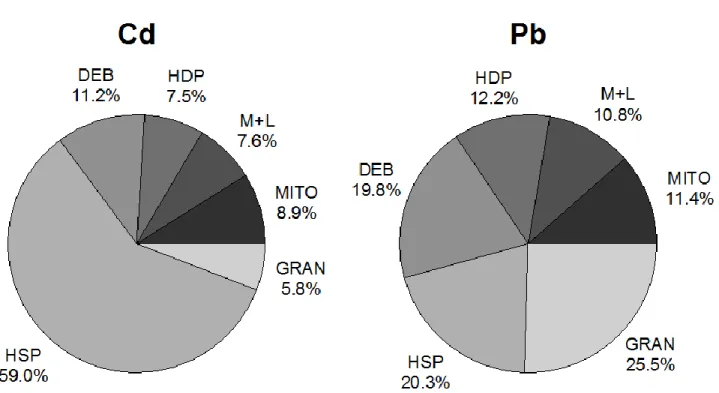
percent contributions for the various subcellular fractions per element (Figures 2 and 4). As the
192
toxicological significance of trace element accumulation in the nuclei and debris fraction is ambiguous,
M
AN
US
CR
IP
T
AC
CE
PT
ED
this fraction has been generally ignored in the ecotoxicological literature (Campbell and Hare, 2009).
194
However, as this fraction tends to accumulate unbroken cells, it may indicate the efficacy of the
195
homogenization step; a low and constant proportion of the trace-element in question found in the nuclei
196
and debris suggests an efficient and precise homogenization. In the following sections, we present the
197
results of the subcellular partitioning procedure for each of the studied trace elements.
198
3.3. Cd (cadmium)
199
There were no significant relationships between total hepatic Cd and concentrations in any of the
200
subcellular fractions in the potentially-sensitive compartment (Figure 1A). However, the concentration of
201
Cd in the HSP fraction increased significantly as the total hepatic Cd concentration increased (r2 = 0.71;
202
slope = 0.75; P = 0.02; Figure 1B). There were no significant relationships between the relative
203
contributions of the fractions and total hepatic Cd (Figures S2A and S2B, Supplementary Information).
204
When data from all fish were combined, the majority of Cd was associated with the detoxified
205
compartment (65%), with the sensitive compartment contributing only 25%. The HSP fraction
206
contributed the majority of the Cd in the detoxified compartment (59%), with only a minor contribution
207
attributed to the granule-like fraction (6%). In the potentially-sensitive compartment, Cd was more or less
208
equally distributed among the mitochondria (9%), the microsomes and lysosomes (8%), and the HDP
209
(8%) fractions (Figure 2).
210
3.4. Pb (lead)
211
Note that total Pb concentrations (< 1 nmol g-1 dry wt) in the livers of YR were much lower than molar
212
concentrations of Cd, As, Hg, and Se. Nevertheless, the Pb concentrations increased in both the
213
mitochondria (r2 = 0.75; slope = 0.11 ± 0.03; P = 0.006) and HDP (r2 = 0.74; slope = 0.091 ± 0.02; P =
214
0.006) fractions with increasing Pb concentration in whole liver to a similar extent, as evidenced by the
215
similar slopes of the two regressions (P = 0.82) (Figure 1C). The concentration of Pb increased
216
significantly in both the HSP (r2 = 0.85; slope = 0.24 ± 0.04; P = 0.001) and granule-like (r2 = 0.87; slope
217
= 0.31 ± 0.06; P = 0.0007) fractions along the bioaccumulation gradient (Figure 1D). The rates of
M
AN
US
CR
IP
T
AC
CE
PT
ED
increase in Pb concentration within the two detoxified fractions were not significantly different from one
219
another (P = 0.98). When comparing sensitive and detoxified fractions, the slope of the line representing
220
the HDP fraction was significantly lower than the slopes for both the HSP (P = 0.04) and granule-like
221
fractions (P = 0.04) (Figure 1C and 1D). The total hepatic Pb concentration was not significantly
222
correlated with the relative contribution of Pb in any of the subcellular fractions (Figures S2C and S2D,
223
Supplementary Information). When combining data from all fish, the mean relative contribution of the
224
detoxified compartment was 46%, of which the majority was contributed by the granule-like fraction
225
(26%). The sensitive compartment contributed only 35% of the total Pb. In the
potentially-226
sensitive compartment, Pb was distributed similarly among the HDP (12%), mitochondria (11%), and the
227
microsomes and lysosomes (11%) fractions (Figure 2).
228
3.5. As (arsenic)
229
Though the concentration of As increased in the mitochondria fraction along the bioaccumulation
230
gradient (r2 = 0.57; P = 0.03), the rate of increase began to plateau at higher total hepatic As
231
concentrations (Figure 1E). Conversely, there were no significant relationships between total hepatic As
232
and concentrations in either the HDP or microsomes and lysosomes fractions. The concentration of As in
233
the HSP fraction increased significantly with increasing As in whole liver (r2 = 0.84; slope = 0.86; P =
234
0.01) (Figure 1F). The relative contributions of As increased significantly in the HSP (r2 = 0.60; P = 0.02),
235
while decreasing in the microsomes and lysosomes (r2 = 0.51; P = 0.046) along the bioaccumulation
236
gradient (Figures S2E and S2F, Supplementary Information). Among all fish, the relative contributions of
237
the HSP and granule-like fractions to the total hepatic As burden varied from 50% to 75% and 2% to 9%,
238
respectively. The relative contributions of the mitochondria, microsomes and lysosomes, and HDP
239
fractions varied from 7% to 14%, 4% and 10%, and 5% and 10%, respectively.
240
3.6. Hg (mercury)
241
As the concentration of total Hg increased in whole liver, the concentrations of total Hg increased in the
242
mitochondria (r2 = 0.86; slope = 0.25; P = 0.001), microsomes and lysosomes (r2 = 0.91; slope = 0.17; P =
M
AN
US
CR
IP
T
AC
CE
PT
ED
0.0002), HSP (r2 = 0.58; slope = 0.04; P = 0.03), and granule-like fractions (r2 = 0.64; slope = 0.07; P =
244
0.03) (Figures 3A and 3B). Within the sensitive compartment, the increase in total Hg in the
245
mitochondria fraction was greater than in the microsomes and lysosomes fraction (P = 0.03). Conversely,
246
within the detoxified compartment, total Hg increased in the HSP and granule-like fractions to a similar
247
extent along the bioaccumulation gradient (P = 0.45). Total Hg increased in both the mitochondria and
248
microsomes and lysosomes fractions to a greater extent than in the HSP or granule-like fractions
249
(P<0.05). The relative contributions of the various subcellular fractions to total hepatic Hg did not vary
250
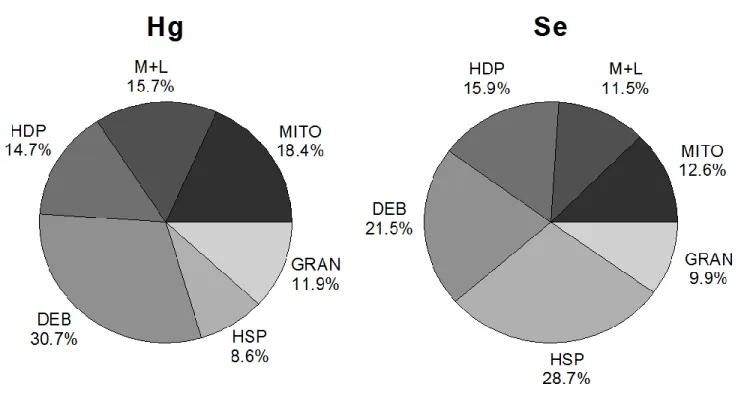
significantly along the bioaccumulation gradient (Figures S3A and S3B, Supplementary Information). For
251
all fish, the mean proportion of total Hg in the detoxified compartment was 21%, with about half being
252
contributed by the granule-like fraction (12%). Discounting the nuclei and debris fraction, the majority of
253
the total hepatic Hg burden was associated with the potentially-sensitive compartment (49%). Within this
254
compartment, the contributions of the individual fractions decreased in the order mitochondria (18%) ≥
255
microsomes and lysosomes (16%) ≥ HDP (15%) (Figure 4).
256
3.7. Se (selenium)
257
Concentrations of Se increased significantly in all of the subcellular fractions, except for the granule-like
258
fraction, as Se increased in whole liver. Within the potentially-sensitive compartment, the relation with
259
total hepatic Se was tightest for HDP (r2 = 0.95; slope = 0.16 ± 0.02; P = 0.0002) followed by
260
mitochondria (r2 = 0.90; slope = 0.16 ± 0.02; P = 0.0003), and microsomes and lysosomes (r2 = 0.67;
261
slope = 0.08 ± 0.02; P = 0.01) fractions, though there were no significant differences among the slopes of
262
the regressions (Figure 3C). Within the detoxified compartment, Se increased significantly only in HSP
263
(r2 = 0.76; slope = 0.27; P = 0.0051) (Figure 3D). The increase in Se concentration in HSP was
264
significantly greater than in the mitochondria (P = 0.04) or microsomes and lysosomes (P = 0.002)
265
fractions. The relative contributions of the various subcellular fractions to the total hepatic Se
266
concentration did not vary significantly as a function of the total hepatic Se concentration (Figures S3C
267
and S3D, Supplementary Information). When data for all fish were combined, Se was associated with
M
AN
US
CR
IP
T
AC
CE
PT
ED
potentially-sensitive and detoxified compartments similarly (40% and 39%, respectively). A larger
269
percentage of Se was found in the HSP fraction (29%), than the granule-like fraction (10%). In the
270
potentially-sensitive compartment, the relative contributions of Se were similar, decreasing in the order
271
of the HDP fraction (16%) followed by mitochondria (13%), and microsomes and lysosomes (12%)
272 (Figure 4). 273 4. Discussion 274 4.1. General considerations 275
The limited sample size in the present study was dictated by difficulties in sampling the Alaskan YR and
276
the conservative catch limits enforced by the State of Alaska. Despite the small sample size, our results
277
increase knowledge related to the internal handling of trace elements in wild fish. Our study is unique in
278
that YR have an unusually long life span compared to other fish for which the subcellular partitioning of
279
trace elements has been reported. Note too that most other studies in this area have been limited to
280
‘traditional’ metals such as Cd, Hg and Pb, whereas in the present study we have also included two
281
metalloids, As and Se.
282
Numerous studies have applied subcellular partitioning procedures to determine the distribution of
283
non-essential elements in the tissues of aquatic organisms (Giguère et al., 2006; Rosabal et al., 2015;
284
Wang et al., 2016). These procedures provide insight into how aquatic organisms cope with non-essential
285
metals and indicate whether toxicological effects are likely to occur. However, partitioning procedures are
286
subject to potential problems which have been described in depth elsewhere (Campbell and Hare, 2009;
287
Hinton et al., 1997). Subcellular fractions are operationally-defined, and accordingly the interpretation of
288
partitioning results should be carried out with circumspection.
289
In this context, the terms “MT-like” or “granule-like” should be considered carefully. A previous
290
study on Chaoborus larvae showed that not all metals measured in the HSP fraction are necessarily
291
associated with MT or MTLP (Rosabal et al., 2016; Caron et al. 2018). This caveat is likely particularly
292
important for As and Se, which tend to form covalent bonds with oxygen or reduced sulphur and may
M
AN
US
CR
IP
T
AC
CE
PT
ED
exist as oxyanions or esters in the intracellular environment, rather than as chelated cations. Furthermore,
294
the definitions of the “metal detoxified pool” and the “metal-sensitive pool” were designed for (soft)
295
cationic metals, not for As (a metalloid that is reduced to and is largely present as As(III) in living cells)
296
or Se. Moreover, the lumping of fractions into potentially-sensitive (mitochondria, HDP, microsomes and
297
lysosomes fractions) and detoxified-metal compartments (HSP and granule-like), is likely an
298
oversimplification (Campbell and Hare, 2009; Wallace et al., 2003). For example, microsomes cannot be
299
separated effectively from lysosomes using the procedure in the present study, and this renders the
300
interpretation of results more difficult. If a non-essential metal is primarily associated with lysosomes,
301
then the metal has likely been detoxified. Conversely, the endoplasmic reticulum is a potential target for
302
metal toxicity, and therefore, metals associated with these vesicles may cause deleterious effects. Previous
303
studies have often grouped the microsome and lysosome fraction in the metal-sensitive compartment due
304
to the important functions carried out by the endoplasmic reticulum, Golgi apparatus, and ribosomes in
305
the liver. However, strict inclusion of this fraction in the sensitive compartment may not be appropriate
306
for all metals. For instance, a recent study demonstrated, with electron energy loss spectrometry (EELS),
307
that Hg accumulates in the hepatic lysosomes of wild yellow perch (Perca flavescens) (Müller et al.,
308
2015). With this in mind, Hg (and potentially other trace elements) within the microsomes and lysosomes
309
fraction may be associated with lysosomes to a greater extent than microsomes. As previously mentioned,
310
the accumulation of non-essential metals in the nuclei and debris fraction is also difficult to interpret.
311
4.2. Cd (cadmium)
312
The high proportion of Cd associated with the HSP fraction suggests that Cd is largely detoxified by MT
313
in YR livers, particularly for concentrations up to ~150 nmol g-1 dw. The lack of increasing trends
314
between total hepatic Cd and the Cd concentration in sensitive fractions suggests this nonessential metal
315
is largely kept under control in the livers of YR. Furthermore, the much lower Cd concentrations in
316
sensitive fractions relative to that in HSP suggest effective detoxification. An interaction between HSP
317
and Cd is consistent with the classification of Cd as a class B metal, which exhibits preferences for
M
AN
US
CR
IP
T
AC
CE
PT
ED
reduced sulphur within cells (Mason and Jenkins, 1995). Elevated proportions of Cd were also found in
319
the HSP fractions isolated from livers of wild American and European eels (Rosabal et al., 2015), as well
320
as wild yellow perch (Giguère et al., 2006). Laboratory studies also indicate the importance of the HSP
321
fraction in detoxifying Cd in fish. For example, Olsson and Hogstrand (1987) showed that Cd was
322
associated with MT in rainbow trout livers following a 1-week aqueous exposure to 109Cd (3-60 ng/L). Ng
323
and Wood (2008) noted elevated proportions of Cd in fractions containing MT-like proteins isolated from
324
the gut tissue of rainbow trout fed contaminated oligochaetes. Similarly, Zhang and Wang (2006) reported
325
that the HSP fraction was the major storage compartment for Cd in the viscera of juvenile marine grunt
326
fed brine shrimp previously exposed to aqueous 109Cd. Together, these studies indicate that maintaining
327
Cd in the HSP fraction is an important metal-handling strategy for fish species.
328
Though YR in the present study maintained the majority of Cd in the detoxified compartment,
329
detoxification was not complete given the presence of some Cd at sensitive sites. In the sensitive
330
compartment, isolated from whole zebrafish (Danio rerio) fed contaminated chironomids (153 – 288 µg
331
g-1 dw), Cd was found mainly in the “organelles” fraction (including mitochondria and microsomes and
332
lysosomes) followed by the HDP fraction (Béchard et al., 2008), which was similar to results for YR in
333
the present study. Interestingly, the concentration of Cd did not increase significantly in sensitive
334
fractions of YR livers along the bioaccumulation gradient, contrary to what was shown for wild yellow
335
perch (Giguère et al., 2006) and wild American and European yellow eels (Rosabal et al., 2015). This
336
may be due to the more modest Cd gradient in the present study ([Cd]max: [Cd]min = 9.0) relative to the
337
gradients reported by (Giguère et al., 2006) ([Cd]max: [Cd]min = 14) and Rosabal et al. (2015) (American
338
eels [Cd]max: [Cd]min = 103 and European eels [Cd]max: [Cd]min = 200). Moreover, the lack of significant
339
relationships between Cd in sensitive fractions and Cd in whole liver may be a result of the variability in
340
Cd concentrations. For example, two YR in the present study had total hepatic Cd concentrations of ~90
341
nmol g-1 dw, yet the Cd concentrations within the sensitive fractions of these individuals were quite
342
different. This may indicate that individual YR can have less-(or more-)effective metal detoxification
M
AN
US
CR
IP
T
AC
CE
PT
ED
systems than other fish in their population, a phenomenon that has been demonstrated previously for
344
yellow perch sampled from metal-impacted lakes (Couture and Pyle, 2008).
345
Nevertheless, Cd was associated with sensitive subcellular sites within YR livers, and this could lead
346
to negative health effects. Accumulation of Cd in mitochondria may affect functioning of this organelle,
347
including an inhibition of citrate synthase, which has been documented for yellow perch livers collected
348
from a highly contaminated lake in Canada (Couture and Rajotte, 2003). In a separate study with yellow
349
perch, Ponton et al. (2016) noted that individuals suffering from oxidative stress had higher percentages
350
of Cd, Cu, and Zn in potentially sensitive subcellular fractions, which may highlight the importance of
351
maintaining these metals in detoxified fractions.
352
4.3. Pb (lead)
353
Within the detoxified compartment, Pb associated with the granule-like fraction to a slightly greater
354
extent than with the HSP fraction. The preference for the granule-like fraction over the HSP fraction
355
containing MT may be due to the fact that Pb, as a borderline metal, associates less readily with thiol
356
groups than other “softer” metals, such as Cd and Ag (Mason and Jenkins, 1995). Nonetheless, the
357
concentration of Pb increased in both the metal-rich granule and HSP fractions along the bioaccumulation
358
gradient. Given the low Pb concentrations, the association of Pb with the HSP fraction may be an indirect
359
response to Cd, which has consistently been shown to induce synthesis of MT. Following the induction of
360
MT by Cd, MT is available to bind both Cd and other metals such as Pb. Alternatively, the association of
361
Pb with the HSP fraction could be an indication of a detoxification response, although this seems unlikely
362
given the very low concentrations of hepatic Pb. Much of the previous research involving the subcellular
363
distribution of Pb has focused on invertebrates, with only a few studies reporting Pb partitioning in the
364
tissues of fish. The distribution of Pb within the detoxified compartment of YR livers agrees well with the
365
results of studies on invertebrates (Marigómez et al., 2002; Mason and Jenkins, 1995; Sánchez-Marín and
366
Beiras, 2017; Wang et al., 2016) and other fish (Goto and Wallace, 2010; Rosabal et al., 2015), which
367
show collectively that metal-rich granules are the primary binding pool within the detoxified
M
AN
US
CR
IP
T
AC
CE
PT
ED
compartment. Contrary to these results, Dang et al. (2012) reported that the majority of Pb was found in
369
the HSP fraction of intestinal cells of the marine grunt (Terapon jarbua).
370
Though Pb increased in detoxified fractions of YR liver, detoxification was incomplete given that
371
Pb was also present in metal-sensitive fractions and increased along the bioaccumulation gradient. In
372
terms of percentage, Pb was distributed similarly among the metal-sensitive fractions, only showing a
373
slight preference for HDP. Consistent with our results, Rosabal et al. (2015) also reported increases of Pb
374
in metal-sensitive fractions of yellow eels with increasing concentrations in whole liver. However, Pb did
375
not increase in the metal-sensitive fractions of mummichogs (Fundulus heteroclitus) collected from
376
metal-polluted salt marshes, though the two-fold bioaccumulation gradient of Pb was somewhat limited
377
(Goto and Wallace, 2010). In YR, the association of Pb with metal-sensitive fractions may result in
378
deleterious effects, in view of the ability Pb to replace other essential metals, such as Ca, within biological
379
systems (Rogers et al., 2003). Furthermore, associations between Pb and mitochondria, enzymes, and
380
microsomes would be expected to disrupt cellular processes. However, given the very low total hepatic
381
Pb concentrations in the livers of YR in the present study, it is unlikely that this metal was of great
382
toxicological concern to these fish.
383
4.4. As (arsenic)
384
Within the detoxified compartment of YR livers, As was primarily associated with the HSP fraction,
385
containing MT. A steady increase of As in HSP suggests that this fraction may be involved in As
386
detoxification within YR livers. To our knowledge, there are no previous studies on subcellular
387
partitioning of As in the livers of rockfish species, though our results compare well with As partitioning
388
in American and European yellow eels (Anguilla rostrata and Anguilla anguilla); like YR, both eel
389
species maintained As in the HSP fraction, and to a lesser extent, in the metal-rich granule fraction
390
(Rosabal et al., 2015). Similarly, in seabass (Lateolabrax japonicas) and seabream (Pagrosomus major)
391
muscle, As was largely associated with the HSP fraction (He et al., 2010). These results are also
392
consistent with a study on marine grunt (Terapon jarbua) exposed to dietary or aqueous As(III) and
393
As(V) at environmentally-relevant concentrations for 10 d. In grunt muscle tissues, As accumulated
M
AN
US
CR
IP
T
AC
CE
PT
ED
mainly in the HSP fraction, whereas less was associated with metal-rich granules (Zhang et al., 2012).
395
Although As was associated with the HSP fraction there may not be a significant interaction between As
396
and MT given the lower affinity this metalloid has for thiol functional groups.
397
In the metal-sensitive compartment, As was predominately associated with the mitochondria
398
fraction, which is consistent with results from a previous study on American and European yellow eels
399
(Rosabal et al., 2015). Our results differ slightly from the study by Rosabal et al. (2015) in that in eel
400
livers, the microsomes and lysosomes fraction was a more important binding pool for As than the HDP
401
fraction. In the present study, the microsomes and lysosomes and HDP fractions contributed roughly the
402
same amount of As to the total As burden in YR livers. A study by Dang et al. (2012) noted binding of As
403
in the “organelles” fraction (mitochondria and microsomes and lysosomes) of a polychaete worm (Nereis
404
diversicolor) sampled from a contaminated estuary. In the same study, the contaminated worms were fed
405
to fish (Terapon jarbua), which subsequently accumulated As in the hepatic “organelle” fraction. The
406
combined results from these studies suggest that across species, organelles may be an important target for
407
As at the subcellular level.
408
Along the As contamination gradient, we noted an increase in the relative contribution of As in
409
the HSP fraction within YR livers, coupled with a decrease in the relative contribution of the microsomes
410
and lysosomes fraction, suggesting an activation of detoxification mechanisms. Interestingly, the relative
411
contributions of As in the mitochondria and HDP fractions increased with increasing As in whole liver
412
until approximately 80 nmol g-1 dw, at which point the relative contribution of As in the fractions
413
decreased along the bioaccumulation gradient (this was also the case for the microsomes and lysosomes
414
fraction, though the increase and subsequent decrease in relative contribution of As was less pronounced,
415
thus allowing for a significant linear trend to be fitted) (Figures S2E and S2F, Supplementary
416
Information). The distributions of the relative contributions of As along the gradient suggest that
417
detoxification of As became more effective above ~80 nmol g-1 dw in the livers of YR. This is similar to
418
what Rosabal et al. (2012) noted for Cd in Chaoborus, i.e. a certain threshold of Cd was necessary to
419
“turn on” detoxification mechanisms fully.
M
AN
US
CR
IP
T
AC
CE
PT
ED
In the present study we did not determine As speciation in the livers of YR, though speciation of As
421
is a major determinant of its toxicity (Watanabe and Hirano, 2013). Future work should focus on
422
determining the oxidation state and methylation levels of As in wild fish at the subcellular level.
423
Additionally, we highlight the need for subsequent work to identify the As-bearing molecules in the
424
cytosol, specifically in the HSP fraction, which appears to be involved in As detoxification.
425
4.5. Hg (mercury)
426
Relatively few studies have focused on the subcellular distribution of Hg in fish liver (Araújo et al., 2015;
427
Barst et al., 2016; Peng et al., 2016). Araújo et al. (2015) measured total Hg in subcellular fractions of the
428
livers of wild mullets (Liza aurata), and found low contributions of Hg in the HSP and granule fractions,
429
which the authors attributed to Hg concentrations below a physiological threshold to activate
430
detoxification mechanisms. In Arctic char (Salvelinus alpinus) liver cells, Barst et al. (2016) reported that
431
the HSP fraction was the primary binding pool for total Hg within the detoxified compartment, and less
432
than 1% of the total Hg burden was found in the metal-rich granule fraction. Similarly, metal-rich
433
granules played a less important role in the detoxification of methylmercury (MeHg) than MT-like
434
proteins in the livers of rabbitfish (Siganus canaliculatus) (Peng et al., 2016). Results of the present study
435
contrast with those from these earlier studies suggesting that the HSP fraction is more important than
436
metal-rich granules in the detoxification of Hg in fish liver cells. A plausible explanation for the greater
437
importance of the metal-rich granule fraction than the HSP fraction in sequestering Hg in the livers of YR
438
may be linked to Hg speciation. In a previous study on YR, inorganic mercury (InHg) comprised a major
439
proportion of the total Hg (mean = 58 ± 14.2%) in liver tissue (Barst et al. 2015). In addition to elevated
440
proportions of InHg in the livers of YR, Barst et al. (2015) demonstrated a co-localization of Hg and Se
441
within hepatic MA. The authors hypothesized that InHg was bound to Se, forming HgSe granules that are
442
thought to be the end-product of MeHg detoxification (Wang et al. 2012). The accumulation of total Hg
443
in the metal-rich granule fractions of YR may therefore represent a long-term accumulation of HgSe
444
granules in YR livers. In the same manner, the low accumulation of total Hg in the metal-rich granule
M
AN
US
CR
IP
T
AC
CE
PT
ED
fraction of Arctic char (Barst et al. 2016) and rabbitfish (Peng et al. 2016) may be a result of the low
446
proportions of InHg in their tissues.
447
Despite the accumulation of total Hg in HSP and metal-rich granules, detoxification in the livers
448
of YR was incomplete, as evidenced by the total Hg present in metal-sensitive fractions, and the increase
449
in total Hg concentration in these fractions along the bioaccumulation gradient. The total Hg found in the
450
sensitive fractions of YR liver could negatively impact the health of these fish. For example, Cambier et
451
al. (2009) noted an inhibition of both state 3 mitochondrial respiration and cytochrome c oxidase activity
452
in the muscle fibers of zebrafish exposed to an environmentally-relevant dose of dietary MeHg for 49
453
days. As the mitochondria fraction contributed the greatest percentage of total Hg among sensitive and
454
detoxified fractions, YR could be suffering from inhibited respiration and thus, altered energy
455
metabolism. The accumulation of total Hg in the HDP fraction could have consequences for the redox
456
defense system; Se-dependent enzymes, such as glutathione peroxidase (GSH-Px) and thioredoxin
457
reductase (TrxR), are likely molecular targets for intracellular Hg due to the high binding affinity Hg has
458
for Se. In support of this, a laboratory feeding study documented decreased activity of GSH-Px in the
459
brains of juvenile Atlantic salmon (Salmo salar) exposed to MeHg (Berntssen et al., 2003). Decreased
460
activities of GSH-Px and TrxR have also been documented in the tissues of zebra-seabream (Diplodus
461
cervinus) following aqueous exposure to either MeHg or InHg (Branco et al., 2012). As previously stated,
462
the presence of total Hg in the microsomes and lysosomes fraction is more difficult to interpret, and our
463
inability to classify this fraction in either the detoxified or sensitive compartment provides an opportunity
464
for future studies.
465
4.6. Se (selenium)
466
In contrast to the other elements measured in YR livers, Se is essential to normal cellular function.
467
Despite this essential nature, above a threshold concentration Se may become toxic. Given that the range
468
of concentrations in YR livers in the present study is within the range of those reported to afford
469
protection from oxidative stress in the livers of yellow perch (Ponton et al. 2016), we discuss Se in YR in
M
AN
US
CR
IP
T
AC
CE
PT
ED
the context of its potential ameliorative effects. Selenium is known to have an interaction with
non-471
essential metals such as Cd, As, and Hg (Sasakura and Suzuki, 1998), and this may confer a protective
472
action against toxicity (Banni et al., 2011; Wang et al., 2013). We chose to include Se in the present study
473
because it is known to have a strong binding affinity for Hg and it is well understood that Hg handling in
474
the subcellular environment involves interactions with selenols (Wang et al. 2012). Additionally, previous
475
work has demonstrated colocalization of Hg and Se in immune cells, suggesting an interaction between
476
the two elements within YR livers (Barst et al. 2015). The protective effects of Se on Hg toxicity have
477
been the subject of a significant amount of research, some of which hypothesizes that Se is protective if
478
molar ratios (Se:Hg) meet or exceed unity (Ralston et al. 2007). However this protective effect has been
479
largely studied from a human health perspective and has not been well explored in terms of the health of
480
wild fish nor focused on the liver with its major role in detoxification. Within the detoxified compartment,
481
Se was found primarily in the HSP fraction, and to a lesser extent in the granule-like fraction. Within the
482
HSP fraction, Se is most likely present as seleno-cysteine (Gladyshev, 2012) in thermostable
metal-483
binding proteins, such as MT. As previously mentioned, Se within the granule-like fraction may be
484
present as HgSe. In contrast to Arctic char livers, where less than 2% of the total Se burden was
485
associated with the metal-rich granule fraction, the granule-like fraction isolated from YR livers
486
comprised an average of 10% of the total Se burden. Interestingly, the percentages of Se in the metal-rich
487
granules isolated from both species of fish were similar to the proportions of total Hg in the respective
488
fractions. This is likely another indication of the interaction between the two elements. The proportion of
489
Se within the sensitive compartment roughly equaled that in the detoxified compartment. In
metal-490
sensitive fractions, Se demonstrated a slight preference for the HDP fraction, which is not surprising
491
given selenium’s biochemical role in enzymes, such as GSH-Px and TrxR.
492
4.7. Overall subcellular element partitioning
493
We noted clear differences in the partitioning of the trace elements As, Cd, Pb, Hg, and Se in the livers of
494
YR. As Class B metals, Hg and Cd have high affinities for thiols in biological systems, and therefore
M
AN
US
CR
IP
T
AC
CE
PT
ED
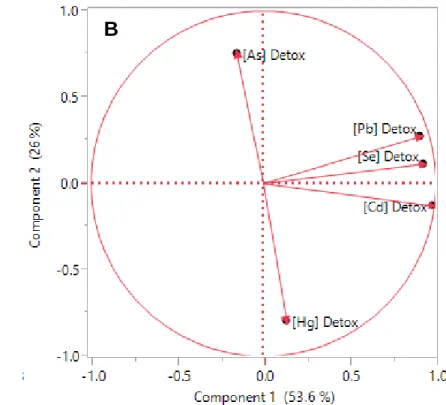
these non-essential metals would be expected to display similar subcellular partitioning. Both elements
496
appear in the same quadrant in both PCA loading plots (bottom right) for the metal-sensitive and the
497
detoxified metal compartments (Figure 5A-B), which presumably reflects the common affinity that these
498
metals have for SH- functional groups. Conversely, both As and Pb are borderline elements, and their
499
proximity within the PCA plots is likely a result of the lower affinities that these metals share for thiols
500
relative to “soft” metals such as Cd and Hg (Figures 5A and 5B). Interestingly, for the detoxified-metal
501
compartment, As and Hg vectors are directed in opposite directions (both vectors are projected at 180o) in
502
the PCA figure, indicating a potential negative relationship between the partitioning of As and Hg in this
503
compartment. A similar trend between As and Hg is also observed in the metal-sensitive compartment,
504
where the metal vectors are projected perpendicularly. We speculate that both elements could be targeting
505
similar biomolecules. Additionally, the location of the Se vector between the As and Hg vectors may
506
indicate potential interactions between Se and these two elements.
507
Yelloweye rockfish were able to maintain some of these non-essential metals in detoxified
508
fractions, suggesting an ability to cope with these metals to some extent. Both Cd and As were mainly
509
found in the HSP fraction within the detoxified compartment, indicating a potential interaction with MT.
510
In contrast, both Pb and Hg showed a greater preference for the granule-like fraction than the HSP
511
fraction. For Pb, this trend is consistent with results from subcellular partitioning in eels (Rosabal et al.
512
2015), but for Hg this apparent role of the granule-like fraction within the livers of YR is not consistent
513
with results of a previous study with Arctic char, in which the HSP played a much more important role in
514
detoxification. We hypothesize that the observed divergence may be related to differences in Hg
515
speciation and/or age between the two species of fish. Future studies should focus on exploring the
516
subcellular partitioning of InHg and MeHg to determine possible differences.
517
Although, non-essential metals were associated with detoxified fractions within the livers of YR,
518
detoxification was incomplete as each of the non-essential metals was also associated with
potentially-519
sensitive sites. However, only Pb and Hg increased significantly within potentially-sensitive fractions
520
along the bioaccumulation gradient, suggesting that within the tissue concentration ranges reported here
M
AN
US
CR
IP
T
AC
CE
PT
ED
YR are less efficient at detoxifying these metals than Cd and As. Within the potentially-sensitive
522
compartment, the fraction containing mitochondria was consistently important for binding of Cd, Pb, As,
523
and Hg. The accumulation of these non-essential metals in this fraction may lead to negative effects,
524
given the key role that these organelles play in cellular metabolism. Subcellular partitioning procedures,
525
such as the one employed in the present work, provide useful information on how trace elements are
526
distributed within cells, thus moving beyond more simple measures in bulk tissues. This type of
527
information can be useful when trying to understand risk associated with multiple non-essential elements.
528
Collectively, our results suggest that Hg may be of greatest concern to the health of YR relative to the
529
other non-essential metals studied; the majority of Hg was associated with the sensitive compartment,
530
whereas the other non-essential metals were predominately associated with the detoxified compartment.
531
Recent analyses of the available data for Hg toxicity in fish indicate that toxic effects are likely to occur at
532
concentrations exceeding 0.3 µg g-1 ww (Dillon et al. 2010; Sandheinrich and Wiener, 2011) (equivalent
533
concentration in edible muscle 0.5 µg g-1 ww). In the present study, 5 of the 8 YR exceed this toxicity
534
threshold (Table 1), suggesting that they are indeed at risk for the toxic effects of Hg. Our work
535
demonstrates that non-essential metals accumulate in potentially-sensitive sites (mitochondria,
536
microsomes, and enzymes), which may have implications for the health of YR.
537
Acknowledgements 538
We thank A. Caron, J. Perreault and R. Rodrigue for laboratory assistance. We also thank members of the
539
Griggers family at TreeTops Lodge for lodging and assistance in the field. P.G.C. Campbell and N. Basu
540
are supported by the Canada Research Chairs programme. This project was supported by the NSERC
541
Discovery Grant programme (Drevnick).
542
Supplementary Information 543
Consists of methods related to subcellular partitioning and trace element analyses, in addition to three
544
figures (S2, S3, and S4).
M
AN
US
CR
IP
T
AC
CE
PT
ED
Table 1. Ranges in lengths and weights, mean hepatic trace element concentrations (nmol g-1 dw), and total mercury concentrations in
muscle (µg g-1 ww) of yelloweye rockfish (Sebastes ruberrimus) collected in southeast Alaska.
546 Liver concentrations (nmol g-1 dw) Muscle concentrations (µg g-1 ww) Fish Length (cm) Weight (g) As Cd Pb Hg Se Hg 1 64.5 4320 59.5 147.3 1.2 14.2 249.6 0.63 2 57.5 2530 74.8 116.7 1.0 13.7 241.3 0.29 3 54.8 3020 51.6 89.6 0.3 25.0 148.3 0.38 4 51.5 2140 148.7 53.5 0.7 9.8 136.8 0.30 5 57.0 2750 110.1 131.9 1.2 18.3 226.9 0.59 6 57.0 2640 77.4 105.1 0.6 10.7 279.5 0.51 7 62.3 3740 85.8 478.8 1.5 39.6 417.0 1.44 8 79.0 8800 64.5 90.4 0.4 22.7 202.7 0.88 n 8 8 23a 22a 18a 21a 23a 8 min 51.5 2140 51.6 53.5 0.3 9.8 136.8 0.3 max 79.0 8800 148.7 478.8 1.5 39.6 417.0 1.4 max:min 1.5 4.1 2.9 9.0 4.7 4.1 3.0 4.9 a
n represents the total number of liver samples for which the mass balance recovery was between 61 and 150 %.
547 548 549 550
M
AN
US
CR
IP
T
AC
CE
PT
ED
5. References 551Araújo, O., Pereira, P., Cesário, R., Pacheco, M., Raimundo, J., 2015. The sub-cellular fate of
552
mercury in the liver of wild mullets (Liza aurata)–Contribution to the understanding of
metal-553
induced cellular toxicity. Mar. Pollut. Bull. 95, 412-418.
554
Banni, M., Chouchene, L., Said, K., Kerkeni, A., Messaoudi, I., 2011. Mechanisms underlying
555
the protective effect of zinc and selenium against cadmium-induced oxidative stress in zebrafish
556
Danio rerio. BioMetals 24, 981-992.
557
Barst, B.D., Bridges, K., Korbas, M., Roberts, A.P., Van Kirk, K., McNeel, K., Drevnick, P.E.,
558
2015. The role of melano‐macrophage aggregates in the storage of mercury and other metals: An
559
example from yelloweye rockfish (Sebastes ruberrimus). Environ. Toxicol. Chem. 34,
1918-560
1925.
561
Barst, B.D., Rosabal, M., Campbell, P.G., Muir, D.G., Wang, X., Köck, G., Drevnick, P.E., 2016.
562
Subcellular distribution of trace elements and liver histology of landlocked Arctic char
563
(Salvelinus alpinus) sampled along a mercury contamination gradient. Environ. Pollut. 212,
574-564
583.
565
Béchard, K., Gillis, P., Wood, C., 2008. Trophic transfer of Cd from larval chironomids
566
(Chironomus riparius) exposed via sediment or waterborne routes, to zebrafish (Danio rerio):
567
Tissue-specific and subcellular comparisons. Aquat. Toxicol. 90, 310-321.
568
Berntssen, M., Aatland, A., Handy, R., 2003. Chronic dietary mercury exposure causes oxidative
569
stress, brain lesions, and altered behaviour in Atlantic salmon (Salmo salar) parr. Aquat. Toxicol.
570
65, 55-72.
571
Branco, V., Canário, J., Lu, J., Holmgren, A., Carvalho, C., 2012. Mercury and selenium
572
interaction in vivo: effects on thioredoxin reductase and glutathione peroxidase. Free Radical
573
Biol. Med. 52, 781-793.
574
Cambier, S., Benard, G., Mesmer-Dudons, N., Gonzalez, P., Rossignol, R., Brethes, D.,
575
Bourdineaud, J.-P., 2009. At environmental doses, dietary methylmercury inhibits mitochondrial
M
AN
US
CR
IP
T
AC
CE
PT
ED
energy metabolism in skeletal muscles of the zebra fish (Danio rerio). The international journal
577
of biochemistry & cell biology 41, 791-799.
578
Campbell, P.G., Hare, L., 2009. Metal detoxification in freshwater animals. Roles of
579
metallothioneins. Metallothioneins and related chelators, 239-277.
580
Caron, A., Rosabal, M., Drevet, O., Couture, P., Campbell, P.G., 2018. Binding of trace elements
581
(Ag, Cd, Co, Cu, Ni, and Tl) to cytosolic biomolecules in livers of juvenile yellow perch (Perca
582
flavescens) collected from lakes representing metal contamination gradients. Environmental
583
Toxicology and Chemistry 37, 576-586.
584
COSEWIC, 2009. COSEWIC assessment and status report on the Yelloweye rockfish, Sebastes
585
ruberrimus: Pacific Ocean inside waters population, Pacific Ocean outside waters population in
586
Canada.
587
Couture, P., Pyle, G., 2008. Live fast and die young: metal effects on condition and physiology of
588
wild yellow perch from along two metal contamination gradients. Hum. Ecol. Risk Assess. 14,
589
73-96.
590
Couture, P., Rajotte, J.W., 2003. Morphometric and metabolic indicators of metal stress in wild
591
yellow perch (Perca flavescens) from Sudbury, Ontario: a review. J. Environ. Monit. 5, 216-221.
592
Dang, F., Rainbow, P.S., Wang, W.-X., 2012. Dietary toxicity of field-contaminated invertebrates
593
to marine fish: Effects of metal doses and subcellular metal distribution. Aquat. Toxicol. 120,
1-594
10.
595
Dillon, T., Beckvar, N., Kern, J., 2010. Residue‐based mercury dose–response in fish: An
596
analysis using lethality‐equivalent test endpoints. Environ. Toxicol. Chem. 29, 2559-2565.
597
Giguère, A., Campbell, P.G., Hare, L., Couture, P., 2006. Sub-cellular partitioning of cadmium,
598
copper, nickel and zinc in indigenous yellow perch (Perca flavescens) sampled along a
599
polymetallic gradient. Aquat. Toxicol. 77, 178-189.
600
Gladyshev, V.N., 2012. Selenoproteins and selenoproteomes, Selenium. Springer, pp. 109-123.
M
AN
US
CR
IP
T
AC
CE
PT
ED
Goto, D., Wallace, W.G., 2010. Metal intracellular partitioning as a detoxification mechanism for
602
mummichogs (Fundulus heteroclitus) living in metal-polluted salt marshes. Mar. Environ. Res.
603
69, 163-171.
604
He, M., Ke, C.-H., Wang, W.-X., 2010. Effects of cooking and subcellular distribution on the
605
bioaccessibility of trace elements in two marine fish species. J. Agric. Food Chem. 58,
3517-606
3523.
607
Hinton, R.H., Mullock, B.M., Gilhuus-Moe, C., 1997. Isolation of subcellular fractions.
608
Subcellular Fractionation: A Practical Approach, 31-69.
609
Luoma, S.N., Rainbow, P.S., 2005. Why is metal bioaccumulation so variable? Biodynamics as a
610
unifying concept. Environmental Science & Technology 39, 1921-193
611
Love, M.S., Yoklavich, M., Thorsteinson, L.K., 2002. The rockfishes of the northeast Pacific.
612
Univ of California Press.
613
Marigómez, I., Soto, M., Cajaraville, M.P., Angulo, E., Giamberini, L., 2002. Cellular and
614
subcellular distribution of metals in molluscs. Microsc. Res. Tech. 56, 358-392.
615
Mason, A., Jenkins, K., 1995. Metal detoxification in aquatic organisms. Metal speciation and
616
bioavailability in aquatic systems 3, 479-608.
617
Müller, A.-K., Brinkmann, M., Baumann, L., Stoffel, M.H., Segner, H., Kidd, K.A., Hollert, H.,
618
2015. Morphological alterations in the liver of yellow perch (Perca flavescens) from a biological
619
mercury hotspot. Environmental Science and Pollution Research, 1-13.
620
Khan, M.A.K., Wang, F., 2009. Mercury selenium compounds and their toxicological
621
significance: Toward a molecular understanding of the mercury selenium antagonism. Environ.
622
Toxicol. Chem. 28, 1567-1577.
623
Korbas, M., O’Donoghue, J.L., Watson, G.E., Pickering, I.J., Singh, S.P., Myers, G.J., Clarkson,
624
T.W., George, G.N., 2010. The chemical nature of mercury in human brain following poisoning
625
or environmental exposure. ACS chemical neuroscience 1, 810-818.