BioOne sees sustainable scholarly publishing as an inherently collaborative enterprise connecting authors, nonprofit publishers, academic institutions, research libraries, and research funders in the common goal of maximizing access to critical research.
Subarctic Thermokarst Ponds: Investigating Recent Landscape Evolution and
Sediment Dynamics in Thawed Permafrost of Northern Québec (Canada)
Author(s): Frédéric Bouchard , Pierre Francus , Reinhard Pienitz , Isabelle Laurion and Stéphane Feyte
Source: Arctic, Antarctic, and Alpine Research, 46(1):251-271. 2014.
Published By: Institute of Arctic and Alpine Research (INSTAAR), University of Colorado
DOI:
http://dx.doi.org/10.1657/1938-4246-46.1.251
URL:
http://www.bioone.org/doi/full/10.1657/1938-4246-46.1.251
BioOne (www.bioone.org) is a nonprofit, online aggregation of core research in the biological, ecological, and
environmental sciences. BioOne provides a sustainable online platform for over 170 journals and books published
by nonprofit societies, associations, museums, institutions, and presses.
Your use of this PDF, the BioOne Web site, and all posted and associated content indicates your acceptance of
BioOne’s Terms of Use, available at www.bioone.org/page/terms_of_use.
Usage of BioOne content is strictly limited to personal, educational, and non-commercial use. Commercial
inquiries or rights and permissions requests should be directed to the individual publisher as copyright holder.
Arctic, Antarctic, and Alpine Research, Vol. 46, No. 1, 2014, pp. 251–271
Subarctic Thermokarst Ponds: Investigating Recent
Landscape Evolution and Sediment Dynamics in Thawed
Permafrost of Northern Québec (Canada)
Frédéric Bouchard*†§
Pierre Francus*†
Reinhard Pienitz†‡
Isabelle Laurion*† and
Stéphane Feyte*
*Institut national de la recherche scientifique, Centre Eau Terre Environnement (INRS-ETE), 490 de la Couronne, Québec (QC), G1K 9A9, Canada
†Centre d’études nordiques (CEN), Pavillon Abitibi-Price, Université Laval, 2405 de la Terrasse, Québec (QC), G1V 0A6, Canada
‡Département de Géographie, Pavillon Abitibi-Price, Université Laval, 2405 de la Terrasse, Québec (QC), G1V 0A6, Canada
§Corresponding author (present address): Centre d’études nordiques (CEN), Pavillon Abitibi-Price, Université Laval, 2405 de la Terrasse, Québec (QC), G1V 0A6, Canada, [email protected]
DOI: http://dx.doi.org/10.1657/1938-4246-46.1.251
Introduction
Thermokarst ponds and lakes are formed by local ground subsidence caused by the thawing and erosion of ice-rich per-mafrost. These aquatic ecosystems are widespread throughout Arctic and subarctic regions of northern Scandinavia (Zuidhoff and Kolstrup, 2000; Christensen et al., 2004), Siberia (Agafonov et al., 2004; Takakai et al., 2008), Alaska (Jorgenson et al., 2006; Osterkamp, 2007), and Canada (Beilman et al., 2001; Payette et al., 2004). Their stability and life cycle—from days to thousands of years—are strongly controlled by regional climate variations, as well as local factors such as hydrology and substrate proper-ties (Pienitz et al., 2008). The surrounding landscape of thermo-karst ponds generally contains significant amounts of organic carbon—formerly trapped in permafrost and now being mobi-lized with global warming and associated erosion—that can be partly mineralized to CO2 and CH4 in aquatic systems, and then transferred to the atmosphere (Zimov et al., 2006; Schuur et al., 2009; Tarnocai et al., 2009). Thermokarst systems thus contribute actively to greenhouse gas (GHG) emissions, potentially enhanc-ing climate warmenhanc-ing through a positive feedback mechanism and affecting the global carbon balance when old carbon is released (Walter et al., 2006; Schuur et al., 2008). It was proposed that the global atmospheric increase in CH4 during the last deglacia-tion was directly related to this mechanism, although this subject is still under debate (Walter et al., 2007; van Huissteden et al., 2011; Brosius et al., 2012).
Covering about 25% of the northern hemisphere and more than 50% of Canada (Brown et al., 1998), permafrost spans nearly one-third of the northern Québec-Labrador peninsula, and a significant part (at its southern limit) is considered as warm permafrost, or near the thawing threshold (Allard and Seguin, 1987). Since the mid-20th century, increasing air/ground temperatures and snow cover along the eastern coast of Hudson Bay have contributed to the widespread reduction of permafrost areas along a latitudinal gradient, from about 25% in northern Hudson Bay (58°N; Vallée and Payette, 2007) to more than 80% in its southeastern part (56°N; Payette et al., 2004). Therefore, thermokarst ponds and lakes may occupy an increasingly important part of the landscape in subarctic Québec, although precise pond and lake surface areas are still unknown for this specific region. Smith et al. (2007) estimated that 73% of all lakes north of 45.5°N are located in permafrost-influenced zones, representing nearly 150,000 lakes with surface areas between 0.1 and 50 km2. However, this number is likely underestimated as many
northern ponds and lakes are generally <0.1 km2, thus not included
in large-scale surface classifications. This is of great importance for the global carbon balance, as small lakes and ponds (hundreds of m2)
must also be regarded as effective processors and conduits of carbon in Arctic and boreal landscapes (Kortelainen et al., 2006; Abnizova et al., 2012; Negandhi et al., 2013).
Studies examining recent changes in the distribution and surface area of thermokarst ponds and lakes in Arctic and subarctic regions have reported contrasting trends according to permafrost types: water-level decline and pond/lake shrinkage in
Abstract
Although widely distributed throughout Arctic and subarctic regions, thermokarst ponds and lakes remain relatively unexplored regarding geomorphological changes in their catch-ments and their internal properties in relation to climate change over the past decades. This study synthesizes recent landscape evolution and modern sedimentology of limnologi-cally diverse thermokarst ponds near southeastern Hudson Bay, Canada. Spatio-temporal analysis of permafrost mounds, thermokarst ponds, and vegetation surface areas over the past five decades revealed that the recent climate-induced decrease of permafrost-affected areas was not primarily compensated by thermokarst pond development, but rather by a remarkable increase in vegetation cover. These changes appeared to be modulated by topographical and hydrological gradients at the study site, which are associated with east-ward increasing thickness of postglacial marine deposits. At a more contemporary time-scale, physico-chemical measurements made on sedimenting materials (sediment traps) and freshly deposited lacustrine sediments of selected thermokarst ponds revealed striking differences both among ponds and between the oxic epilimnion and the oxygen-depleted hypolimnion. These findings underscore the major influence of local landscape properties and oxycline development on pond sedimentology and geochemistry, such as the transport of detritic particles and the concentration of redox-sensitive elements.
the discontinuous zone and pond/lake expansion or no significant change in the continuous zone (Yoshikawa and Hinzman, 2003; Smith et al., 2005; Riordan et al., 2006; Plug et al., 2008; Carroll et al., 2011). Such differences in observations can be explained if thermokarst processes are considered as a continuum: initial permafrost thawing results in thermokarst lake inception and expansion, followed by a reduction of lake surface area to complete subsurface drainage as the permafrost warms and degrades further, allowing hydrological connections between surface and underground flows through portions of unfrozen ground (taliks) (Smith et al., 2005). Lateral drainage, caused by lakeshore breaching related to high water levels, has also been reported, even in the continuous permafrost zone (Jones et al., 2011). These landscape changes can have substantial impacts on the carbon-climate feedback: expanding ponds and lakes can act as net carbon sources when previously frozen organic carbon is mobilized to the atmosphere through aquatic processes (Walter et al., 2006; Laurion et al., 2010; Abnizova et al., 2012), whereas drained or shrinking water masses would rather act as net carbon sinks (at least for CO2) when resumed vegetation development and peat accumulation proceed in the old lakebeds through terrestrialization (Payette et al., 2004; Arlen-Pouliot and Bhiry, 2005; van Huissteden et al., 2011). Thus, the timing of such landscape changes and their consequences on sediment erosion and redistribution within thermokarst systems are of critical importance for the evolution of biogeochemical cycles in the north. Despite the importance of these ubiquitous systems in a region facing large climate pressures, the complex links between recent landscape evolution (e.g., geomorphology and hydrology) and related internal thermokarst processes (e.g., sedimentology, geochemistry, and limnology) remain poorly known. Building on remote sensing, geophysical and modeling studies of permafrost-thermokarst-vegetation changes over the past ~5 decades in Scandinavia, Siberia, Alaska, and western/ central Canada (Plug et al., 2008; Labrecque et al., 2009; Parsekian et al., 2011; Sannel and Kuhry, 2011), we aimed at filling the gap by adding new insights on sedimentological and geomorphological processes from the southern edge of the discontinuous permafrost zone in eastern Canada.
This study was part of a wider research program investigat-ing thermokarst ponds in subarctic Québec (Breton et al., 2009; Laurion et al., 2010; Bouchard et al., 2011; Watanabe et al., 2011; Bouchard et al., 2013 Rossi et al., 2013). The overall objectives of the present study were (1) to quantify changes in permafrost, thermokarst ponds, and vegetation surface areas during the last ~50 years, and (2) to identify the main processes controlling sedi-ment and chemical elesedi-ment dynamics in limnologically contrast-ing ponds through a complete annual cycle, includcontrast-ing seasonal changes (e.g., stratification and mixing, ice-cover formation, and melting). In a broader perspective, it provided a synthesized model for subarctic thermokarst pond evolution in the recent past, building on lithostratigraphic (Bouchard et al., 2011) and biostratigraphic (Bouchard et al., 2013) work conducted on sedi-ment cores at the same study site. This paper presents the results obtained within a delimited thermokarst pond area of ~25 hec-tares, focusing on six ponds with contrasting limnological prop-erties (e.g., color, transparency, and dissolved and particulate component concentrations). The approach combined (1) aerial photographs and satellite imagery and (2) sediment trap and sur-face soil sampling. To our knowledge, this study is the first of its kind concerning recent evolution and sedimentological dynamics of subarctic thermokarst ponds derived from the thawing of per-mafrost mounds, thereby contributing to a growing literature on thermokarst landscape evolution.
Study Area
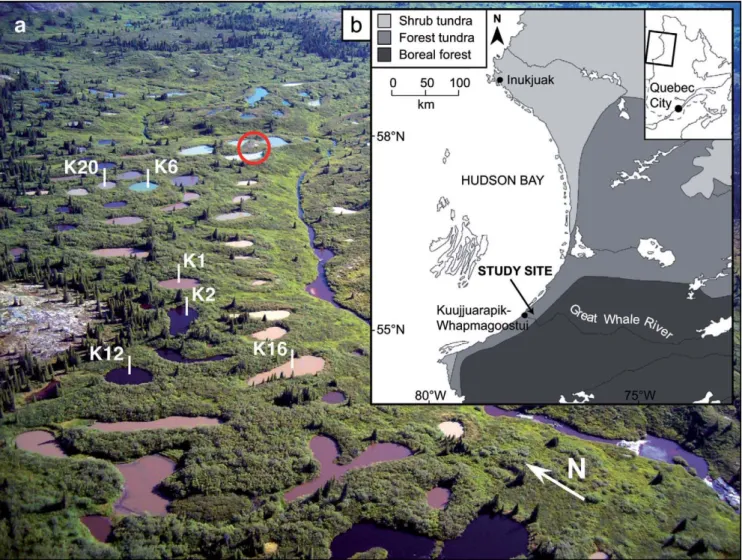
The study site (55°20′N, 77°30′W; 105 m a.s.l.) is located about 20 km inland from the southeastern coast of Hudson Bay, near the hamlet of Kuujjuarapik-Whapmagoostui in subarctic Québec (Fig. 1). It lies on Precambrian granitic/gneissic rocks strongly eroded by Pleistocene glaciations, the last one (Wiscon-sin) ending in the region around 8000 cal yr BP when the Lauren-tide Ice Sheet retreated northward and eastward (Dyke and Prest, 1987). Final break-up of the ice sheet triggered the rapid outburst of proglacial lake Agassiz-Ojibway (Barber et al., 1999; Lajeu-nesse and St-Onge, 2008) and the formation of the Late Glacial Sakami moraine (Hillaire-Marcel et al., 1981). This deglaciation was followed, around 7900 cal yr BP, by the postglacial transgres-sion of the Tyrrell Sea (precursor of Hudson Bay), which sub-merged the landscape up to present-day elevations of 250–300 m a.s.l. and left thick deposits of marine silty clays and littoral sands in topographic depressions (Hillaire-Marcel, 1976; Saulnier-Talbot and Pienitz, 2001). Postglacial emergence of the area occurred at about 6000 cal yr BP and glacio-isostatic uplift has been estimated at more than 1 m per century (Allard and Tremblay, 1983; Lavoie et al., 2012).
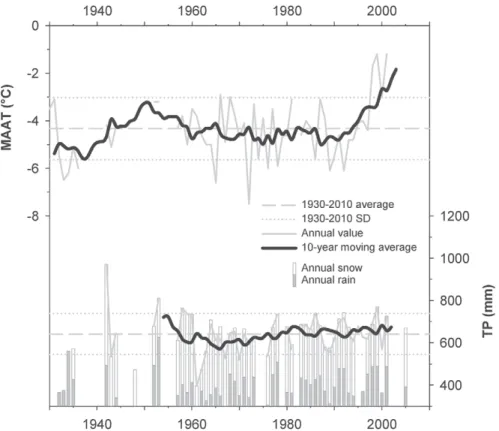
The prevailing climate is subarctic. Mean annual air tempera-ture at the Kuujjuarapik-Whapmagoostui weather station (55°17′N, 77°45′W; 10 m a.s.l.) is –4.4 °C, ranging from monthly means of –23.4 °C in January to 11.4 °C in August (Environment Canada, 2012a). The annual freezing index (sum of degree-days below zero) is 2890, more than twice the thawing index (sum of degree-days above zero), which is 1310. The mean frost-free period (mini-mum daily temperature >0 °C) is 126 days and the growing season extends from mid-May to the end of September. Annual precipita-tion is about 650 mm, with more than 35% falling as snow. Snow starts to accumulate on the ground in September-October, reaches a maximum depth (~40 cm) in March, and disappears at the end of May. During the last decades (since mid-1960s), the total an-nual precipitation has slightly and gradually increased, whereas the mean annual temperature has remained rather stable until the early 1990s when it started to increase sharply (Appendix Fig. A1). The study area lies at the southern edge of the discontinuous and scat-tered (also called sporadic) permafrost zone, where less than 50% of the land surface (mainly exposed hills and peatlands) is affected by permafrost (Allard and Seguin, 1987; Brown et al., 1998).
The study site is located in a small north-south-oriented thermokarst landscape covering about 0.5 km2 (~1.0 km N–S ×
~0.5 km E–W) and representative of the extensive permafrost peat-lands that developed over silt-clay marine deposits along eastern Hudson Bay (Allard and Seguin, 1987; Payette, 2001; Payette et al., 2004), and that are now in an advanced state of degradation. The thawing of permafrost mounds has triggered the formation of several thermokarst ponds (Fig. 1), which are now mostly circular (10–30 m diameter) and shallow (1–3.5 m depth). In most cases, they are surrounded by a 1–2 m high peripheral ridge covered by shrubs and trees, some of them with also small areas of aquatic grass meadows. They are located in the upper section of a small glacial valley that gently slopes southward toward the Kwakwa-tanikapistikw River (local Cree name), a tributary of the Great Whale River. Although the landscape is relatively flat, slight topo-graphic and hydrologic gradients extend from the west (adjacent rocky hills) to the east (steeply embedded creek). Based on former studies in the area (Arlen-Pouliot and Bhiry, 2005; Bhiry and Rob-ert, 2006; Calmels et al., 2008a) and on sediment sampling of the peripheral ridges (this paper), it is assumed that the marine sedi-ments between and underneath the ponds are permafrost-free. In
fact, only one mineral permafrost mound (lithalsa) is still visible on the site, and it is severely affected by thawing and surrounded by newly formed turbid thermokarst ponds (Figs. 1 and 3).
The vegetation cover in the region is typical of the forest-tundra zone in subarctic Québec (Payette and Bouchard, 2001). Sparse trees and shrubs (e.g., Picea mariana, P. glauca, Larix
la-ricina, Ledum groenlandicum, Betula glandulosa) colonize
periph-eral ridges, whereas poorly drained soils between the ponds are mostly occupied by dense shrubs (Salix sp., Alnus crispa, Myrica
gale), mosses (Sphagnum spp.), and herbaceous plants (e.g., Carex aquatilis). The studied ponds have strikingly different limnological
properties (Table 1), including dissolved organic carbon (DOC) and total suspended solids (TSS) (for a detailed limnological descrip-tion of these ponds and related methods see Breton et al., 2009; Laurion et al., 2010; and Watanabe et al., 2011). Most of them are relatively humic and nutrient-rich systems where dissolved organic matter (DOM) has a dominant allochthonous signature likely de-rived from thawing permafrost soils (Breton et al., 2009). Despite their shallow water depth, these ponds are characterized by low light availability (thus limited photosynthesis), remain seasonally
stratified with a hypoxic/anoxic hypolimnion, and are considered heterotrophic systems with supersaturated concentrations of dis-solved CO2 and CH4 (Laurion et al., 2010).
Methods
SPATIO-TEMPORAL ANALYSIS (REMOTE SENSING)
To quantify changes in permafrost, thermokarst, and vegeta-tion surface areas over the past five decades, we used remote sens-ing data available for the study site, includsens-ing aerial photographs from 1959 and a high-resolution satellite image from 2006. First, two adjacent black-and-white aerial photographs were acquired from La Géomathèque (Québec, QC, Canada). These photographs were taken on 7 July 1959 at a flight elevation of ~4800 m. With an original scale of half a mile per inch (1: 31,680), they were scanned (TIFF format) at 1814 dpi resolution, which provided a pixel size of 44 cm on the ground. Second, a panchromatic (450–900 nm) QuickBird scene was acquired from DigitalGlobe (Longmont, CO, U.S.A.). This satellite image was taken on 7 July 2006 under
cloud-FIGURE 1. Location of the study site. (a) Oblique aerial photograph showing sampled ponds (numbers as in the text). The red circle shows the only permafrost mound (lithalsa) still present in the field. (b) Regional map showing the vegetation zones in subarctic Québec (modified from Arlen-Pouliot and Bhiry, 2005). The study site (55°20′N; 77°30′W) is located near Kuujjuarapik-Whapmagoostui, along the Great Whale River.
free conditions and covered a 25-km2 area (center at 55°21.14′N,
77°32.37′W). The panchromatic band had a pixel size of 61 cm on the ground, thus comparable to the aerial photographs. The Quick-Bird image (Geotiff “ortho-ready” format, 16-bit) was geometri-cally corrected using the cubic convolution resampling method. It was then used to rectify and georeference the aerial photographs in ArcMap module (ArcGIS software version 10.0) using seven ground control points (GCP) evenly distributed on the ground (i.e., the four corners plus three GCP in the central part). This resulted in a total root mean square error (RMSE) of 4.28 pixels (1.8 m).
Five classes of areas were manually digitized for both pe-riods (1959 vs. 2006) in a delimited area of ~ 0.25 km2 (630 m
× 400 m), including (1) permafrost mounds (palsas/lithalsas), (2) thermokarst ponds, (3) dense tree vegetation (>50% of the surface, mainly black spruce), (4) creek, and (5) remaining area (Figs. 2 and 3). Deciduous shrubs (e.g., Salix, Betula, Alnus) could not be separated from the surrounding landscape (e.g., her-baceous plants, mosses), thus they were included in the “remain-ing area.” Manual delineation of land and water surfaces turned out to provide conclusive results with panchromatic high spatial resolution images, such as aerial photographs and QuickBird
imagery (Sannel and Brown, 2010; Sannel and Kuhry, 2011). Permafrost mounds, much more abundant in 1959, were easily recognized and delineated using the stereoscopic visualization of overlapping adjacent aerial photographs. Digitized polygons were converted into surfaces (m2) and percentages of the
delim-ited area for both periods. The distance (m) from the center of se-lected ponds in relation to the rocky hill outcrops to the west and the steeply embedded creek to the east was also digitized in order to characterize their spatial variability along the topographical and hydrological gradients.
SEDIMENT TRAPS, SOIL SAMPLING, AND LIMNOLOGY
To investigate sediment sources and pathways within thermokarst systems, we combined sediment trap, peripheral soil, and lacustrine sediment sampling. First, two sediment flux sensors equipped with an optical system (infrared light-emitting diodes and light-sensitive phototransistors) and a datalogger (one measurement every 6 hours) were installed in summer 2007 and retrieved in summer 2008 to record the precise timing and amount of sedimentation during the year (Appendix Fig. A2).
TABLE 1
Morphology, limnology, and type of analyses conducted in sampled ponds.
Pond #
K1 K2 K6 K12 K16 K20
brown black blue-green black beige beige Min Max Mean
General morphology Max depth m 2.3 3.0 3.5 2.7 2.5 2.7 2.3 3.5 2.7 Secchi depth m 0.53 1.40 0.86 1.21 0.22 0.30 0.22 1.40 0.75 UF thickness cm 4.5 2.0 3.0 2.0 0.75 2.0 1.5 4.5 2.5 Limnology DOC mg L–1 7.6 5.9 3.8 6.9 8.7 7.7 3.8 8.7 6.8 TSS mg L–1 6.3 2.8 3.7 2.5 24.3 22.2 2.5 24.3 10.3 DOC/TSS 1.2 2.1 1.0 2.8 0.4 0.3 0.3 2.8 1.3 TP μg L–1 39.7 36.3 25.9 24.7 74.7 a 67.5 24.7 74.7 a 44.8 Chl-a μg L–1 4.3 3.2 3.0 3.3 5.2 5.0 3.0 5.2 4.0 pH 6.6 6.3 6.3 6.3 7.2 6.2 6.2 7.2 6.5 Conductivity a μS cm–1 46 38 61 36 61 47 36 61 48 Top of oxycline b m 1.0–1.5 1.5–2.0 2.0 1.5 0.5–1.5 0.5–1.0 0.5 2.0 1.2 Sampling/analyses
Sediment trap depth m 1.0 1.75 2.25 1.5 1.25 1.5 1.0 2.25 1.5
Type of sediment trap passive passive passive active passive active
LOI measurements x x x x x x
Geochemistry (ICP) x x x
UF, upper facies (i.e., top lacustrine sediments in retrieved cores); DOC, dissolved organic carbon; TSS, total suspended solids; TP, total phosphorus; Chl-a, chlorophyll-a; LOI, loss-on-ignition; ICP, inductively coupled plasma spectrometry.
Morphological properties were measured in July 2007 (Bouchard et al., 2011), and limnological properties were measured in July 2006 or otherwise specified (I. Laurion, unpublished data).
a 2009 data.
These active sediment traps were designed to provide a continu-ous voltage output data—proportional to the number of light sen-sors progressively blocked as sediments accumulate in the ves-sel—which were then transformed back to sediment depths, thus accumulation rates (Lamoureux, 2005). They were deployed in two limnologically contrasting ponds: a humic-rich black-color-ed pond (K12) and a turbid beige-colorblack-color-ed pond (K20) (Table 1). Due to generally low accumulation rates in high latitude aquatic systems (Wolfe et al., 2004), a 92-cm2 funnel was mounted on top
to provide a 16:1 amplification of incoming sediment. The sen-sors were attached to a mooring line, with the buoy submerged at a minimum water depth of 0.75–1 m to avoid being stuck in and/or displaced by the ice cover during the winter. The trap was fixed 25–50 cm below the buoy (i.e., 1–1.25 m above the weight or pond bottom). Second, passive sediment traps (consisting of a 50-mL plastic tube) collecting bulk sediment during a full annual cycle were also installed over the same period (Appendix Fig. A2) using a similar mooring line (but with a soda bottle with comparable dimensions acting as funnel) in the remaining ponds (Table 1). Sediment trap material was sealed in the field (in plas-tic bottles) and brought back to the laboratory, where it was kept in the dark at 4 °C.
Additional sediment samples were collected from the pe-ripheral ridges of ponds in summer 2008 (Appendix Fig. A2). These samples were collected with a handheld auger at an
ap-proximate depth of 30–50 cm. For each pond, two or three sam-ples were taken and the resulting data were averaged. These sediments were transferred into polyethylene bags (Whirl-Pak®) and brought back to the laboratory (in the dark at 4 °C). Finally, to encompass the whole thermokarst system, we in-cluded in the present study results from surficial lacustrine sedi-ments (the uppermost 0.5 cm) extracted from sediment cores analyzed for lithostratigraphic and biostratigraphic proxies and already presented in companion papers (Bouchard et al., 2011, 2013). Among these data, we present diatom-inferred DOC con-centrations in surface sediments based on fossil diatom valves retrieved by standard techniques (for methodological details, see Bouchard et al., 2013.
All sediment samples (traps, peripheral ridges, and surficial lacustrine sediments) were transferred into glass bottles and dried at 105 °C for 24 hours. Loss-on-ignition (550 °C for ~4 h) was performed on subsamples of ~0.5 g, giving an approximation of organic matter content (Heiri et al., 2001). Finally, ~0.25 g of dried material from traps and surface sediments in three ponds was used to perform ICP-OES (inductively coupled plasma–op-tical emission spectrometry) and ICP-MS (inductively coupled plasma–mass spectrometry) measurements on major and minor or trace geochemical elements, respectively. Sediments were ground, homogenized, and completely digested with HNO3, HClO4 and HF. Acids were evaporated to near dryness and
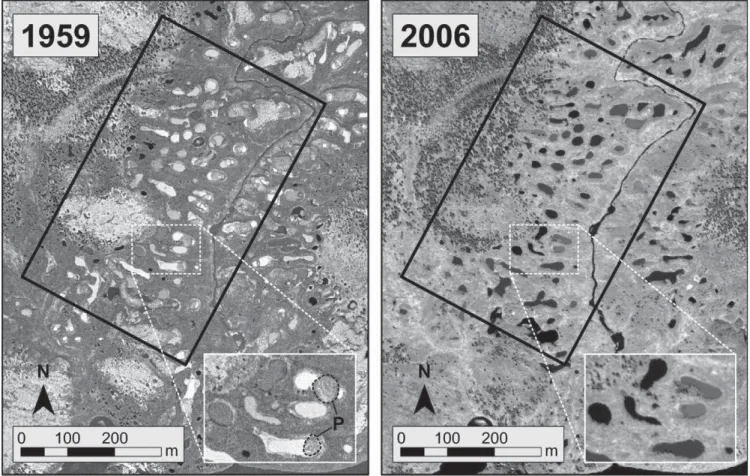
resi-FIGURE 2. Black and white aerial photograph (left) and QuickBird panchromatic satellite image (right) used to perform spatio-temporal mapping (1959 vs. 2006). Several permafrost mounds were still visible in 1959 (“P” in bottom-right enlargement) and easily digitized using the stereoscopic visualization of overlapping adjacent aerial photographs. The oblique bold rectangle represents the delimited area of ~0.25 km2 (630 m × 400 m) in which the mapping was done (results in Fig. 3).
dues redissolved in a HNO3 2.7% solution (McLaren et al., 1995). Certified materials MESS-3 and PACS-2 from the National Re-search Council of Canada (NRCC) were used to determine preci-sion and accuracy. Detailed results, as well as detection limit, precision, and accuracy for each detected element, are given in Appendix Tables A1 and A2.
Limnological data (e.g., DOC, TSS, and pH) were collected in summer 2006, 2007, and 2009 and partly reported by Laurion et al. (2010) for the year 2007. Some of these data were used in the present study to investigate the relationships between limnol-ogy, geomorphollimnol-ogy, and sedimentology of thermokarst systems. If not otherwise specified, the 2006 data series was used because (1) there were fewer missing values for all sampled ponds during that year, and (2) they precede surficial sediment sampling (2007), so the limnological conditions likely had enough time to be “re-corded” in surface sediments, allowing limnology-sedimentology comparisons. Remote sensing and geochemical results were com-pared to the limnological properties available from the six studied ponds (Table 1). Given the small sample size, we only report high-ly significant correlations with coefficients r ≥ 0.811 to r ≥ 0.917, which are the threshold values for p < 0.05 and p < 0.01, respec-tively (Sokal and Rohlf, 1995). Normality tests were performed on highly significant correlations and were found to be successful (p >> 0.05).
Results
LANDSCAPE EVOLUTION (1959–2006) IN THE AREA
Surface areas occupied by permafrost mounds, thermo-karst ponds, and dense tree vegetation have changed during the past 50 years, as shown in Figure 3 and Table 2 (upper section). The most drastic changes involved permafrost (96% decrease) and tree vegetation (327% increase), with no such significant change in thermokarst pond surface areas (2.5% decrease). In 1959, permafrost mounds represented nearly 9% of the landscape (>22 × 103 m2) and were mostly concentrated near the creek
run-ning along the eastern part of the study site. In 2006, only one min-eral mound (lithalsa) was still present, although showing evidence of severe thawing and settlement (large turbid thermokarst ponds rapidly developing in the surroundings). In contrast, dense tree vegetation increased more than three times during the same period, evolving from a thinly scattered coverage (2.4% of the landscape, <6 × 10³ m2), concentrated in the western part of the study site in
1959, to a notably more abundant coverage (>10% of the landscape, 25 × 103 m2) and migrating toward the east (along the
topographic-hydrologic gradient) in 2006. Finally, thermokarst pond surface areas showed no significant change between 1959 and 2006, repre-senting ~9% of the landscape (>22 × 103 m2) for both periods. This
proportion is two to three times higher than values estimated for
TABLE 2
Changes in permafrost mound, thermokarst pond, and vegetation surface areas (upper section), and in thermokarst pond characteristics (lower section) between 1959 and 2006.
Year
1959 2006
(aerial photos) (satellite image) Variation Surface areas Permafrost mounds m 2 22,350 820 –21,530 % 8.9 0.3 –96.3 Thermokarst ponds m 2 22,790 22,210 –580 % 9.1 8.9 –2.5 Dense vegetation (> 50 %) m 2 5940 25,370 +19,430 % 2.4 10.2 +327.1 Remaining area m 2 198,720 201,400 +2680 % 79.6 80.6 +1.3 Total m2 249,800 249,800 –
Thermokarst pond characteristics
Number of ponds n 107 79 –28
% –26.2
Mean pond size m
2 213.0 281.1 +68.1
% +32.0
Median pond size m
2 142.4 213.9 +71.5
% +50.2
Minimum pond size m
2 16.7 12.6 –4.2
% –24.8
Maximum pond size m
2 922.4 2067.1 +1144.6
the whole northern hemisphere, although from much larger lakes (>0.1 km2; Smith et al., 2007).
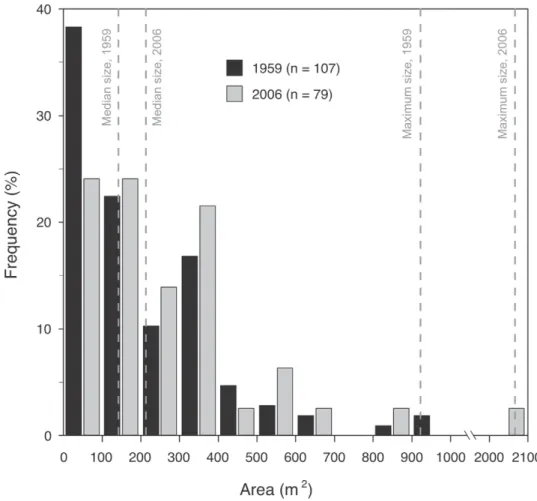
Despite showing few changes in spatial coverage (total sur-face area), thermokarst pond numbers and individual sizes greatly evolved during the past five decades, as shown in Figure 4 and Table 2 (lower section). Between 1959 and 2006, pond numbers decreased from 107 to 79 (–26%), corresponding to generally larger ponds in recent years since total area changed little. Indeed, both mean and median pond sizes increased from 213 to 281 m2
(+32%) and from 142 to 214 m2 (+50%), respectively. While the
minimum pond size slightly decreased from ~17 to 13 m2 (–25%),
the maximum pond size markedly increased from 922 to 2067 m2
(+124%). This is further detailed when pond sizes are separated in 100 m2 classes (Fig. 4): small-sized ponds (<200 m2) represented
cumulatively more than 60% in 1959, but less than 50% in 2006. The smallest ponds (0–100 m2) showed the most important change
in abundance between 1959 and 2006, with a >50% decrease (from 41 to 19). The observed increase in average pond size is partly caused by the merging of two or three ponds. During the same pe-riod, the relative proportion of medium-sized ponds (200–700 m2)
has generally increased, although their individual size was slightly reduced (see below).
MODERN DYNAMICS IN SAMPLED PONDS
As mentioned above, thermokarst pond total surface areas have remained relatively constant in recent decades around the
study site, which resulted—with reduced pond numbers—in gener-ally larger ponds (Table 2, Figs. 3 and 4). The individual surface ar-eas of the six sampled ponds have shown relatively minor changes over the past 50 years (Table 3, upper section). One pond slightly increased in size by 4% (K6), another pond showed no significant change (K2), and the others have decreased by ~10% (K12, K16) or ~20% (K1, K20). Overall, among the sampled ponds the trend is inverse to the general one, with mean surface area slightly reduced by about 10%. Distances from each sampled pond to the outcrop-ping rocky hill (west) or the steeply embedded creek (east) are also included in this section of Table 3, as they will further support proposed limnology-geomorphology-sedimentology relationships among ponds in the discussion. The six ponds sampled are gener-ally located closer to the rocky hill (mean distance = 66 m) than to the creek (mean distance = 117 m).
Physical (loss-on-ignition, LOI) and geochemical (S, P, Fe, Mg, and Ti) measurements made inside (sediment traps),
under-neath (surface sediments), and around (peripheral ridges)
thermo-karst ponds showed contrasting results (Table 3, lower section). Mean LOI in sediment traps was around 32% but appeared highly variable, ranging from 10% in turbid beige pond K16 to 69% in hu-mic black pond K2. LOI results were lower and less contrasting in surface sediments and peripheral ridges, with mean values of ~8% (6.5–10%) and ~5% (1.5–9%), respectively. Consequently, LOI ratios were far higher when trap data were involved (i.e., trap/sedi-ment or trap/ridge ratios). Concentrations of selected geochemi-cal elements are also presented for three contrasting ponds in the
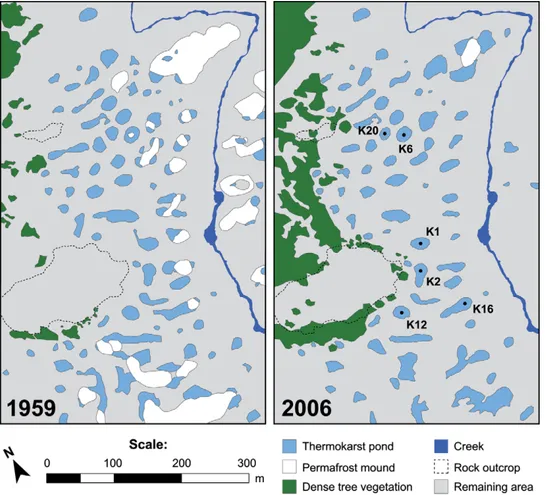
FIGURE 3. Thermokarst pond, permafrost mound, and vegetation surface areas in July 1959 and July 2006 (enlargement from the oblique rectangle of Fig. 2). Only one permafrost mound (also identified by the red circle in Fig. 1) is still visible in 2006. Rock outcrops to the west (dashed line) and a steeply embedded creek to the east (dark blue) are also shown. Sampled ponds (numbers as in the text) are identified on the 2006 map.
lower section of Table 3, including elements showing affinity for organic matter and/or sensitive to redox conditions (S, P, and Fe) and mostly detrital or carbonate-derived elements (Ti and Mg). In pond K2, S-P-Fe concentrations were much higher in the trap than in surface sediments, resulting in high (trap/sediments) ratios of S (14.0), P (9.7), and Fe (2.0). Contrastingly, detrital and carbonate elements appeared ~50% less concentrated in the trap compared to surface sediments (Ti ratio = 0.5; Mg = 0.4). In pond K6, geo-chemical elements were slightly more concentrated in the trap (S ratio = 1.2; P = 4.2; Fe = 1.5) or showed similar concentrations (Ti ratio = 0.9; Mg = 1.0) compared to surface sediments. Finally, pond K16 results were comparable between trap and surface sedi-ments, resulting in ratios of ~1 (except P = 1.5).
The two studied ponds in which active sediment traps (flux sensors) were installed showed strongly contrasting results (Fig. 5). In pond K12, the voltage output increased sharply twice dur-ing summer 2007 (early July and late July–early August), cor-responding to episodes of rapid sedimentation in the trap, and coinciding with relatively high rainfalls in the region. In early September 2007, an unexpectedly low output was recorded, like-ly due to the entrapment of a large aquatic insect (Coleoptera, ge-nus Dytiscus) that may have disturbed already settled sediments and subsequently biased measured fluxes of settling particles (Appendix Fig. A2). From that time, voltage outputs remained remarkably constant, except for two subtle peaks during snow-fall episodes in mid-September 2007 and mid-May 2008 (thus
likely outside the ice-cover period). Pond K20 provided a very different trend. Voltage output increased slowly in summer 2007, slightly faster in early fall 2007 (September-October), and then gradually decreased to reach low values during winter 2008. The only exception was the remarkable voltage peak (i.e., very high accumulation rate) in early January 2008, associated with higher-than-average temperature (near 0 °C) and 3–4 days of snowfall recorded at the weather station. Finally, two last episodes of in-creasing voltage output occurred during the second half of May 2008 and in early July 2008, likely due to late-spring snowfall and early summer rainfall, respectively. It is worth noting that these ponds do not totally freeze in winter, as internal probes in-dicated temperatures between 4 °C and 12 °C (data not shown).
LIMNOLOGY, GEOMORPHOLOGY, AND SEDIMENTOLOGY RELATIONSHIPS
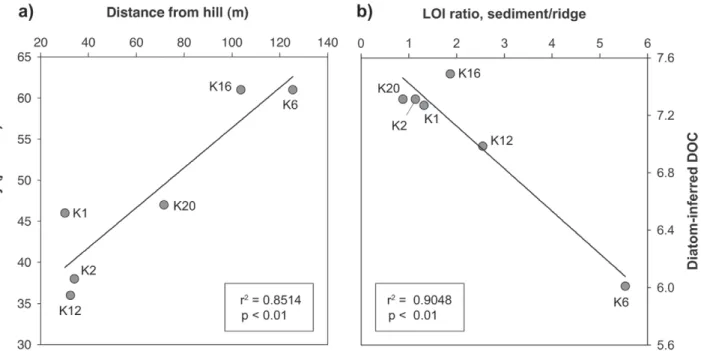
Spatio-temporal analysis (remote sensing) of the studied ponds and their surroundings, as well as the investigation of sedi-ment sources and pathways within them, provided contrasting results depending on pond properties and morphology. Some of these correlations are presented in Figure 6, although complete data are provided as a correlation matrix in Appendix Table A3. First, the distance from the center of each pond to the rocky hill (to the west) was significantly correlated with water conductivity (r2 = 0.85, p < 0.01) (Fig. 6, part a). This relationship may be
re-FIGURE 4. Relative frequencies of thermokarst ponds of various sizes (area in m2) in 1959 (black bars) and 2006 (gray bars). Median and maximum pond sizes are shown for both periods. Note the lack of ponds within the size range between 1000 and 2000 m2.
lated to the pond position along the topographical and hydrologi-cal gradients: ponds farther to the east overlying thicker postgla-cial marine sediments were slightly more alkaline and saline. In contrast, ponds closer to the hill were underlain by thinner marine sediment deposits and had more dilute, less conductive waters. Distance from the hill was also inversely correlated (r2 = 0.71, p
< 0.05) with the LOI contrast between sediment traps and surface sediments (Appendix Table A3). This confirms that ponds closer to the rocky hill (and closer to dense vegetation; see Fig. 3) had higher organic matter contents in the water column compared to surface sediments, as opposed to ponds located farther east with more turbid (less organic) waters.
Second, diatom-inferred DOC (DI-DOC) in surface sediments, modeled and presented by Bouchard et al. (2013) for these ponds, was inversely correlated (r2 = 0.91, p < 0.01)
to LOI contrast between surface sediment and peripheral ridges (Fig. 6, part b). DI-DOC results obtained from surface sediments can be considered reliable given their significant correlation with measured DOC (r2 = 0.77, p < 0.02) in the water column
(Appendix Table A3). Pond K6 stood clearly apart from other ponds, due to very low LOI in its peripheral ridge (<1.5%) as compared to the mean value for all sampled ponds (5.2%). This blue-green pond had by far the lowest DOC values among all sampled ponds (Table 1).
TABLE 3
Results from spatio-temporal mapping (upper section) and physical/geochemical analyses conducted inside (sediment traps), underneath (lacustrine sediments), and around (peripheral ridges) thermokarst ponds (lower section).
Pond #
K1 K2 K6 K12 K16 K20
brown black blue-green black beige beige Min Max Mean
Mapping results
1959 surface area m2 494.3 469.5 369.1 416.9 694.2 277.6 277.6 694.2 453.6
2006 surface area m2 389.0 470.4 384.5 364.9 635.6 221.4 221.4 635.6 411.0
Variation (1959–2006) m2 –105.3 +0.9 +15.4 –52.0 –86.0 –56.1 –105.3 +15.4 –47.2
% –21.3 +0.2 +4.2 –12.5 –11.9 –20.2 –21.3 +4.2 –10.3
Distance from hill m 30.1 34.2 125.5 32.4 103.8 71.6 30.1 125.5 66.3
Distance from creek m 77.9 90.4 141.8 152.0 63.3 174.9 63.3 174.9 116.7 Physical and geochemical results
LOI, trap % 39.3 69.3 15.6 41.9 10.2 12.3 10.2 69.3 31.5
LOI, sediments % 6.5 10.1 8.2 9.3 8.0 7.0 6.5 10.1 8.2
LOI, ridge % 4.9 8.9 1.5 3.7 4.3 8.0 1.5 8.9 5.2
LOI ratio, trap/sediments 6.1 6.8 1.9 4.5 1.3 1.8 1.3 6.8 3.7
LOI ratio, trap/ridge 8.0 7.8 10.5 11.4 2.4 1.6 1.6 11.4 6.9
LOI ratio, sediments/ridge 1.3 1.1 5.5 2.5 1.9 0.9 0.9 5.5 2.2
S, trap μmol g–1 190.2 52.9 16.0 16.0 190.2 86.4 S, sediments μmol g–1 13.6 43.2 14.8 13.6 43.2 23.8 S ratio, trap/sediments 14.0 1.2 1.1 1.1 14.0 5.4 P, trap μmol g–1 311.4 114.1 47.4 47.4 311.4 157.6 P, sediments μmol g–1 32.0 27.3 32.0 27.3 32.0 30.4 P ratio, trap/sediments 9.7 4.2 1.5 1.5 9.7 5.1
Fe, trap μmol g–1 1479.4 1034.5 809.7 809.7 1479.4 1107.8
Fe, sediments μmol g–1 755.5 694.4 795.4 694.4 795.4 748.4
Fe ratio, trap/sediments 2.0 1.5 1.0 1.0 2.0 1.5
Mg, trap μmol g–1 321.2 588.9 675.7 321.2 675.7 528.6
Mg, sediments μmol g–1 727.8 609.6 749.0 609.6 749.0 695.5
Mg ratio, trap/sediments 0.4 1.0 0.9 0.4 1.0 0.8
Ti, trap μmol g–1 30.9 56.3 68.9 30.9 68.9 52.0
Ti, sediments μmol g–1 67.9 61.5 68.0 61.5 68.0 65.8
Discussion
POND MORPHO-LIMNOLOGY AS A CONTROLLING FACTOR ON SEDIMENTOLOGY
As mentioned above, we found a significant, inverse relation-ship between DI-DOC and LOI ratio (sediment/ridge) (Fig. 6, part b). In other words, the more organic-rich the peripheral ridges are (i.e., low sediment/ridge ratio), the more abundant high-DOC dia-tom species (e.g., genera Frustulia, Caloneis, Pinnularia) will be. This confirms the important control of highly organic
surround-ings or semi-dry aerophilous, bryophilous substrates (e.g., peat and moss patches on peripheral ridges at the initial pond inception) on diatom community composition, as observed at this particular site and elsewhere in tundra wetlands of the Canadian Arctic (Ellis et al., 2008). Moreover, DI-DOC in these ponds has slightly de-creased in recent years, which has been attributed by Bouchard et al. (2013) to (1) the variable impact of peat patches in pond catch-ments during their initial development, (2) their apparently small catchments, and (3) the influence of abundant mineral (organic-poor) particles eroded from their littoral zones, settling, and
ad-FIGURE 5. Active (flux sensor) sediment trap and meteorological data from 06 July 2007 to 11 July 2008. (a) Voltage outputs (black curves), proportional to accumulated sediments, and sediment accumulation rates (gray bars) in two limnologically contrasting ponds, the humic/ black-colored pond K12 (upper graph) and the turbid/beige-colored pond K20 (lower graph). An unexpectedly low output (*) in early September 2007 is likely due to a large aquatic insect that may have disturbed already settled sediments in pond K12 (Appendix Fig. A2). Data recorded at 6-h time steps by sediment flux sensors (Lamoureux, 2005). (b) Mean temperature (black curve, upper graph), total precipitation (gray bars, upper graph), snow depth (black curve, lower graph) and snow precipitation (gray bars, lower graph) at the Kuujjuarapik-Whapmagoostui weather station. Daily data retrieved online (Environment Canada, 2012b). Vertical gray-shaded areas indicate enhanced sedimentation episodes (recorded either in K12 or K20) likely related to meteorological events, such as heavy rainfall/snowfall or winter temperatures near 0 °C.
sorbing dissolved organic molecules, thus progressively isolating the initial DOC source from the water column. This evolutional sequence may contribute to the continuous “transfer” of DOC from peripheral ridges—at least the organic-rich ones—to bottom sedi-ments, associated with decreasing DOC in the water column. As a consequence, thermokarst pond evolution stages—their geomor-phology—likely control their limnological and sedimentological properties, underscoring the major influence of autogenic (in situ) processes (e.g., vegetation and soil development, peat accumula-tion and erosion) in addiaccumula-tion to allogenic forcing mechanisms (e.g., climate, geochemical leaching in the surroundings) on diatom community changes in the recent past.
Furthermore, sediment trap data provide evidence of direct links that exist between pond morphology (depth), limnology (oxycline position, redox conditions, organic matter, TSS), and sedimentology (dissolution vs. precipitation and transport of particles or chemical elements). Voltage outputs (proportional to accumulated sediments) and accumulation rates in active sediment traps (flux sensors) during a full annual cycle (Fig. 5) can be interpreted in relation to sediment trap position and the development of steep thermal/oxygenic stratification. In pond K12, the sensor was deployed at ~1.5 m depth, which corresponds to the top of the seasonal oxycline for this pond (Table 1). The sensor was thus located at a depth where it could detect autochthonous or detrital particle inputs resulting from enhanced productivity or surface runoff around the pond during the ice-free period. Such events likely occurred during relatively high temperature and heavy rainfall episodes in summer 2007. During the winter, voltage outputs remained remarkably constant, likely due to the ice cover build-up and its associated reduction in planktonic production and littoral erosion, but also because of partial obstruction of the sedimentation vessel by the large aquatic insect mentioned above (see Results section). The sensor deployed in highly turbid and
steeply stratified pond K20 was substantially below the top of the seasonal oxycline (1.5 m vs. 0.5–1.0 m, respectively), thus located in strongly oxygen-depleted waters for most of the year. The shaded and anoxic environment of this pond may have prevented high sedimentation rates (especially particulate organic matter), as indicated by generally lower voltage outputs compared to pond K12 (Fig. 5), even though this pond has more suspended solids than K12 (mainly inorganic particles like clays and silts, which have very low settling rates). In this regard, the gradually increasing voltage output in September–October 2007 may be related to fall overturn, occurring around this time of the year in the similar nearby pond K16 (Laurion et al., 2010). Nevertheless, the only exception to such relatively weak accumulation is the sharp sedimentation peak recorded in early January 2008, associated with higher-than-average temperature (near 0 °C). The resulting partial thawing of snow/ice in the surroundings possibly induced enhanced detritic inputs in this particular pond, although continuous snow depths and ice cover thickness measurements are not available for the study site to confirm this assertion. Under these circumstances, it is also difficult to explain why this specific regional meteorological warming event was not recorded in the other pond (K12), unless ice cover and snow depth were substantially different above and around it. Finally, these ponds do not totally freeze in winter, which is consistent with surface and bottom water temperatures recorded by Laurion et al. (2010) in nearby pond K16 during the same period, which revealed that both surface and bottom temperatures always remained above zero in winter, likely due to high snow entrapment over the ponds.
Sedimentological processes occurring in thermokarst ponds and their anaerobic sediments can have a significant influence on the carbon cycle in such systems, as methane production can be fueled by early diagenetic mechanisms occurring under anoxic con-ditions, such as sulfate reduction and acetate fermentation (Berner,
FIGURE 6. Correlation plots between selected limnological properties, landscape mapping, and biogeochemical results measured inside (sediment traps), underneath (lacustrine sediments), and around (peripheral ridges) thermokarst ponds (n = 6). More correlations are presented in Appendix Table A3. See Bouchard et al. (2013) for details on the determination of diatom-inferred DOC.
1980; Walter et al., 2008). Investigating thermokarst lake sedi-ments in a partly thawed palsa peatland of western Siberia, Audry et al. (2011) observed intense microbial mineralization of organic matter (mainly derived from peat lixiviation) in surface sediment pore water under anoxic conditions. They also documented a shift in mineralization pathways during the course of lake development and maturation (from small shallow ponds to partly drained larger lakes), from nitrate and sulfate reduction in small ponds to reduc-tive dissolution of Fe and Mn oxyhydroxides in larger drained lakes. These results obtained in surficial anaerobic sediments greatly differ from the observations made in the overlying water column of the same thermokarst lakes, where aerobic respiration of heterotrophic bacterioplankton releases CO2 to the atmosphere through DOC consumption (Shirokova et al., 2009; Pokrovsky et al., 2011). This marked difference could also be partly related to contrasting water balances and pond/lake water sources (thawed permafrost ice vs. precipitation-evapotranspiration), as reported from eastern Siberia (Abnizova et al., 2012). In spite of shallow water depths, thermokarst ponds at our study site are seasonally strongly stratified through most of the year and are net sources of methane, with large increases observed near the surface sedi-ments in the anoxic/hypoxic hypolimnion (Laurion et al., 2010). This steep thermal stratification is a direct consequence of the high humic content and especially the very high turbidity in most of these systems, which is in turn related to sedimentation dynamics. This underscores the major influence of bottom water limnology and sedimentology on biogeochemical processes in thermokarst systems, as already suggested for our study site.
THERMOKARST LANDSCAPE EVOLUTION: SPATIAL AND TEMPORAL CONSIDERATIONS
The spatio-temporal mapping of the main landscape features over the past 50 years, as well as the investigation of modern sedi-ment sources and pathways in thermokarst ponds, have docusedi-ment- document-ed three mechanisms: (1) permafrost mound thawing, modifying the local hydrology and geomorphology and providing new inputs of sediments, water, and chemical elements; (2) thermokarst pond inception and evolution, acting as temporary biogeochemical res-ervoirs and potentially contributing to local GHG emissions from strongly stratified waters to the atmosphere; and (3) vegetation de-velopment and densification, driving changes in snow depth distri-bution, thus affecting soil properties (e.g., heat, humidity).
Results from the spatio-temporal mapping indicated that the near disappearance of permafrost-affected areas was accompanied by a remarkable increase in vegetation cover (Table 2, Figs. 3 and 4). In 1959, permafrost mounds were mostly concentrated near the creek in the east, thus topographically (and hydrologically) lower than already formed thermokarst ponds in the west (Fig. 3). Given their closer location to the center of this postglacial valley, these mounds were likely underlain by thicker frost-susceptible marine sediments, potentially containing ice layers that would contrib-ute to delay their complete thawing and subsidence by the latent heat effect. Such frost-susceptible marine deposits (several meters thick), containing up to 80% of ice in the form of centimeter-scale segregated ice lenses and therefore delaying final thermokarst subsidence of the overlying surface layers, were indeed described along the southeastern coast of Hudson Bay (Allard et al., 1996). However, more detailed cryostratigraphic or geophysical work (e.g., thermistor cables, boreholes, and ground-penetrating radar) is needed to further assess the impact of this mechanism at our study site.
In 1959, already mature thermokarst ponds were mostly lo-cated in the western part of the study area, near the outcropping rocky hills (Fig. 3). These were thus more likely to be influenced by surface and groundwater flows originating from nearby hills and slopes. Such sheltered hillslopes generally accumulate more snow, which contributes to the general water and heat flows in the area. Combined with the lack of thick ice-rich marine deposits, the west-ern part of the study area likely became an early source of thermal flux by surface and groundwater flows. Permafrost thawing and subsidence and related thermokarst development, caused by lateral heat flow along hydrological gradients, have been observed and reported by Calmels et al. (2008a, 2008b) from a rapidly degrad-ing permafrost landscape in eastern Hudson Bay. Again, detailed geophysical data are not available at our study site, although such processes likely occurred in comparable permafrost landscapes.
Vegetation changes between 1959 and 2006 also appeared to follow the local topography, hydrology, and geomorphology. In 1959, tree-covered areas were rather sparse and mostly located in the western part of the study site (Figs. 2 and 3), thus at slightly higher elevation along the local topographical-hydrological gradi-ent, but also on relatively thin surficial postglacial marine deposits. In 2006, tree vegetation was still more abundant in the western area but also had succeeded in migrating eastward, even partly surrounding several thermokarst ponds. Shrub development and expansion was possibly following the same pattern, as observed elsewhere in subarctic Québec (Ropars and Boudreau, 2012; Trem-blay et al., 2012). Thus, over the last ~5 decades, vegetation, per-mafrost, and thermokarst dynamics proceeded from the west (thin frost-susceptible surface deposits, higher topography, upstream lo-cation) to the east (thicker deposits, lower topography, downstream location). The typical low-lying fen or bog vegetation surround-ing several ponds (e.g., sedges, mosses, dwarf willows) was not distinctly mapped at our study site because of difficult land-water separation of such surfaces on black-and-white images (Sannel and Brown, 2010). However, the monitoring over the past 50 years of a subarctic permafrost peatland containing many thermokarst ponds (Payette et al., 2004) revealed that rapid permafrost thawing caused by recent climate change has resulted in two concurrent trajectories linked to the carbon budget: (1) thermokarst pond inception and mature development (assumed as carbon source), and (2) rapid ter-restrialization by fen/bog vegetation growth and peat accumulation (assumed as carbon sink). These contrasting natural mechanisms were possibly also acting at our study site, although active terres-trialization was not clearly visible and may not be as efficient in turbid thermokarst ponds that are surrounded and underlain by im-permeable silts and clays.
The studied thermokarst landscape is similar to many others formed during the Holocene along the eastern coast of Hudson Bay (Payette et al., 2004; Vallée and Payette, 2007; Calmels et al., 2008a), and also elsewhere in subarctic regions where permafrost is rapidly degrading since the early 20th century (e.g., Zuidhoff and Kolstrup, 2000; Sannel and Kuhry, 2011). However, most studies in these regions (including northeastern Canada) have considered thermokarst ponds as the final or transitional stage in the degradation sequence of permafrost mounds, or as an indicator of ancient periglacial forms (e.g., Allard et al., 1996; Matthews et al., 1997; Luoto and Seppälä, 2003; Payette et al., 2004; Calmels et al., 2008a). With the exception of recent work done in a subarctic palsa peatland of western Siberia (Shirokova et al., 2009; Audry et al., 2011; Pokrovsky et al., 2011), few studies have investigated the links between external (landscape) and internal (sedimentology, biogeochemistry) processes controlling thermokarst pond
evolution. Yet, sediments retrieved from these aquatic systems can provide useful information about their life cycle and responses to external climate and environmental changes.
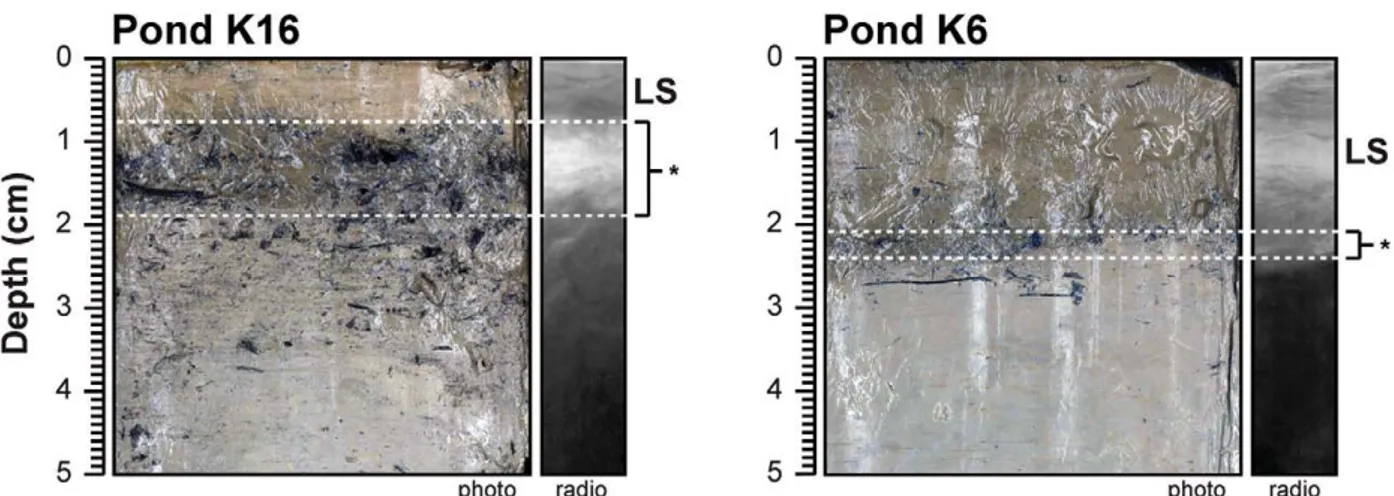
The developmental stage of subarctic thermokarst ponds has been suggested as one of the major factors affecting their limno-logical properties (Breton et al., 2009), as it is likely to control their trophic state and stability (e.g., through microbial community composition, aquatic plant colonization, and reduced erosion/sus-pension of silts and clays). The temporal dynamics of thermokarst ponds and the duration of successional aquatic states should there-fore have significant impacts on local biogeochemical fluxes. Map-ping a series of thermokarst ponds (1959 vs. 2006) has shown that ponds formed before 1959 (e.g., K2, K12) were generally located near the outcropping rocky hill on the western side of the study area, whereas ponds formed more recently (e.g., K16) were clos-er to the creek on the eastclos-ern side (Fig. 3). These youngclos-er ponds (“post-1959”) generally have very turbid waters (Fig. 1), although this relationship may not be as straightforward for other ponds be-cause of the notable landscape heterogeneity in peat patches dur-ing early stages of pond formation (Pissart, 2002; Calmels et al., 2008a), possibly dependent on local topography (e.g., the position relative to the rocky hill) and the direction of dominant winds. Organic-rich peat layers were indeed found below lacustrine sedi-ments in most of the study ponds Bouchard et al., 2013. Therefore, only the broad evolutionary stages of thermokarst ponds can be associated with some of their limnological characteristics (such as TSS content): the youngest ponds are all notably turbid and have thus a characteristic milky color. If a peat cover was still present when the corresponding permafrost mound thawed, it could have resulted in high DOC concentrations from peat lixiviation. Pond K16 is an example of such a young pond with high turbidity (TSS > 20 mg L–1) and relatively high DOC (8.7 mg L–1, clearly above
the 6.8 mg L–1 mean for all sampled ponds; Table 1), in which a
peat layer was observed below thin (<1 cm) lacustrine sediments (Appendix Fig. A3). In contrast, pond K6 has lower DOC and much lower TSS, and it lacked such a well-defined peat layer in retrieved cores, although some organic debris was found below the lacustrine sediments. (For detailed macro-/microscopic descrip-tions see Bouchard et al., 2011.) Therefore, a straightforward age-limnology relationship cannot be easily inferred from this kind of environment and is likely biased by the landscape-scale heteroge-neity of peat deposits during pond inception. A more detailed peat sampling survey conducted around and underneath these ponds should provide new insights in this regard.
Recent landscape changes and related sedimentological pro-cesses are of great interest for understanding carbon-climate feed-backs, since GHG emissions at high latitudes may be determined by local factors such as topography, hydrology, and vegetation cover (e.g., Liblik et al., 1997; Christensen et al., 2004; Wickland et al., 2006; Flessa et al., 2008; Bäckstrand et al., 2010). With their highly organic waters and catchments, thermokarst ponds and lakes are expected to play a major role in future climate dynamics, either as a carbon source through GHG emissions (Walter et al., 2006; Schuur et al., 2008; Laurion et al., 2010), or as a carbon sink by accumulating peat through natural terrestrialization (Payette et al., 2004). However, the controlling processes involved have yet to be fully understood and quantified at different temporal and spatial scales. In this regard, studies such as the one presented here are a starting point, though more detailed hydro-ecological investiga-tions (e.g., water and sediment stable isotope tracers like 18O and
thorough analysis of peat deposits) should help identify and inter-pret the biogeochemical processes involved.
Conclusions
Combining spatio-temporal mapping and sediment trap data, this study yielded new insights into climate-induced subarctic permafrost thawing and thermokarst pond dynamics over the last ~5 decades. As expected at this latitude, permafrost mound surface areas substantially decreased and palsas/lithalsas almost disappeared between the late 1950s and late 2000s. However, this change was not compensated by a corresponding increase in the total surface area occupied by thermokarst ponds, but rather by a remarkable threefold increase in vegetation cover. Moreover, the observed geomorphological and ecological changes (permafrost-thermokarst-vegetation) proceeded along the local topographical-hydrological gradient (from west to east), thus from “thin and ice-poor” to “thick and ice-rich” postglacial surface deposits, which likely delayed final surface subsidence in the eastern part of the study area. As a consequence, eastern thermokarst ponds are now generally younger (<50 years old) with more turbid and electrolyte-rich waters, compared to older (>50 years old) and more diluted and humic ponds in the west.
This study also shed light on sedimentological and geochemical processes occurring in strongly stratified thermokarst ponds with seasonal hypoxic/anoxic bottom waters. We demonstrated that the concentration of organic matter and chemical elements varied greatly—by an order of magnitude—among ponds and within the water column, and provided an integrated model of thermokarst pond geochemistry that combines aspects of pond morphology, limnology, and sedimentology. These findings confirm and refine recent paleolimnological reconstructions based on sediment core analyses from the same ponds, and underscore the importance of local landscape properties (e.g., geomorphology) that modulate regional forcing mechanisms (e.g., climate). Additional studies conducted in comparable thermokarst landscapes should provide more insights into large-scale landscape changes and their impacts on pond and lake sedimentological and limnological properties.
Acknowledgments
We are grateful to C. Dupont, T. Harding, T. Roiha, P.-G. Rossi, A. Rouillard, M. P. Rousseau, D. Sarrazin, and S. Watanabe for their assistance in the field; Y. Gauthier, J. Poulin, and C. Zim-mermann for their help in the laboratory; and R. Tremblay and C. Gobeil for inspiring discussions. L. Provencher-Nolet was a great help in performing the spatio-temporal analysis (remote sensing). We also thank the Inuit and Cree communities of Kuujjuarapik and Whapmagoostui for their support and access to all-terrain vehicle trails; the Centre d’études nordiques (CEN) for logistical support during fieldwork campaigns; and two anonymous reviewers as well as the AAAR editing team for their insightful comments that considerably improved the manuscript. This project was funded through grants from the Fonds de recherche du Québec–Nature et Technologies (FRQNT), the Natural Sciences and Engineering Re-search Council of Canada (NSERC), ArcticNet, and the Northern Scientific Training Program (NSTP) of Indian and Northern Af-fairs Canada.
References Cited
Abnizova, A., Siemens, J., Langer, M., and Boike, J., 2012: Small ponds with major impact: the relevance of ponds and lakes in permafrost landscapes to carbon dioxide emissions. Global Biogeochemical Cycles, 26: GB2041, doi: http://dx.doi.org/10.1029/2011GB004237.
Agafonov, L., Strunk, H., and Nuber, T., 2004: Thermokarst dynamics in Western Siberia: insights from dendrochronological research. Palaeogeography, Palaeoclimatology, Palaeoecology, 209: 183–196.
Allard, M., and Seguin, M. K., 1987: Le pergélisol au Québec nordique: bilan et perspectives. Géographie physique et Quaternaire, 41: 141–152. Allard, M., and Tremblay, G., 1983: La dynamique littorale des îles
Manitounuk durant l’Holocène. Zeitschrift für Geomorphologie, Supplementbände, 47: 61–95.
Allard, M., Caron, S., and Bégin, Y., 1996: Climatic and ecological controls on ice segregation and thermokarst: the case history of a permafrost plateau in northern Quebec. Permafrost and Periglacial Processes, 7: 207–227.
Arlen-Pouliot, Y., and Bhiry, N., 2005: Palaeoecology of a palsa and a filled thermokarst pond in a permafrost peatland, subarctic Quebec, Canada. The Holocene, 15: 408–419.
Audry, S., Pokrovsky, O., Shirokova, L., Kirpotin, S., and Dupré, B., 2011: Organic matter mineralization and trace element post-depositional redistribution in Western Siberia thermokarst lake sediments. Biogeosciences, 8: 3341–3358.
Bäckstrand, P., Crill, P., Jackowicz-Korczyñski, M., Mastepanov, M., Christensen, T. R., and Bastviken, D., 2010: Annual carbon gas budget for a subarctic peatland, northern Sweden. Biogeosciences, 7: 95–108.
Barber, D. C., Dyke, A. S., Hillaire-Marcel, C., Jennings, A. E., Andrews, J. T., Kerwin, M. W., Bilodeau, G., McNeely, R., Southon, J., Morehead, M. D., and Gagnon, J.-M., 1999: Forcing of the cold event of 8,200 years ago by catastrophic drainage of Laurentide lakes. Nature, 400: 344–348.
Beilman, D. W., Vitt, D. H., and Halsey, L. A., 2001: Localized permafrost peatlands in Western Canada: definition, distributions, and degradation. Arctic, Antarctic, and Alpine Research, 33: 70– 77.
Berner, R. A., 1980: Early Diagenesis: a Theoretical Approach. New York: Princeton University Press, 241 pp.
Bhiry, N., and Robert, E. C., 2006: Reconstruction of changes in vegetation and trophic conditions of a palsa in a permafrost peatland, subarctic Québec, Canada. Ecoscience, 13: 56–65.
Bouchard, F., Francus, P., Pienitz, R., and Laurion, I., 2011: Sedimentology and geochemistry of thermokarst ponds in discontinuous permafrost, subarctic Quebec, Canada. Journal of Geophysical Research–Biogeosciences, 116: G00M04, doi: http:// dx.doi.org/10.1029/2011JG001675.
Bouchard, F., Pienitz, R., Ortiz, J. D., Francus, P., and Laurion, I., 2013: Palaeolimnological conditions inferred from fossil diatom assemblages and derivative spectral properties of sediments in thermokarst ponds of subarctic Quebec, Canada. Boreas, 42: 575– 595, http://onlinelibrary.wiley.com/doi/10.1111/bor.12000/full. Breton, J., Vallières, C., and Laurion, I., 2009: Limnological properties
of permafrost thaw ponds in northeastern Canada. Canadian Journal of Fisheries and Aquatic Sciences, 66: 1635–1648.
Brosius, L. S., Walter Anthony, K. M., Grosse, G., Chanton, J. P., Farquharson, L. M., Overduin, P. P., and Meyer, H., 2012: Using the deuterium isotope composition of permafrost meltwater to constrain thermokarst lake contributions to atmospheric CH4 during the last deglaciation. Journal of Geophysical Research–Biogeosciences, 117: G01022, doi: http://dx.doi.org/10.1029/2011JG001810. Brown, J., Ferrians, O. J., Heginbottom, J. A., and Melnikov, E. S.,
1998: Circum-Arctic map of permafrost and ground-ice conditions. Boulder, Colorado: National Snow and Ice Data Center/World Data Center for Glaciology.
Calmels, F., Allard, M., and Delisle, G., 2008a: Development and decay of a lithalsa in northern Quebec: a geomorphological history. Geomorphology, 97: 287–299.
Calmels, F., Delisle, G., and Allard, M., 2008b: Internal structure and the thermal and hydrological regime of a typical lithalsa: significance for permafrost growth and decay. Canadian Journal of Earth Sciences, 45: 31–43.
Carroll, M. L., Townshend, J. R. G., DiMiceli, C. M., Loboda, T., and Sohlberg, R. A., 2011: Shrinking lakes of the Arctic: Spatial relationships and trajectory of change. Geophysical Research Letters, 38: L20406, doi: http://dx.doi.org/10.1029/2011GL049427. Christensen, T. R., Johansson, T., Ökerman, H. J., Mastepanov, M.,
Malmer, N., Friborg, T., Crill, P., and Svensson, B. H., 2004: Thawing sub-arctic permafrost: effects on vegetation and methane emissions. Geophysical Research Letters, 31: L04501, doi: http:// dx.doi.org/10.1029/2003GL018680.
Dyke, A. S., and Prest, V. K., 1987: Late Wisconsinan and Holocene history of the Laurentide Ice Sheet. Géographie physique et Quaternaire, 41: 237–263.
Ellis, C. J., Rochefort, L., Gauthier, G., and Pienitz, R., 2008: Paleoecological evidence for transitions between contrasting landforms in a polygon-patterned High Arctic wetland. Arctic, Antarctic, and Alpine Research, 40: 624–637.
Environment Canada, 2012a: Canadian Climate Normals or Averages 1971–2000, http://climate.weatheroffice.gc.ca/climate_normals/ index_e.html.
Environment Canada, 2012b: Climate Data Online, http://climate. weatheroffice.gc.ca/climateData/canada_e.html.
Flessa, H., Rodionov, A., Guggenberger, G., Fuchs, H., Magdon, P., Shibistova, O., Zrazhevskaya, G., Mikheyeva, N., Kasansky, O. A., and Blodau, C., 2008: Landscape controls of CH4 fluxes in a catchment of the forest tundra ecotone in northern Siberia. Global Change Biology, 14: 2040–2056.
Heiri, O., Lotter, A. F., and Lemcke, G., 2001: Loss on ignition as a method for estimating organic and carbonate content in sediments: reproducibility and comparability of results. Journal of Paleolimnology, 25: 101–110.
Hillaire-Marcel, C., 1976: La déglaciation et le relèvement isostatique sur la côte est de la baie d’Hudson. Cahiers de géographie du Québec, 20: 185–220.
Hillaire-Marcel, C., Occhietti, S., and Vincent, J.-S., 1981: Sakami moraine, Quebec: a 500-km-long moraine without climatic control. Geology, 9: 210–214.
Jones, B. M., Grosse, G., Arp, C. D., Jones, M. C., Anthony, K. M. W., and Romanovsky, V. E., 2011: Modern thermokarst lake dynamics in the continuous permafrost zone, northern Seward Peninsula, Alaska. Journal of Geophysical Research–Biogeosciences, 116: doi: http:// dx.doi.org/10.1029/2011JG001666.
Jorgenson, M. T., Shur, Y. L., and Pullman, E. R., 2006: Abrupt increase in permafrost degradation in Arctic Alaska. Geophysical Research Letters, 33: L02503, doi: http://dx.doi.org/10.1029/2005GL024960. Kortelainen, P., Rantakari, M., Huttunen, J. T., Mattsson, T., Alm, J.,
Juutinen, S., Larmola, T., Silvola, J., and Martikainen, P. J., 2006: Sediment respiration and lake trophic state are important predictors of large CO2 evasion from small boreal lakes. Global Change Biology, 12: 1554–1567.
Labrecque, S., Lacelle, D., Duguay, C. R., Lauriol, B., and Hawkings, J., 2009: Contemporary (1951–2001) evolution of lakes in the Old Crow Basin, northern Yukon, Canada: remote sensing, numerical modeling, and stable isotope analysis. Arctic, 62: 225–238. Lajeunesse, P., and St-Onge, G., 2008: The subglacial origin of the lake
Agassiz-Ojibway final outburst flood. Nature Geoscience, 1: 184–188. Lamoureux, S. F., 2005: A sediment accumulation sensor for use in
lacustrine and marine sedimentation studies. Geomorphology, 68: 17–23.
Laurion, I., Vincent, W. F., MacIntyre, S., Retamal, L., Dupont, C., Francus, P., and Pienitz, R., 2010: Variability in greenhouse gas emissions from permafrost thaw ponds. Limnology and Oceanography, 55: 115–133.
Lavoie, C., Allard, M., and Duhamel, D., 2012: Deglaciation landforms and C-14 chronology of the Lac Guillaume–Delisle area, eastern Hudson Bay: a report on field evidence. Geomorphology, 159-160: 142–155.
Liblik, L. K., Moore, T. R., Bubier, J. L., and Robinson, S. D., 1997: Methane emissions from wetlands in the zone of discontinuous