OATAO is an open access repository that collects the work of Toulouse researchers and makes it freely available over the web where possible
Any correspondence concerning this service should be sent to the repository administrator: [email protected]
This is a Publisher’s version published in: http://oatao.univ-toulouse.fr/24613
To cite this version:
Fabre, Jean-François and Cerny, Muriel and Cassen, Audrey and Mouloungui, Zéphirin Effect of methylene blue on the formation of oxidized
phospholipid vesicles. (2018) bioRxiv. 1-32. ISSN 2692-8205
Effect of methylene blue on the formation of oxidized phospholipid vesicles
Abstract
1
Soybean phosphatidylcholine, which is rich in linoleic acid, was oxidized with singlet oxygen 2
through photosensitization with methylene blue. This compound facilitates the oxidation of 3
phospholipids relative to the reaction with free unsaturated fatty acids. A response surface 4
methodology was used to control oxidation, with methylene blue concentration and the 5
amount of available air as independent variables. The conjugated diene-to triene ratio was 6
then monitored. Hydroperoxide yield dependent principally on the amount of air, whereas 7
photosensitizer concentration strongly influenced the size and zeta potential of vesicles 8
formed by the sonication of oxidized phospholipids in water. Methylene blue plays an 9
important role in the surface charge expression and ion permeability of these vesicles. 10
Keywords: Methylene blue, phospholipids, singlet oxygen, oxidation, liposomes, zeta 11
potential, permeability, soybean 12
1. Introduction 14
Phospholipids were initially considered to be a by-product of oil refining. However, over 15
time, these amphipathic molecules have become essential components of food, cosmetic and 16
pharmaceutical formulations. Their organization as liposomes in water confers considerable 17
added value for drug encapsulation and delivery(1–3). The size, shape and permeability of 18
liposomes depend strongly on the nature and composition of the phospholipids they contain. 19
For example, liposomes formed with phosphatidylcholine (PC), the most abundant 20
phospholipid in animals and plants, are generally larger than those formed with 21
phosphatidylethanolamine(4). The nature of the fatty acids is also of great importance. 22
Saturated fatty acids form more compact membranes that are generally less permeable for 23
some compounds than the equivalent unsaturated fatty acids(5–7) but, for some ions, the 24
membranes formed with unsaturated fatty acids are less permeable than those formed with 25
saturated fatty acids(8). Long fatty acid chains generally result in lower permeability to 26
ions(9, 10). Phospholipid oxidation, which occurs at double bonds, can have several effects. 27
Oxidation can stimulate lipid flip-flop within the membrane(11,12), and oxidized liposomes 28
are generally considered more permeable to water (13,14), glucose(15) and dextran(16). High 29
levels of oxidation can also lead to pore formation (17,18,19), and membrane disruption, 30
mostly due to the presence of shortened carboxyacyl units (20), as hydroperoxides cause less 31
damage. However, all these features are heavily dependent on the nature and concentration of 32
the oxidized compounds and it is thus essential to control oxidation, to modify the hydrophilic 33
and permeation properties of these liposomes as desired. Soybean seeds are one of the most 34
widely used sources of commercial phospholipids. Phosphatidylcholine is the principal 35
soybean phospholipid. Its fatty acid chains are mostly unsaturated (oleic, linoleic, linolenic 36
acids), making it a good model for oxidation studies. A number of different methods are 37
available for oxidizing soybean phospholipids(21, 22) but the use of singlet oxygen is a 38
simple and powerful approach. This method generally involves the disproportionation of 39
hydrogen peroxide to generate singlet oxygen, and the use of molybdate as a catalyst (23, 24). 40
However, a photosensitizer can also be used, and this method is often used with fatty acids or 41
phospholipids. Various dyes can be used for this purpose, including protoporphyrin IX (25), 42
rose bengal (26), pheophorbide (27) and methylene blue (MB), one of the most widely used 43
photosensitizers (28–32). Under illumination, the methylene blue cation reaches an excited 44
singlet state. As a conjugated dye containing a single sulfur as a ring heteroatom, it can 45
undergo efficient intersystem crossing to reach a triplet state with a relatively long lifetime. 46
Photooxidation can then occur through two possible mechanisms. In type II mechanisms, 47
triplet oxygen reacts with MB through an energy transfer process to form singlet oxygen, 48
while the methylene blue returns to its fundamental level (33, 34). Singlet oxygen, which is 49
highly electrophilic, generates hydroperoxides on reaction with unsaturated chains. In type I 50
mechanisms, MB reacts with the substrate via electron transfer to form radicals. 51
Hydroperoxides are generally formed first, through a type II mechanism, which is then 52
followed by a type I mechanism (35). However, the contribution of methylene blue is often 53
limited to the production of singlet oxygen, and this compound is generally removed from the 54
reaction medium for the purification of oxidized products. To our knowledge, its possible 55
contribution to the formation and properties of vesicles has hardly been explored. 56
2. Materials and methods 57
Methylene blue trihydrate, linoleic acid (>99%), linolenic acid (>99%), and oleic acid (99%), 58
for use as analytical reactants and standards, were purchased from Sigma Aldrich (St Quentin 59
Fallavier, France). Soybean lecithin (ca. 90% phosphatidylcholine) was purchased from VWR 60
(Fontenay sous Bois, France). Dilinoleylphosphatidylcholine (>99%) was purchased from 61
COGER (Paris, France) 62
Chemical analysis 63
The fatty acid profile of the phospholipids was determined after trans-methylation with 64
TMSH (0.2 M trimethylsulfonium hydroxide in methanol) according to AFNOR Method NF 65
EN ISO 12966-3. The fatty acid methyl esters (FAME) obtained by this transesterification 66
reaction were analyzed with a gas chromatograph (36) equipped with a CP-select CB column 67
(50 m long, 0.32 mm i.d., 0.50 µm film thickness); helium was used as the carrier gas, at a 68
flow rate of 1.2 mL/minute; the split injector (1:100) and FID were maintained at 250°C ; the 69
initial oven temperature was set to 185°C for 40 minutes, increased to 250°C at a rate of 70
15°C/minute and maintained at this temperature for 10 minutes. 71
NMR experiments were carried out on a Bruker AVANCE III HD NMR spectrometer 72
operating at 500.13 MHz for 1 h. This machine was equipped with a 5 mm BBFO ATMA 73
Prodigy cryoprobe. This cryoprobe enhances the probe sensitivity at room temperature by a 74
factor of 2 to 3 for X-nuclei from 15N to 31P. NMR experiments were recorded at 298 K, 75
with the zgig30 pulse sequence. The recycle delay was adjusted to 2 s and the number of 76
scans was set to 16. Topspin 3.2 software was used for data acquisition and processing in all 77
NMR experiments. 78
The conjugated dienes and trienes generated by phospholipid oxidation were characterized by 79
spectrophotometry with a SHIMADZU UV1800 spectrophotometer, in quartz cuvettes. The 80
reference cuvette contained absolute ethanol. The contribution of methylene blue to the 81
absorbances at 233 nm and 290 nm was ignored. 82
Photosensitization 83
Solutions of different concentrations of methylene blue in absolute ethanol were prepared in 84
amber bottles and stored in the dark. Phospholipids were dissolved in these solutions at a 85
concentration of 20 mg/mL, and the resulting solutions were illuminated for eight hours in 20 86
mL glass tubes (diameter: 15 mm) with an ATLAS SUNTEST CP+ device equipped with a 87
1500 W xenon lamp simulating a spectral distribution close to that of natural sunlight. 88
Size and zeta potential measurements 89
The size and zeta potential of phospholipid vesicles were analyzed with a NANOSIZER ZS 90
granulometer (Malvern). A 1 mL sample of the 20 mg/mL phospholipid solution in absolute 91
ethanol was dried under nitrogen. The resulting film was diluted in 2 mL of distilled water 92
and sonicated for 3 minutes with a laboratory ultrasound probe (SONICS VIBRACELL -500 93
equipped with a 3mm diameter probe, pulsation mode : 5 s ON/10 s OFF, amplitude: 57 94
µm/20%). The temperature was allowed to stabilize at 25°C for one minute, and 95
measurements were performed three times, considering a refractive index for the lipid bilayer 96
of 1.45 (37) and an absorption factor of 0.001. A backscattering detector was positioned at 97
173°. Zeta potential values were obtained by correlating mobility measurements with the 98
Smoluchowsky model. 99
Permeation studies 100
If the solute concentration differs between the phase within vesicles and the external phase, 101
then there is an osmotic pressure exerts at both sides. Vesicles may undergo water or salt 102
permeation to equilibrate this pressure. If selective, this permeation leads to a change in 103
volume. For example, volume decreases if the vesicle rejects water to increase its internal 104
solute concentration, or increases if the vesicle accepts water to decrease its internal solute 105
concentration. Absorbance measurements are a good tool for measuring such changes, 106
provided that they occur rapidly. Indeed, the absorbance of a stable dispersed medium is 107
highly dependent on the refractive index of the dispersed particles, their concentration and 108
their size. For a given refractive index and vesicle concentration, the change in absorbance is 109
related to changes in size and, thus, to the exchanges of water and solutes between the 110
vesicles and the surrounding medium. 111
According to Mie theory of light scattering (38), for a given refractive index, solutions of 112
nanometric particles (10-100 nm) scatter much less light than solutions of micrometric 113
particles, and have a lower light extinction value. The initial absorbance of vesicle solutions 114
(before the occurrence of osmotic changes) may, therefore, be directly linked to vesicle size. 115
It is difficult to measure absorbance at the precise time at which the vesicle suspension is 116
dispersed in the medium. The absorbance reached at equilibrium (or at infinite time) is 117
therefore more usually measured. This approach also has the advantage that the delayed 118
absorbance variation generally reflects a more precise equilibration of osmotic pressures. 119
Decreases in absorbance have generally been linked to a global swelling, whereas shrinkage is 120
accompanied by an increase in absorbance (6, 39).
121
The variation of absorbance can be modeled with an exponential law (see supporting 122
information): 123
A = Ainf + A.exp(-k.t)
124
Where Ainf is the absorbance at infinite time, A is the change in absorbance between the
125
initial measurement and infinite time, and k is a constant. 126
The swelling and shrinkage of phospholipid structures in hypertonic solutions were, therefore, 127
measured with a Spectrostar NANO spectrophotometer, at a fixed temperature of 25°C, in 128
polypropylene cuvettes. Kinetic measurements of extinction at 400 nm were performed at 129
five-second intervals. 130
Response surface methodology 131
The experiment was designed and analyzed with NEMRODW 2000 (Mathieu D, Nony J, 132
Phan-Tan-Luu R. NEMROD-W software. LPRAI; Marseille: 2000). 133
The experimental values were regressed with a second-order polynomial model: 134
Yk =𝑏0+ ∑ 𝑏𝑖 𝑖𝑋𝑖,𝑘 + ∑ 𝑏𝑖 𝑖𝑖𝑋𝑖,𝑘2 + ∑ ∑𝑖 𝑗≠𝑖𝑏𝑖𝑗𝑋𝑖,𝑘𝑋𝑗,𝑘
135
Where Yk is the calculated response value in the kth experiment, Xi,k is the coded variable i for
136
the kth experiment, b0 is the intercept term, bi is the main coefficient for each variable, bii is the
137
squared coefficient and bij is the interaction term. The pertinence of the model was assessed
138
with the Fisher-Snedecor test, comparing model and residual variances, and its validity (or 139
descriptive importance) was determined by comparing the residual and experimental 140
variances (see supplementary information). A proba.1 value below 5 was considered to 141
indicate pertinence of the model (at a 95% confidence level). A proba.2 value below 5 was 142
interpreted as indicating that the model did not describe the observed values (little chance that 143
any deviation from the model could be explained by the experimental error). Measurements 144
were also performed for test points, to assess the predictive value of the model in the 145
experimental domain. 146
3. Results and Discussion 147
3.1. Fatty acid distribution and oxidation 148
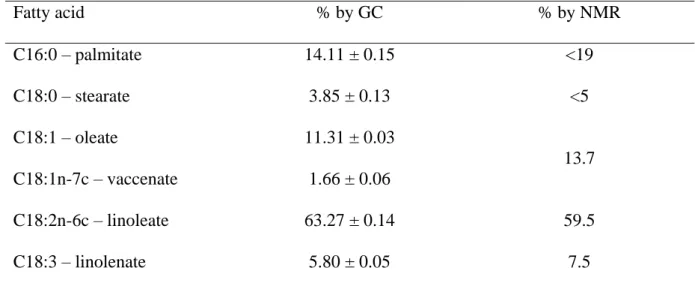
The fatty acid distribution of soybean phosphatidylcholine can be obtained both by 1H NMR 149
analysis (40,41) on intact phospholipids and by GC after transmethylation. NMR analysis is 150
based on the different chemical shifts between the terminal methyl, allyl and alkene 151
hydrogens of oleic, linoleic and linolenic acids. It is more difficult to determine the 152
composition of saturated acids by this method, which is therefore used mostly to determine 153
unsaturated fatty acid content. The two methods gave similar results for unsaturated fatty acid 154 composition (table 1). 155 Fatty acid % by GC % by NMR C16:0 – palmitate 14.11 ± 0.15 <19 C18:0 – stearate 3.85 ± 0.13 <5 C18:1 – oleate 11.31 ± 0.03 13.7 C18:1n-7c – vaccenate 1.66 ± 0.06 C18:2n-6c – linoleate 63.27 ± 0.14 59.5 C18:3 – linolenate 5.80 ± 0.05 7.5
Table 1. Fatty acid distribution of soybean phosphatidylcholine according to GC and 1H NMR 156
analyses 157
NMR cannot distinguish between oleate and vaccenate. The results obtained indicate that the 158
principal fatty acids of soybean PC were linoleic, palmitic, then oleic and linolenic acids. The 159
fatty acids of this molecule are, therefore, mostly polyunsaturated. 160
The oxidation of soybean PC was further investigated by preparing solutions of free linoleic, 161
linolenic, and oleic acids and soybean PC, at a concentration of 20 mg/mL, in absolute 162
ethanol. A 10 mL sample of each solution was poured into a 20 mL glass tube, which was 163
then hermetically sealed. The tube was then illuminated for 8 hours, and NMR analysis was 164
performed on the products. The oxidation of linoleic, linolenic and oleic acids was 165
characterized by the appearance of peaks (fig. 1) between 4 and 4.5 ppm (CH-OOH) , 5.4 and 166
6.5 ppm (conjugated double bonds) and 11 and 11.5 ppm (-OOH)(42,43,44), as shown in the 167
supplementary information. 168
The various hydroperoxide signals can be integrated to determine the formation yield. As for 169
fatty acids (table 2), similar integration results were obtained if we considered both hydrogens 170
of the hydroperoxide group (-CHOOH). The protons carried by the carbon in soybean 171
phospholipids are partially screened by peaks corresponding to the polar phosphocholine 172
moiety. Only the hydrogens corresponding to linoleic acid are visible. Integration is therefore 173
best performed with the hydrogen carried by the oxygen (–CHOOH). 174
Knowing the composition of the phospholipid tested, which consisted of 80% unsaturated 175
fatty acids, we can calculate that, if one hydroperoxide per unsaturated chain is considered, 176
the maximum amount of hydroperoxide in one molecule of phospholipid would be 1.6. For 177
soybean phospholipid, the hydroperoxide yield can, therefore, be expressed as: 178
Y = 100×𝐼𝑁𝑇 (𝑂𝑂𝐻)1.6 where INT(OOH) is the integration value for OOH/molecule. 179
Oxidized substrate
CH-OOH CH-OOH Yield
Chemical shifts (ppm) Integration Chemical shifts (ppm) Integration 100 × 𝐼𝑁𝑇(𝑂𝑂𝐻) 𝑀𝐴𝑋𝑡ℎ(𝑂𝑂𝐻) Oleic acid 4.04 , 4.09 0.14 , 0.02 11.2 0.14 14 % Linoleic acid 4.13 , 4.22 0.05 , 0.05 11.2-11.4 0.12 12 %
Linolenic acid 4.03 – 4.30 0.14 11.3-11.4 0.14 14 %
Soy PC 4.13, 4.22 0.24 , 0.27 11.3-11.6 0.66 40 %
Table 2. Hydroperoxide yield according to 1H NMR analysis 180
Yields were similar and low for the three unsaturated fatty acids (table 2), whereas soybean 181
phospholipid was much more oxidized. The oxidation of linoleic and linolenic acids can also 182
be monitored by spectrophotometry. Hydroperoxide generation leads to the formation of 183
conjugated double bonds the absorbance of which can be monitored over time. Conjugated 184
dienes absorb at 230-235 nm, whereas conjugated trienes absorb at 270-275 nm. The 185
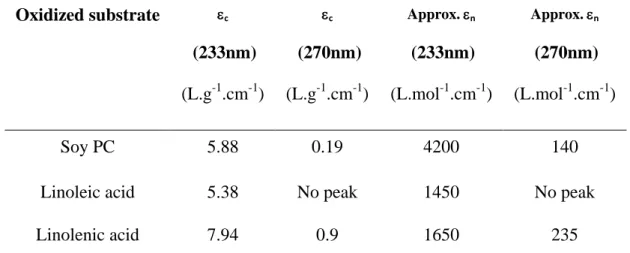
absorbances of the phospholipid solutions were measured at different dilutions, to obtain the 186
extinction coefficient with the Beer-Lambert formula: 187
A = ncn.l or A= mcm.l regardless of whether molar concentration or mass concentration is
188
considered. 189
n is the molar extinction coefficient (L.mol-1.cm-1), cn is the molar concentration (mol.L-1), l
190
is the path length (cm) in the solution, m is the mass extinction coefficient (L.g-1.cm-1), and cm
191
is the mass concentration (g.L-1). For the comparison of molar extinction coefficients (table 192
3), an approximate molecular weight of 782 g/mol was chosen for soybean 193
phosphatidylcholine, corresponding to the molecular weight of dilinoleylphosphatidylcholine. 194 Oxidized substrate c (233nm) (L.g-1.cm-1) c (270nm) (L.g-1.cm-1) Approx. n (233nm) (L.mol-1.cm-1) Approx. n (270nm) (L.mol-1.cm-1) Soy PC 5.88 0.19 4200 140
Linoleic acid 5.38 No peak 1450 No peak
Linolenic acid 7.94 0.9 1650 235
Table 3. Extinction coefficients of soybean PC and its polyunsaturated fatty acid constituents 195
Despite their similar hydroperoxide yields, oxidized linolenic acid had a higher extinction 196
coefficient than linoleic acid at 233 nm, which can be explained by the larger number of 197
unsaturated bonds, resulting in a larger number of positions at which conjugated dienes can be 198
produced in linolenic (positions 9, 12, 13, 16) than in linoleic (positions 9 and 13) acids. 199
Soybean phospholipid had a higher mass extinction coefficient than linoleic acid, and a molar 200
extinction coefficient more than twice those of linoleic and linolenic acids. Its extinction 201
coefficient at 270 nm was also less than half that of linolenic acid, with linolenic acid 202
accounting for less than 10% of its composition. Soybean phospholipid is, thus, much more 203
easily oxidized than its constitutive unsaturated fatty acids, consistent with the NMR results. 204
Methylene blue may, therefore, have a higher affinity for phospholipids than for fatty acids. 205
3.2. Response surface methodology 206
Singlet oxygen production depends principally on the amount of photosensitizer and available 207
triplet oxygen, provided that the samples are sufficiently illuminated. It was decided to work 208
with air rather than pure oxygen, to obtain a procedure that was both simplified and scalable. 209
For a constant temperature of 25°C, a change in the relative humidity of the air of less than 210
10% during sample tube filling and a constant atmospheric pressure, the oxygen content of air 211
can be considered stable and the amount of oxygen in the sample tubes is linearly correlated 212
with the volume of available air. Using the highest illumination power available, >750 W/m² 213
in the range 300-800nm, and limiting the duration of illumination to eight hours, the 214
photosensitizer concentration and the volume of the sample solution in the sealed tube were 215
varied, to modify the amount of air available. Phospholipid concentration was maintained at 216
20 mg/mL. The aim was determine whether several valuable responses could be described 217
qualitatively and/or quantitatively within a large domain of variations. Five values of log 218
(1/V) were chosen for the volume (V) of the phospholipid solution, and three values of log(C) 219
for the concentration of methylene blue. 220
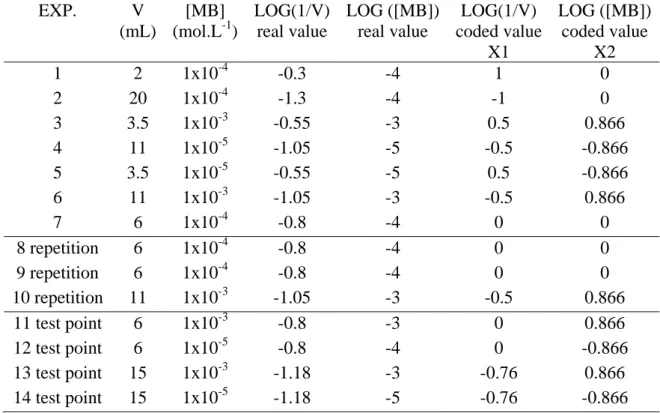
A Doehlert matrix was used, with seven minimal experiments, two repetitions at the center of 221
the domain, one additional repetition and four test points at different coordinates (table 4). 222 EXP. V (mL) [MB] (mol.L-1) LOG(1/V) real value LOG ([MB]) real value LOG(1/V) coded value X1 LOG ([MB]) coded value X2 1 2 1x10⁻⁴ -0.3 -4 1 0 2 20 1x10⁻⁴ -1.3 -4 -1 0 3 3.5 1x10⁻³ -0.55 -3 0.5 0.866 4 11 1x10⁻⁵ -1.05 -5 -0.5 -0.866 5 3.5 1x10⁻⁵ -0.55 -5 0.5 -0.866 6 11 1x10⁻³ -1.05 -3 -0.5 0.866 7 6 1x10⁻⁴ -0.8 -4 0 0 8 repetition 6 1x10⁻⁴ -0.8 -4 0 0 9 repetition 6 1x10⁻⁴ -0.8 -4 0 0 10 repetition 11 1x10⁻³ -1.05 -3 -0.5 0.866 11 test point 6 1x10⁻³ -0.8 -3 0 0.866 12 test point 6 1x10⁻⁵ -0.8 -4 0 -0.866 13 test point 15 1x10⁻³ -1.18 -3 -0.76 0.866 14 test point 15 1x10⁻⁵ -1.18 -5 -0.76 -0.866
Table 4. Extended Doehlert matrix for controlled singlet oxygen oxidation 223
An additional 6 mL sample of solution with a methylene blue concentration of 1x10⁻⁴ M was 224
covered with a sheet of aluminum foil to block out the light as a control, and another control 225
consisted of methylene blue in ethanol alone. The color of these two control samples was 226
unchanged after 8 h in simulated sunlight, indicating that the methylene blue was not 227
degraded in these conditions. By contrast, the blue color of all the other samples in the 228
experimental design decreased, indicating a degradation of the methylene blue in the presence 229
of light, oxygen and phospholipids. 230 Exp. X1 X2 Yield obs. Yield pred. 233 obs. 233 pred. 233/270 obs. 233/270 pred. Z obs. Z pred obs. pred. Ainf obs. Ainf pred. % % L.g-1.cm-1 L.g-1.cm-1 nm nm mV mV 1 1 0 63.13 69.21 13.89 15.00 27.54 27.86 146 141 -0.03 -6.13 0.114 0.113 2 -1 0 26.25 20.17 5.20 4.10 15.96 15.64 338 342 4.08 10.18 0.409 0.410 3 0.5 0.866 60.63 54.55 15.91 14.81 16.17 15.85 126 130 5.24 11.34 0.138 0.193 4 -0.5 -0.866 30.63 36.71 4.54 5.65 28.59 28.91 523 518 2.54 -3.56 0.253 0.252 5 0.5 -0.866 43.13 43.96 6.74 5.64 27.71 27.39 308 312 2.55 8.65 0.190 0.191 6 -0.5 0.866 2.50 5.86 3.24 3.89 1.98 2.11 134 126 47.60 39.85 0.362 0.376
7 0 0 43.75 43.96 9.02 8.81 29.77 32.31 228 237 4.31 3.54 0.163 0.161 8 0 0 45.00 43.96 8.70 8.81 32.80 32.31 248 237 3.33 3.54 0.166 0.161 9 0 0 43.13 43.96 8.72 8.81 34.36 32.31 236 237 2.97 3.54 0.155 0.161 10 -0.5 0.866 3.13 5.86 3.44 3.89 1.91 2.11 122 126 38.20 39.85 0.391 0.376 11 0 0.866 26.25 30.02 8.23 9.17 4.25 11.62 96 127 26.00 25.97 0.169 0.233 12 0 -0.866 40.00 36.70 6.21 5.46 29.71 30.79 284 414 -1.72 2.92 0.231 0.197 13 -0.76 0.866 0.63 -6.57 2.64 1.30 1.52 -4.93 122 126 42.50 46.77 0.546 0.470 14 -0.76 -0.866 16.25 36.86 2.72 5.89 20.06 25.85 360 573 -2.30 -7.23 0.414 0.300
Table 5. Observed and predicted values for the various dependent variables measured. 231
3.2.1. Yield and extinction coefficients 232
The hydroperoxide yield for all experiments was determined by integrating the NMR signals 233
corresponding to hydroperoxide (-OOH). The analysis of variance yielded a Proba.1 value 234
<0.01, indicating that the regression was highly significant (confidence level of 99.9%). 235
However, a comparison of repeat experiments (table 5) revealed a small experimental error 236
that was insufficient to account for the difference between the experimental and calculated 237
values (Proba.2 =0.041). The model can provide qualitative information. An examination of 238
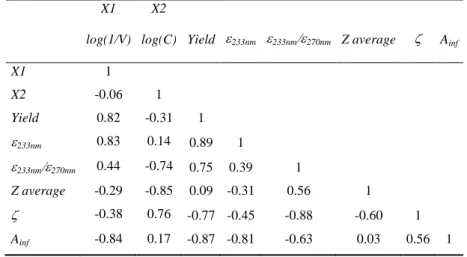
the different values of the experimental points (fig. 2a) and the correlation table (table 6) 239
clearly showed that yield was strongly dependent on the first factor, log(1/V). 240
X1 log(1/V)
X2
log(C) Yield 233nm 233nm270nm Z average Ainf
X1 1 X2 -0.06 1 Yield 0.82 -0.31 1 233nm 0.83 0.14 0.89 1 233nm270nm 0.44 -0.74 0.75 0.39 1 Z average -0.29 -0.85 0.09 -0.31 0.56 1 -0.38 0.76 -0.77 -0.45 -0.88 -0.60 1 Ainf -0.84 0.17 -0.87 -0.81 -0.63 0.03 0.56 1
Table 6. Coefficients of correlation between different variables. 241
The best yields were obtained at intermediate concentrations of methylene blue and with low 242
solution volumes. 243
It was therefore important to determine whether monomer/dimer/trimer ratios were affected 244
by high methylene blue concentrations. Several authors have suggested that dimer and trimers 245
can be determined from different absorption bands. However, a UV/visible light spectrum 246
analysis for different concentrations of the dye in ethanol (see supplementary information) 247
showed that the ratios of absorption at 654 nm to absorption at 616 nm and 490 nm did not 248
decrease with methylene blue concentration, as reported for methanol (45) but contrary to 249
what is generally observed in water (46). Thus, dimer formation is not favored by high 250
concentrations of methylene blue. In the presence of oxygen and phospholipids, methylene 251
blue gradually loses its color in visible light, resulting in a completely colorless solution. 252
However, at high methylene blue concentrations and large solution volumes, the methylene 253
blue was degraded only very slightly, with absorbance values remaining high from 220 nm to 254
340 nm (UV) and from 540 to 700 nm. For absorbance at 654 nm (characteristic wavelength 255
of methylene blue illumination for singlet oxygen generation) and different path lengths, 256
99.9% of the light at this wavelength was found to have been absorbed after a path length of 257
only 1 mm, so almost 90% of the sample received no illumination (see supplementary 258
information). 259
Similar qualitative behavior was observed for the mass extinction coefficient at 233 nm 260
(Proba.1 < 0.01, Proba.2 =0.059), the two responses being highly correlated (table 6). Indeed, 261
the presence of conjugated dienes is directly related to the amount of hydroperoxide formed 262
(fig. 2b). This amount did not decrease within the limits of the experimental design, implying 263
that conjugated dienes were not significantly degraded through oxidative scission. 264
For comparison, the unilluminated sample (covered with a sheet of aluminum foil) had a low 265
extinction coefficient (0.279 L.g-1.cm-1). 266
3.2.2. Extinction coefficient ratio 267
The ratio of extinction coefficients at 233 nm/270 nm was described by the model with a 268
better validity than extinction at 233 nm (Proba.1 = 0.033, Proba.2 = 71.9) and its behavior 269
was different (fig. 3). The equation with coded values for log(1/V) and log(C) can be written: 270
233nm/270nm = 32.31 + 6.11xlog(1/V) - 11.07xlogCMB - 10.56x[log(1/V)]² - 14.81x[logCMB]² +
271
8.81xlog(1/V)xlogCMB
272
R² = 0.991 273
The model could therefore be considered valid for the experimental points used to determine 274
the coefficients, but it was also necessary to check the test points (table 5). 275
The results for the test points indicated that low extinction ratios displayed greater deviations 276
from the model, and two calculated values (experiments 11 and 13) were significantly 277
different from the experimental values. The model was found to have a high descriptive and 278
moderate predictive value. 279
The equation confirms that the extinction ratio is inversely correlated with methylene blue 280
concentration (see also table 6). Extinction at 270 nm can be considered characteristic of 281
conjugated trienes, and the change in extinction ratio from poorly to strongly oxidative 282
conditions indicates that these molecules are readily obtained in extreme conditions, with the 283
lowest ratio obtained for a low air volume and high methylene blue concentration. It could be 284
hypothesized that, as only the methylene blue close to the surface is illuminated, these 285
conditions result in a high concentration of singlet oxygen in a small volume. Surface 286
phospholipids are, thus, strongly oxidized, whereas molecules located at deeper positions in 287
the solution are not. Increasing oxygen levels result in greater methylene blue degradation, 288
resulting in the gradual illumination of the entire sample and a homogenization of oxidation 289
mechanisms. 290
Size and zeta potential of vesicles 291
The size of the vesicles formed was determined by drying 1 mL of the phospholipid solution 292
under N2, adding 2 mL of deionized water and sonicating the sample for three minutes in
293
pulse mode (5 s ON/10 s OFF). Vesicles were then analyzed by measuring dynamic light 294
scattering (DLS) (table 5). 295
The Z-average value gives the intensity-weighted harmonic mean size. As this variable was 296
the most stable (see supplementary information), it is selected as the response variable. In 297
terms of mean size, structures smaller than 10 nm across were measured, which may have 298
resulted from the association of a very small number of phospholipids. Based on the size 299
ranges obtained, ultrasonication seems to generate mostly small unilamellar liposomes (47). 300
The statistical analysis showed that the model obtained for Z-average size was both 301
significant (Proba.1 < 0.01) and valid (Proba.2 =31.9) . 302
The equation for the Z-average size of vesicles was: 303
= 237– 101xlog(1/V) – 166xlogCMB +4x[log(1/V)]² + 45x[logCMB]² +
304
121xlog(1/V)xlogCMB
305
R² = 0.997 306
Mean size was not correlated with yield, but was inversely correlated with methylene blue 307
concentration (table 6), as small vesicles were obtained at high methylene blue 308
concentrations, even with only low levels of oxidation. The large decrease in average size 309
with increasing methylene blue concentration and phospholipid solution volume can be 310
deduced from the equation and observed on the response surface (fig. 4). 311
However, due to the instability of some vesicle solutions, the test points gave values either 312
lower than those calculated by the model. The smaller size of the vesicles in oxidized samples 313
may result from mechanical destabilization of the vesicles due to oxidation (48), leading to a 314
partial rupture of vesicles, but it may also indicate that membrane formation requires less 315
energy with oxidized than with native phospholipids. Indeed, increasing the polarity of the 316
fatty acid chains of phospholipids decreases the interaction energy between water and 317
phospholipids. At high concentrations of methylene blue, the volume of solution had a lesser 318
effect. Even if the volume of air is small, a high concentration of methylene blue allows the 319
formation of small vesicles. Despite its presence at a molar concentration well below that of 320
phospholipids (1 mM << ~25 mM), methylene blue may make a non-negligible contribution 321
to the surface properties of vesicles. As this compound is positively charged, a measurement 322
of the zeta potential of the vesicle solutions is likely to be informative. 323
Zeta potential can be related to the surface charge of vesicles. The analysis of variance 324
revealed the experimental design to be highly significant (Proba.1 =0.867), whereas the 325
validity of the quadratic model was slightly low (Proba.2 =3.46). 326
If the membrane surface consisted solely of the polar heads of phospholipids, then low, 327
mostly negative zeta potentials would be observed, as for vesicles formed without methylene 328
blue and with unoxidized soybean PC only (zeta potential of -8.66 ± 0.42 mV N=3). The 329
negativity of the zeta potential in this context is accounted for by the more favorable exposure 330
of the phosphate group than of the choline group (49, 50). When methylene blue is present at 331
a high concentration, without consumption due to a high oxygen level, then zeta potential is 332
positive (fig. 5). This potential can reach values of more than 40 mV and can therefore induce 333
strong electrostatic repulsions between vesicles, limiting aggregation, potentially accounting 334
for the smaller sizes observed. Zeta potential is negative when methylene blue concentration 335
is high but solution volume is low, due to the consumption of methylene blue. Indeed, the 336
degradation of methylene blue under oxidative conditions leads to a loss of its charge (51, 52). 337
This strong contribution of methylene blue to zeta potential, as confirmed by the high 338
correlation coefficient (table 6), results in its positioning at the surface of vesicles, close to the 339
phospholipids, accounting for its preferential reaction with phospholipids rather than with 340
fatty acids. As a cationic molecule, methylene blue adsorbs onto the zwitterionic surface and 341
may change the orientation of the P-N dipole, tilting it away (53). This may increase the 342
expression of the positive charge carried by the choline group. More surprisingly, positive 343
zeta potentials were also observed in the presence of low methylene blue concentrations and 344
small solution volumes. In small volumes, methylene blue is totally degraded and zeta 345
potential depends principally on the conformation of the phosphatidylcholine group. The 346
orientation of the phosphocholine group at the membrane surface may depend on ionic 347
strength(50). Conductivity increases with increasing methylene blue concentration (from 348
about 0.01 mS/cm to 0.1 mS/cm), but the anionic charge on phosphatidyl groups should be 349
more strongly expressed at low concentrations. Oxidation allows more polar fatty acid chains 350
to move toward the external aqueous phase (54, 55), potentially interacting with anionic 351
phosphate groups. Hydroperoxidized fatty acid chains seem to remain in the membrane core 352
(56). Thus, in the absence of photosensitization, oxidation may generate more diverse 353
products interacting preferentially with the phosphate group. 354
3.2.3. Permeation studies 355
KCl is a salt known to permeate liposomes less efficiently than water (10). Changes in the 356
size of liposomes formed from unoxidized phospholipids are therefore more likely to be due 357
to water fluxes than to the movement of KCl. When a solution of vesicles formed with pure 358
dilinoleylphosphatidylcholine (DLiPC) in 0.1 M KCl is dispersed in 2 M KCl, absorbance 359
initially increases considerably, due to light scattering by vesicles. The vesicles are far less 360
permeable to KCl than to water, so water efflux occurs and the vesicle shrinks. An increase in 361
absorbance is observed over recording times of more than 5 s (Abs0– Abseq. =-0.072 ± 0.001 ;
362
Abseq.= 0.585±0.028). A similar absorbance profile is obtained with soybean
363
phosphatidylcholine, but with a lower absorbance and less pronounced variation, suggesting a 364
lower permeability of these vesicles to water (see supplementary information). The main 365
barrier to permeation is generally the highest ordered section of the bilayer. Unsaturation 366
leads to lower chain-ordering values and an increase in membrane fluidity, potentially leading 367
to transient defects or pores, increasing water permeation. Soybean phosphatidylcholine cans 368
fewer unsaturated bonds and is therefore, less permeable to water (5–7). 369
The absorbance of many samples did not change significantly over the time course of the 370
permeation test, making it impossible to model the A parameter correctly. However, certain 371
types of behavior emerged. The sample corresponding to experiment 14 (tables 4 and 5) 372
oxidized with the lowest methylene blue concentration and a small volume of air, with a low 373
extinction coefficient at 233 nm and a yield (2.72 and 16.25%, respectively) similar to that for 374
soybean PC. Vesicles formed with phospholipids oxidized at the lowest methylene blue 375
concentration and a medium–high air volume mostly displayed a decrease in absorbance over 376
time (samples 4, 5 and 12), indicating swelling and an increase in KCl permeation. Samples 377
with medium-high methylene blue concentrations but low air volumes (2 and 13) formed 378
small vesicles with a high absorbance that increased over time, indicating shrinkage due to 379
water efflux. This high absorbance may also be partly due to the presence of unconsumed 380
methylene blue rather than purely the result of scattering. Phospholipids oxidized with 381
medium-high air volumes and medium-high methylene blue concentrations (samples 1, 3, 7, 382
8, 9, 11), which have had extinction coefficients at 233 nm (>8 L.g-1.cm-1), formed vesicle 383
suspensions with a low absorbance that did not vary over time, indicative of a total absence of 384
swelling/shrinkage behavior. This low absorbance can be linked to the small size of the 385
vesicles and the absence of variation may be due to the high level of membrane permeability, 386
as also observed for samples 6 and 10. This behavior, despite low hydroperoxide yields and 387
low 233 nm extinction ratios, may be due to the high concentration of methylene blue, 388
suggesting that this molecule can promote membrane permeability in the presence of low-389
level oxidation. The surface response corresponding to the final absorbance Ainf (fig. 6) can be
390
obtained, to assess the extent to which it is linked to initial vesicle size or methylene blue 391
concentration. Statistical analysis showed the model to be highly significant (Proba.1 <0.01), 392
with good validity (Proba.2 =84.1). 393
The equation determined for final absorbance was: 394
inf= 0.161 - 0.149xlog(1/V) + 0.021xlogCMB + 0.100x[log(1/V)]² + 0.071x[logCMB]² -
395
0.0102xlog(1/V)xlogCMB
R² = 0.996 397
The test points displayed only limited divergence from the calculated values, so the model 398
describes experimental values well, but also has predictive power. This predictive power 399
could be improved by increasing the degrees of freedom. The shape of the response surface 400
was different from that for vesicle size (fig. 6). Even if the positive contribution of methylene 401
blue to absorbance must be taken into account, this figure, the equation above and table 6 402
indicate that final absorbance is correlated principally with solution volume, whereas vesicle 403
size is essentially inversely correlated with methylene blue concentration. Both yield and 404
extinction coefficients are inversely correlated with final absorbance, and are therefore not 405
entirely dependent on initial size but on the hydroperoxide content of the phospholipids 406
forming the vesicle membrane, determining its ability to swell/shrink. 407
4. Conclusion 408
Methylene blue favored interaction with soybean phospholipids. Used as a tool for monitoring 409
the photosensitized oxidation of phospholipids, methylene blue could improve our 410
understanding of membrane modifications at low to medium levels of oxidation. Its influence 411
on the surface charge and size of phospholipid vesicles can be controlled through response 412
surface methods and could be used to adapt the stability and transport properties of liposomes. 413
Author Contribution section 414
J-F. F. designed and performed research, analyzed data and wrote the manuscript. 415
M. C. contributed analytical tools, analyzed data. 416
A. C. contributed analytical tools, analyzed data. 417
Z. M. designed research, analyzed data. 418
Acknowledgments 419
The authors thank the Occitanie region for financial support through the SMON-FERT 420
RECH project, grant no. 1405981. 421
The authors thank Mr. Marc Vedrenne of the University of Toulouse for assistance with NMR 422
analysis and Dr Aurélie BEAL and Prof. Roger PHAN TAN LUU from NEMRODW for 423
scientific assistance. 424
Supporting information: One file containing statistical processing tables of the experimental 425
design, details of NMR analysis, absorbance variations of methylene blue solutions with 426
concentration and path length, details of dynamic light scattering measurements and 427
permeation studies. 428
References 429
1. Allen, T.M., and P.R. Cullis. 2013. Liposomal drug delivery systems: From concept to 430
clinical applications. Adv. Drug Deliv. Rev. 65: 36–48. 431
2. Bozzuto, G., and A. Molinari. 2015. Liposomes as nanomedical devices. Int. J. 432
Nanomedicine. : 975. 433
3. Li, J., X. Wang, T. Zhang, C. Wang, Z. Huang, X. Luo, and Y. Deng. 2015. A review on 434
phospholipids and their main applications in drug delivery systems. Asian J. Pharm. Sci. 435
10: 81–98. 436
4. Akizuki, H., and T. Kaneko. 2016. Characteristics of liposomes made by 437
phosphatidylethanolamine. Biophys. J. 110: 71a. 438
5. Bittman, R., and L. Blau. 1972. Phospholipid-cholesterol interaction. Kinetics of water 439
permeability in liposomes. Biochemistry (Mosc.). 11: 4831–4839. 440
6. De Gier, J., J.G. Mandersloot, and L.L.M. Van Deenen. 1968. Lipid composition and 441
permeability of liposomes. Biochim. Biophys. Acta BBA - Biomembr. 150: 666–675. 442
7. Olbrich, K., W. Rawicz, D. Needham, and E. Evans. 2000. Water permeability and 443
mechanical strength of polyunsaturated lipid bilayers. Biophys. J. 79: 321–327. 444
8. Barton, P.G., and F.D. Gunstone. 1975. Hydrocarbon chain packing and molecular 445
motion in phospholipid bilayers formed from unsaturated lecithins. Synthesis and 446
properties of sixteen positional isomers of 1,2-dioctadecenoyl-sn-glycero-3-447
phosphorylcholine. J. Biol. Chem. 250: 4470–4476. 448
9. Blok, M.C., E.C.M. Van Der Neut-Kok, L.L.M. Van Deenen, and J. De Gier. 1975. The 449
effect of chain length and lipid phase transitions on the selective permeability properties 450
of liposomes. Biochim. Biophys. Acta BBA - Biomembr. 406: 187–196. 451
10. Paula, S., A.G. Volkov, A.N. Van Hoek, T.H. Haines, and D.W. Deamer. 1996. 452
Permeation of protons, potassium ions, and small polar molecules through phospholipid 453
bilayers as a function of membrane thickness. Biophys. J. 70: 339–348. 454
11. Kotova, E.A., A.V. Kuzevanov, A.A. Pashkovskaya, and Y.N. Antonenko. 2011. 455
Selective permeabilization of lipid membranes by photodynamic action via formation of 456
hydrophobic defects or pre-pores. Biochim. Biophys. Acta BBA - Biomembr. 1808: 457
2252–2257. 458
12. Jurkiewicz, P., A. Olżyńska, L. Cwiklik, E. Conte, P. Jungwirth, F.M. Megli, and M. 459
Hof. 2012. Biophysics of lipid bilayers containing oxidatively modified phospholipids: 460
Insights from fluorescence and EPR experiments and from MD simulations. Biochim. 461
Biophys. Acta BBA - Biomembr. 1818: 2388–2402. 462
13. Tanfani, F., and E. Bertoli. 1989. Permeability of oxidized phosphatidylcholine 463
liposomes. Biochem. Biophys. Res. Commun. 163: 241–246. 464
14. Lis, M., A. Wizert, M. Przybylo, M. Langner, J. Swiatek, P. Jungwirth, and L. Cwiklik. 465
2011. The effect of lipid oxidation on the water permeability of phospholipids bilayers. 466
Phys. Chem. Chem. Phys. 13: 17555. 467
15. Smolen, J.E., and Shohet, Stephen B. 1974. Permeability changes induced by 468
peroxidation in liposomes prepared from human erythrocyte lipids. J. Lipid Res. 15: 469
273–280. 470
16. Runas, K.A., and N. Malmstadt. 2015. Low levels of lipid oxidation radically increase 471
the passive permeability of lipid bilayers. Soft Matter. 11: 499–505. 472
17. Van der Paal, J., E.C. Neyts, C.C.W. Verlackt, and A. Bogaerts. 2016. Effect of lipid 473
peroxidation on membrane permeability of cancer and normal cells subjected to 474
oxidative stress. Chem Sci. 7: 489–498. 475
18. Itri, R., H.C. Junqueira, O. Mertins, and M.S. Baptista. 2014. Membrane changes under 476
oxidative stress: the impact of oxidized lipids. Biophys. Rev. 6: 47–61. 477
19. Mertins, O., I.O.L. Bacellar, F. Thalmann, C.M. Marques, M.S. Baptista, and R. Itri. 478
2014. Physical damage on giant vesicles membrane as a result of methylene blue 479
photoirradiation. Biophys. J. 106: 162–171. 480
20. Megli, F.M., L. Russo, and E. Conte. 2009. Spin labeling EPR studies of the properties 481
of oxidized phospholipid-containing lipid vesicles. Biochim. Biophys. Acta BBA - 482
Biomembr. 1788: 371–379. 483
21. Memoli, A., L.G. Palermiti, V. Travagli, and F. Alhaique. 1996. Studies of differently 484
induced peroxidation phenomena in lecithins. J. Agric. Food Chem. 44: 2814–2817. 485
22. Reis, A., and C.M. Spickett. 2012. Chemistry of phospholipid oxidation. Oxidized 486
Phospholipids - Their Prop. Interact. Proteins. 1818: 2374–2387. 487
23. Aubry, J.M., and B. Cazin. 1988. Chemical sources of singlet oxygen. 2. Quantitative 488
generation of singlet oxygen from hydrogen peroxide disproportionation catalyzed by 489
molybdate ions. Inorg. Chem. 27: 2013–2014. 490
24. Boehme, K., and H.D. Brauer. 1992. Generation of singlet oxygen from hydrogen 491
peroxide disproportionation catalyzed by molybdate ions. Inorg. Chem. 31: 3468–3471. 492
25. Watabe, N., Y. Ishida, A. Ochiai, Y. Tokuoka, and N. Kawashima. 2007. Oxidation 493
decomposition of unsaturated fatty acids by singlet oxygen in phospholipid bilayer 494
membranes. J. Oleo Sci. 56: 73–80. 495
26. Eisenberg, W. C.; Anand, J.; Wang, S.; Stevenson, R. J. Oxidation of 496
phosphatidylcholine membranes by singlet oxygen generated in the gas phase. 497
Photochem. Photobiol. 1992, 56 (4), 441–445. 498
27. Hackbarth, S., and B. Röder. 2015. Singlet oxygen luminescence kinetics in a 499
heterogeneous environment – identification of the photosensitizer localization in small 500
unilamellar vesicles. Photochem Photobiol Sci. 14: 329–334. 501
28. Abrahamse, H., and M.R. Hamblin. 2016. New photosensitizers for photodynamic 502
therapy. Biochem. J. 473: 347–364. 503
(29) Chacon, J. N.; McLearie, J.; Sinclair, R. S. Singlet oxygen yields and radical 504
contributions in the dye-sensitised photo-oxidation in methanol of esters of 505
polyunsaturated fatty acids (oleic, linoleic, linolenic and arachidonic). Photochem. 506
Photobiol. 1988, 47 (5), 647–656. 507
30. Terao, J., Y. Hirota, M. Kawakatsu, and S. Matsushita. 1981. Structural analysis of 508
hydroperoxides formed by oxidation of phosphatidylcholine with singlet oxygen. Lipids. 509
16: 427–432. 510
31. Jiang, J., and A. Kamal-Eldin. 1998. Comparing methylene blue-photosensitized 511
oxidation of methyl-conjugated linoleate and methyl linoleate. J. Agric. Food Chem. 46: 512
923–927. 513
32. Hilarius, P.M., I.G. Ebbing, D.W.C. Dekkers, J.W.M. Lagerberg, D. de Korte, and A.J. 514
Verhoeven. 2004. Generation of singlet oxygen induces phospholipid scrambling in 515
human erythrocytes. Biochemistry (Mosc.). 43: 4012–4019. 516
33. DeRosa, M. 2002. Photosensitized singlet oxygen and its applications. Coord. Chem. 517
Rev. 233–234: 351–371. 518
34. Nowell, N.H., H.-I. Hung, L.A. Austin, and C.L. Evans. 2016. EtNBS in photodynamic 519
therapy. In: Handbook of Photodynamic Therapy. Updates on Recent Applications of 520
Porphyrin-Based Compounds. Ravindra K Pandey , David Kessel, Thomas J. Dougherty. 521
pp. 365–380. 522
35. de Souza, R.M., P. Siani, T.F. Schmidt, R. Itri, and L.G. Dias. 2017. Methylene blue 523
location in (hydroperoxized) cardiolipin monolayer: implication in membrane 524
photodegradation. J. Phys. Chem. B. 121: 8512–8522. 525
36. Roche, J., A. Bouniols, Z. Mouloungui, T. Barranco, and M. Cerny. 2006. Management 526
of environmental crop conditions to produce useful sunflower oil components. Eur. J. 527
Lipid Sci. Technol. 108: 287–297. 528
37. Ardhammar, M., P. Lincoln, and B. Nordén. 2002. Invisible liposomes: Refractive index 529
matching with sucrose enables flow dichroism assessment of peptide orientation in lipid 530
vesicle membrane. Proc. Natl. Acad. Sci. USA 99: 15313–15317. 531
38. Mie, G. 1908. Beiträge zur Optik trüber Medien, speziell kolloidaler Metallösungen. 532
Ann. Phys. 330: 377–445. 533
39. Ghosh, P., and U.N. Singh. 1992. Liposome shrinkage and swelling under osmotic-534
diffusional stress: evaluation of kinetic parameters from spectrophotometric 535
measurements. Biochim. Biophys. Acta BBA - Biomembr. 1110: 88–96. 536
40. Knothe, G., and J.A. Kenar. 2004. Determination of the fatty acid profile by1H-NMR 537
spectroscopy. Eur. J. Lipid Sci. Technol. 106: 88–96. 538
41. Kim, W., H. Rho, Y. Hong, M. Yeom, S. Shin, J. Yi, M.-S. Lee, H. Park, and D. Cho. 539
2013. Determination and comparison of seed oil triacylglycerol composition of various 540
soybeans (Glycine max (L.)) using 1H-NMR spectroscopy. Molecules. 18: 14448– 541
14454. 542
42. Gardner, H.W., and D. Weisleder. 1972. Hydroperoxides from oxidation of linoleic and 543
linolenic acids by soybean lipoxygenase: Proof of thetrans-11 double bond. Lipids. 7: 544
191–193. 545
43. Neff, W.E., E.N. Frankel, and K. Miyashita. 1990. Autoxidation of polyunsaturated 546
triacylglycerols. I. Trilinoleoylglycerol. Lipids. 25: 33–39. 547
44. Porter, N.A., and J.S. Wujek. 1987. Allylic hydroperoxide rearrangement: Beta-scission 548
or concerted pathway? J. Org. Chem. 52: 5085–5089. 549
45. Zhao, Z., and E.R. Malinowski. 1999. Determination of the hydration of methylene blue 550
aggregates and their dissociation constants using visible spectroscopy. Appl. Spectrosc. 551
53: 1567–1574. 552
46. Morgounova, E., Q. Shao, B.J. Hackel, D.D. Thomas, and S. Ashkenazi. 2013. 553
Photoacoustic lifetime contrast between methylene blue monomers and self-quenched 554
dimers as a model for dual-labeled activatable probes. J. Biomed. Opt. 18: 056004. 555
47. Akbarzadeh, A., R. Rezaei-Sadabady, S. Davaran, S.W. Joo, N. Zarghami, Y. 556
Hanifehpour, M. Samiei, M. Kouhi, and K. Nejati-Koshki. 2013. Liposome: 557
classification, preparation, and applications. Nanoscale Res. Lett. 8: 102. 558
48. Makky, A., and M. Tanaka. 2015. Impact of lipid oxidization on biophysical properties 559
of model cell membranes. J. Phys. Chem. B. 119: 5857–5863. 560
49. Chibowski, E., and A. Szcześ. 2016. Zeta potential and surface charge of DPPC and 561
DOPC liposomes in the presence of PLC enzyme. Adsorption. 22: 755–765. 562
50. Makino, K., T. Yamada, M. Kimura, T. Oka, H. Ohshima, and T. Kondo. 1991. 563
Temperature- and ionic strength-induced conformational changes in the lipid head group 564
region of liposomes as suggested by zeta potential data. Biophys. Chem. 41: 175–183. 565
51. Dariani, R.S., A. Esmaeili, A. Mortezaali, and S. Dehghanpour. 2016. Photocatalytic 566
reaction and degradation of methylene blue on TiO2 nano-sized particles. Opt. - Int. J.
567
Light Electron Opt. 127: 7143–7154. 568
52. Houas, A. 2001. Photocatalytic degradation pathway of methylene blue in water. Appl. 569
Catal. B Environ. 31: 145–157. 570
53. Haugen, A., and S. May. 2007. The influence of zwitterionic lipids on the electrostatic 571
adsorption of macroions onto mixed lipid membranes. J. Chem. Phys. 127: 215104. 572
54. Khandelia, H., and O.G. Mouritsen. 2009. Lipid gymnastics: evidence of complete acyl 573
chain reversal in oxidized phospholipids from molecular simulations. Biophys. J. 96: 574
2734–2743. 575
55. Sabatini, K., J.-P. Mattila, F.M. Megli, and P.K.J. Kinnunen. 2006. Characterization of 576
two oxidatively modified phospholipids in mixed monolayers with DPPC. Biophys. J. 577
90: 4488–4499. 578
56. Siani, P., R.M. de Souza, L.G. Dias, R. Itri, and H. Khandelia. An overview of molecular 579
dynamics simulations of oxidized lipid systems, with a comparison of ELBA and 580
MARTINI force fields for coarse grained lipid simulations. Biochim. Biophys. Acta 581
BBA - Biomembr. 10: 2498-2511 582
Figure 1. Difference between the 1H-NMR spectra of soybean phosphatidylcholine and 584
oxidized phosphatidylcholine (the spectra have been truncated to highlight the main 585
differences between them) 586
Figure 2. a) Response surface representation for hydroperoxide yield. b) Response surface 587
representation for the extinction coefficient at 233 nm 588
Figure 3. Response surface representation for the ratio of extinction coefficients. 589
Figure 4. Response surface representation for the Z-average size of vesicles (in nm) 590
Figure 5. Response surface representation for the zeta potential of vesicles 591
Figure 6. Response surface representation for the final absorbance of vesicles 592 593 594 595 596 597
598 599
Note : Experimental points are situated in the figure with their experimental values. 601
602 603
605 606
607