a publisher's https://oatao.univ-toulouse.fr/23474
http://doi.org/10.1088/1742-6596/1243/1/012006
Al Hossen, Iman and Espinosa, Christine and Hor, Anis and Pierré, Estelle and Vilcoq, Stéphane and Chieragatti, Rémy and Montel, Thomas and Gnangnon, Oscar Experimental investigation of the repeatability of direct damage induced by lightning strikes on metallic panels. (2018) In: 15th International High-Tech Plasma Processes
Content from this work may be used under the terms of theCreative Commons Attribution 3.0 licence. Any further distribution of this work must maintain attribution to the author(s) and the title of the work, journal citation and DOI.
Published under licence by IOP Publishing Ltd 1
Experimental investigation of the repeatability of direct damage
induced by lightning strikes on metallic panels
I. Alhossen1, C. Espinosa1, R. Chieragatti1, A. Hor1, E. Pierré2, S. Vilcocq2,T. Montel1, O.
Gnangnon1
1 Institut Clément Ader ICA, Université de Toulouse, ISAE-SUPAERO, IMT MINES ALBI,
UTIII, INSA, CNRS, 3 Rue Caroline Aigle, 31400 Toulouse, France
2 DGA-Techniques aéronautiques, 47, Rue Saint-Jean, 31130 Balma, France
Abstract
Metallic parts of aircrafts that are used for fuel tanks areas or even for the fuselage can suffer from severe direct damage due to lightning strikes. Laboratory tests imitating lightning strikes follow standard regulations requirements that prescribe the current waveforms the structure must resist depending on the zone of the airplane. D+B+C* current waveforms are under concern here and are reproduced in by specific current delivery devices at DGA-Ta lightning lab. The present paper points out that in some cases, tests considered as identical from the standard regulation point of view can generate different damages in the plate, and even variability in perforation apparition. This paper proposes a damage severity index (DSI) that allows considering in an intrinsic manner the effect of the testing parameters related to the current waveform or from the sample modification. The analysis of the tests exhibits a threshold over which a critical crater occurs and the risk of perforation is maximal. We use the DSI to perform a sensitivity analysis on a small data set of lightning tests and quantify the positive or negative effects of significant current waveform or sample input parameters.
1. Introduction
One of the main safety issues facing aircrafts is the protection against lightning strikes. An airplane is struck on average one to twice a year by lightning. Usually the outer conductive metal that compose the fuselage assure the discharge of the electric energy. Naturally, metallic aircrafts are protected against current flows because of their high electrical conductivity. However, at the arc attachment location, a serious damage may happen and even it may be developed into a perforation. Such perforation in the fuel tanks or close to the energetic materials may jeopardize the safety of the aircraft and the holding of the carriers. For military aircrafts, this will result also in the cancellation of the mission, or even the loss of the aircraft. For this, studying the damage effect of lightning strikes on metallic aircrafts is of major importance.
In this context, Direction Générale de l’Armement (DGA) Techniques aéronautiques carried out different experimental tests taking into consideration all the related standards to imitate the lightning action on aeronautical metallic panels. This includes a specific current waveform prescribed by SAE as a standard lightning environment [1,2]. However, in some calibration tests for each sample type, that are made to ensure the required current waveform, different forms of damage were obtained even on the same sample panel. These forms of the damage obtained range from simple scratches into severe craters as well as perforated hollows.
Therefore, DGA Techniques aéronautiques has put in place an action plan to determine the origin of these various damage forms and more particularly to investigate the influence of the experimental parameters on these different observations as well as on the severity of each damage type. This plan covers also a better understanding of the structural interaction effects between the metallic panel and the frame and the load applied. In addition, it is
concerned about determining the circumstances behind the aggravation of the damage, taking in account the effect of the material parameters as a function of the electro-thermal load delivered.
This paper presents the work done for accomplishing the objective of this plan, which is a part of a global project financed by DGA, and done scientifically in Institut Clément Ader, through a collaborative project between the French DGA and ISAE-SUPAERO. The first aim of this project is to quantify an intrinsic manner the relation between the test configuration and the resulting damage. Indeed, the standard regulations are quite open and specify the current waveform, no matter about the testing device is set to insure it, or the sample configuration. Even though it is known that some of these parameters affect the damage [3], to the knowledge of the authors, up to now there is no damage definition that allows quantifying the effect of the input parameters of a lightning strike. In this paper, we propose a critical investigation of damage assessment and finally introduce a damage severity index (DSI). The DSI represents a stable way to quantify the damage as a monotone growing function of the risk of perforation with a coherent corresponding description of the affected matter on the front and rear faces of the sample. It is shown that this index is valid whatever the metallic sample is, in particular its thickness. Due to the difficulty and cost of each lightning test, the number of data points obtained is very small, and hence a limited number of data is available to a sensitive analysis. Starting from this, we present the different methods of sensitivity analysis and explain why we finally retain the Partial Correlation Coefficient method. Therefore, a quantitative sensitivity analysis is performed using the DSI in order to determine the influence of the parameters on the type of the damage obtained. Accordingly, the most significant parameters that have a serious role in perforating the metallic panels are revealed. This analysis is done without taking into consideration the physics behind the tests. Finally, we present a short analysis of microstructure of some representative experiments. The aim of this analysis is to investigate the limit of the DSI to take into account the complex phenomena that arises in the sample when it comes to the limit of perforation.
The paper is organized as follows. In section 2, the experimental set up of the tests performed is described; this includes explaining the experimental procedures and defining the tested parameters. In section 3, we explain why the quantitative measure of damage through the classical affected zone is not appropriate here, which leads to the introduction of the Damage Severity Index. A brief overview of sensitivity analysis is given, followed by the details of the sensitivity study done on the outcomes of the experiments as well as the results obtained. In section 4, the mechanical study of the microstructure is presented. Lastly, the paper ends up with the obtained conclusions, the perspectives for future work, and the proposed circumstances for new experimental tests.
2. Experiments
2.1. Experimental setup and standards
The tests done to study the lightning effect follow the experimental set-up described as “Arc Entry Test” in [1,2]. The general structure of this set-up is mainly composed of a jet diverter electrode situated at a typical distance of 50mm away from the square metallic panel. The panel is supported at its four sides by bolts or metallic clamps to a conductive frame that lays on a wooden table as shown in Figure 1. Samples used in this study were 300x300mm² metallic plates made of 2024-T3 aluminium or 5083-aluminum alloy of thickness either 2mm or 3mm. To ensure the safety of the process, the experimental structure should be completely placed in a testing room, which is electrically and physically isolated from the surrounding environment.
The electrode, which is a tungsten rod, is attached at its end to an insulating sphere as shown in Figure 2. The aim of using this sphere is, firstly, to avoid the formation of a jet of plasma directed from the electrode to the sample, as encountered in welding or cutting arcs, and secondly, to avoid the formation of an acoustic shock wave directed directly towards the panel [3]. An initiating fuse wire, of diameter less than 100µm, is also tied to the electrode behind the sphere and directed towards the sample, in order to breakdown the in-between air gap.
3
Figure 1. The experiment setup: the electrode directed towards the metallic panel
During the experiments, an electric current traverses the electrode, passes into the panel, which represents the negative polarity, and leaves through the conductive-grounded frame (Figure 2).
Figure 2. Schematic representation of the electrode-sample positioning
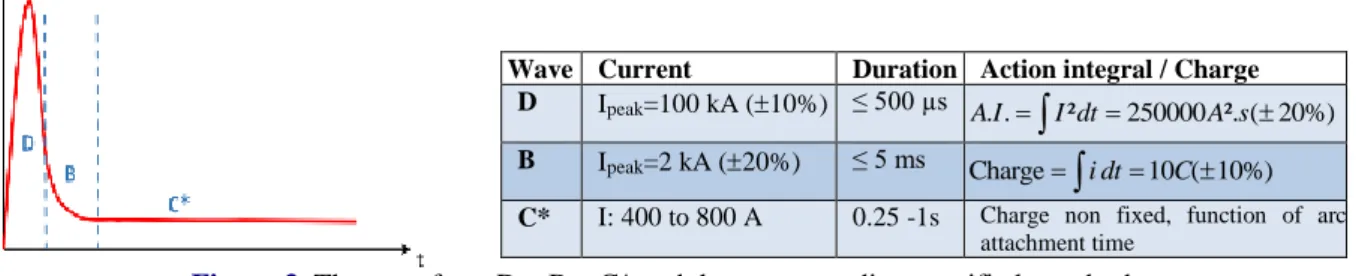
The standard norms of the current waveform used to imitate lightning in the tests is of the type D - B - C*, presented in Figure 3 and described in [1]. This type is recommended for the parts of the aircraft located in zone 2A, the zone in which the fuel storage is generally located and where the perforation is the most critical. The component
D of this waveform is a high intensity peak that reaches 100kA within few microseconds. It is followed bythe
component B, an intermediate intensity peak, and then by the component C*, a continuous waveform that can reach hundreds of Amperes with a duration of tens of milliseconds [3]. The table in Figure 3 shows the specified standards for each of these waves. In our tests the C* charge was set to 18C and its intensity was higher or equal to 400A. Most of the tests were performed with a total charge of 55C as it was a perforation threshold in a previous test campaign (MOVEA campaign done by DGA-Ta).
Wave Current Duration Action integral / Charge D Ipeak=100 kA (10%) ≤ 500 µs A I. .
I dt² 250000 ². ( 20%)A s B Ipeak=2 kA (20%) ≤ 5 ms Charge
i dt10 ( 10%)CC* I: 400 to 800 A 0.25 -1s Charge non fixed, function of arc attachment time
Figure 3. The waveform D – B – C* and the corresponding specified standards 2.2 Experimental observations
During tests, the interaction between the electric arc and the metallic plate leads to a physical damage at the level of the attachment point of the arc on the plate. After cooling, this damage appears as a deformation of the flat surface of the material in a small circular burned zone of diameter less than 17mm. A qualitative assessment of such damage is done in [3], where it is described as a spot that presents a kind of swelling with some bubbles inside. Moreover, the study ends up with the conclusion that the appeared melted area increases with the current value for a same charge transfer.
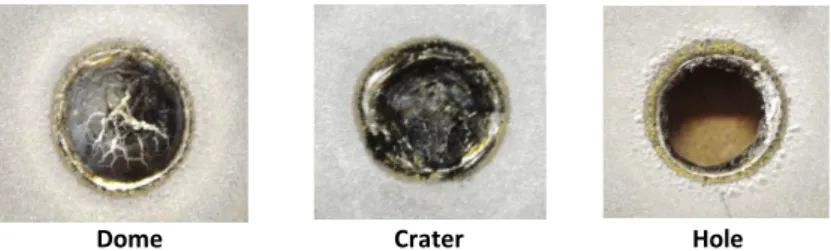
In the present case, the concern of DGA was to do calibration tests for each sample type to ensure the required D-B-C* current waveform. However, after some tests done on the same sample with the specified standards, different forms of damage are obtained with different severity levels (Dome or Crater). Accordingly, these forms of damage are classified into three main categories as shown in Figure 4. A dome represents the damage with a hill form, whereas a crater refers to the damage that has a sink effect. Lastly a hole, obtained for higher charges than those creating domes or craters, represents the case of having a perforation. This variation in the obtained damage induces the study of the influence of the experimental parameters on the severity of each damage type.
Figure 4. The three different forms of the damage obtained
Different experimental parameters may affect the damage form as the clamping conditions of the sample in the frame, the current waveform generator and even the strike position on the plate (centre, diagonal, and corner). Experimentally, DGA detected that the clamping conditions, are in fact responsible for the vibration of the sample, and that this variation is most probably related to the pulse current component D delivered by the generator. So in order to quantify the effect of the parameters related to the current generator and the plate on the damage obtained a sensitivity analysis is carried out.
3. Sensitivity analysis
Sensitivity analysis studies how the variation in the inputs of a general model affects the variation of the output. This is done by assigning a sensitivity coefficient to each input that represents its effect on the output. Thus, sensitivity analysis enables the detection of the essential input parameters that have significant influence on the output. In this study, the influence of different experimental parameters on the perforation risk and the damage obtained is to be examined. To this end, a sensitivity analysis is carried out, considering as a model the experimental process. The inputs that their effects are to be investigated are the experimental parameters. On the other hand, the output should be a quantitative representative of the severity level, for that a new quantitative assessment of the damage is proposed, called Damage Severity Index (DSI). The following sections present in details these main elements for the sensitivity study, as well as the results obtained.
3.1. The inputs: experimental parameters
Starting from the different factors that may cause the variability of the damage, a classification of the parameters of the experiments is proposed. Indeed, the experimental parameters can be categorized into three main groups according to the part of the experiment they are related to: the testing device, the waveform of the electric current, and the sample used.
In [5], the mechanical and the electrical influence of the main parameters related to the testing device have been demonstrated. The study examined the effect of the breakdown conditions related to the initiating wire by taking into account its material composition and its length. It also tested the impact of the fixing frame through two factors: the tightening torque and the number of bolts used. Therefore, in the present case, the configuration of the testing device is kept fixed during the experiments in a manner adapted to the whole setup. In [4], the effect of the growth rate dI/dt of the D-waveform on the damage obtained has been studied, and it is concluded that generally the damage has a little dependence on this rate. However, none of the effects of the other parameters related to the
5
waveform has been studies. So in this case, the intensity of each wave component as well as its duration are taken into consideration in the sensitivity study as they were varied during the calibration tests.
During the experiments, the samples are placed vertically in front of the electrode and each sample is struck several times at different locations. In addition, all the tested plates were painted from their front faces; this is due to the effect of the painting in protecting the plates against damage proved in [5]. During the calibration test, three different values for the peak of the component D were tested, ordered as D, D/2 and D/4. The effect is recorded using a high-speed video camera placed behind the plates. In this case, the rear face of the plates is spotted by white dots in order to facilitate digital image correlation. However, to detect the thermal effect of the electric strike, an infrared camera is placed behind the plates. In this context, the rear face of the plates is covered by a black painting, for which the emissivity was characterized, and a much lower intensity of the strikes is used in order to guarantee a non-perforation of the plates and consequently not harming the camera. According to the observations, this variation of the characteristics of the plate seems to affect the form of the damage. For that, the thickness of the plate, the painting on the rear face and the position of the hit are taken into account in the sensitivity study. The following table summarizes the range of variation of the parameters included in the sensitivity study according to the data of the experiments. It is important to note that the number of data was only 22 due to the cost of each test.
Table 1 The range of variation of the parameters during the tests according the data given by DGA Ta
3.2. Sensitivity analysis method
Quantitative sensitivity analysis methods have been widely developed in literature [6]. The main idea of these methods is to assign a sensitivity coefficient to each parameter reporting how much the output responds to the changes of this parameter. Hence, a sensitivity coefficient represents the importance of the associated parameter. In general, the applicability of a sensitivity analysis method depends on the characteristics of the model under study, the number of its parameters and their range of variation, and the available data.
In the present case, different challenges arise while doing a sensitivity analysis. First, the process under study is not defined explicitly by a deterministic model; rather it is represented only by a limited number of data points. In addition, the values of the parameters are preselected without following any specific sampling technique as they are constrained to different experimental settings while doing the calibration.
So in a first attempt to comprehend how each parameter influence the process, the Partial Correlation Coefficients (PCC) are computed. These coefficients provide a measure of the correlation between the output and each of the experimental parameters after removing the effect of the other parameters. Practically, if Y denotes the output of the test, and the Xi denotes one of the parameters, then the correlation coefficient of Y and Xi is computed using the formula:
2 2 ( )( ) ( , ) ( ) ( ) i i i i i X X Y Y CC X Y X X Y Y
(1)where 𝑋̅𝑖 and 𝑌̅ are the mean averages of all the values of Xi and Y, respectively. In order to compute the PCC of
Y and Xi, two new variables are introduced: 𝑋̂𝑖= 𝑎0+ ∑𝑗≠𝑖𝑎𝑖𝑋𝑖 and 𝑌̂ = 𝑏0+ ∑𝑗≠𝑖𝑏𝑖𝑋𝑖 , then the PCC of Y and
Xi is the correlation coefficient of the two variables: Y-𝑌̂ and X-𝑋̂ [6].
The values of the PCC lies between -1 and +1, where a positive value indicates that Y and Xi tend to increase or decrease together and a negative value indicates that Y and Xi tend to move in opposite directions [7]. On the other hand, if the value of the PCC is close to 0, this means that Y and Xi have a weak linear relationship, however if the value is close to -1/1 this means that the relationship is strong.
3.3. The quantitative output: Damage Severity Index (DSI)
Since the main concern of the sensitivity study is to examine the severity of the damage under the effect of different experimental parameters, an appropriate representative for this severity level is sake out. A first quantitative assessment of the damage is done by external non-destructive measurement, in which the size of the diameter of each deteriorated zone from both front and rear face is taken. Then the volume of the damaged zone is computed by inserting the values of the diameters in the following formula:
2
2 / 2 / 2 2 front rear D D V
T (2)where 𝑇 refers to the thickness of the plate. A study of the evolution of volume of the damage with respect to the charge of C* shows a linear regression, which is compatible with the results of MOVEA (see Figure 5). However, concerning the severity level, volumes of the cases of crater, are smaller than the volumes of some dome cases, even though the crater case is much more severe than the dome case. In other words, an increase in the volume of the damage does not always imply an increase in risk of perforation and the severity level.
Figure 5. Evolution of the volume with respect to the charge C*
In addition, if the volume is to be representative for the risk, it should decrease with the increase of the thickness; however, formula (1) shows the contrary. Therefore, it is insufficient to use this external representation of the damage, so the plates are cut at the central line of the damage and the internal damage profile is investigated. After cutting the plates and analysing the transversal appearance of the damage, it is concluded that if the damage is to be classified according to the severity level, in fact four different forms should be taken as shown in Figure 6. 0 100 200 300 400 500 600 0 50 100 150 200 Charge C* (C) Volume of the damage (mm3)
Dome Crater Hole
7
Figure 6. The different internal phases of the damage
Indeed, the case of having a dome only on the front face of the plate is much less risky than having domes from both faces. In addition, a crater is the level just before perforation, and which is much riskier that the case of two domes. For this, the order of the above four phases is considered as an indication of the levels of the risk.
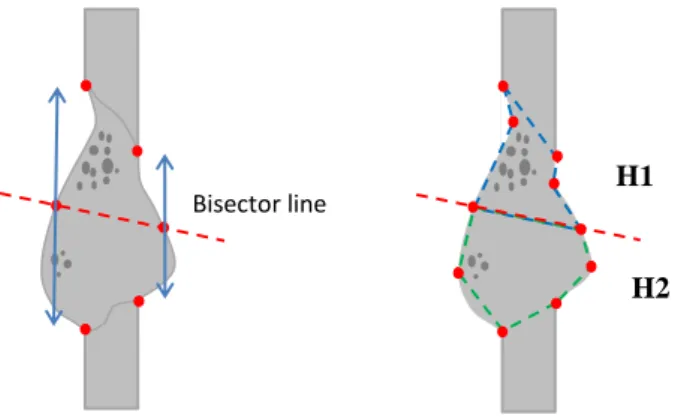
Figure 7. The sketch of the surfaces of the two zones H1 and H2
Despite the difference in the above four forms, the internal composite of the damage is roughly the same, divided into two zones. The first zone, designed as H1, at the top full of bubbles with a neck that could be reduced into perforation. The second zone, designed as H2, at the bottom with less or no bubbles, which forms the future drop by gravity. Starting from this, a new quantitative geometric assessment of the damage is done by measuring the surface of each of these zones: H1 and H2. The boundary between the two zones is drawn by connecting the midpoints of the diameters of the front and the rear face as shown in Figure 7. Then the best matching hexagon to each surface is taken, and its surface area is computed. Note that as the surface of H1 decreases, the surface of H2 increases and the risk of severity clearly increases.
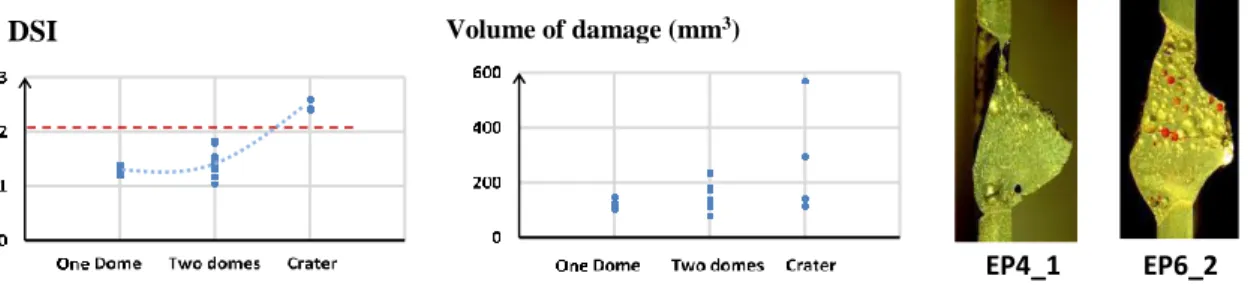
Therefore, the ratio H=H2/H1, is defined as Damage Severity Index (DSI). It is taken as a quantitative representation of the severity level of the damage. To see graphically the validity of this conclusion, consider the plots of Figure 8, which show the monotonicity of variation of the values of DSI with respect to the three phases of damage before perforation, compared to the variation of the values of the volume of damage, which is not monotone. In addition, the two cases presented in figure 8 shows the failure of the volume to express the severity
level, where the volume of damage of EP4_1 is 142 mm3 whereas the volume of the case EP6_2 is 173mm3, even
though the case EP4_1 is much more severe than EP6_2. On the other hand, the DSI of EP4_1 is 2.604 whereas the DSI of EP6_2 is 1.802. Therefore, we used DSI as an output in the sensitivity analysis where we compute the correlation coefficients of DSI with the experimental parameters prescribed in Table 1.
One dome Two Domes Crater hole (lower part)
Fro n t f ac e R ea r fac e H2 H1 Bisector line
Figure 8. The variation of the ratio H2/H1 and the volume of damage with respect to the four damage phases
3.4. Results
The bar diagram in Figure 9 presents the partial correlation coefficient obtained from the sensitivity study by taking DSI as an output.
Figure 9. The values of the Partial Correlation coefficients of the parameters
The dominating factor is the duration of C* with an impact about 0.6. In addition, the thickness of the plate has a moderate negative effect with an influence of about 0.3. Similarly, the position of the shoot from the centre of the plate has a negative effect on the risk with an impact about 0.35. Concerning the waveform B, it is difficult to conclude that it has no role on the severity even if its correlation coefficient is very small (approximately 0) since the given data of Table 1 shows a very small variation of the values of B. On the other hand, the waveform D even if it appears to have no effect on the structure of the damage, this does not neglect its effect on the vibration of the plates during experiments. The painting on the rear face was having a puff effect on the damage obtained, but as it appears its correlation coefficient is about zero, this means that it has no effect on the severity of the damage, but on the shape of the damage. Note that this sensitivity analysis is done without taking into account the physics of the process and the materials, and even the assessment of the severity level is taken after the cooling of the plates. Therefore, a complementary study is done in order to analyse the microstructure of the obtained damage, and to see how this microstructure is related to the severity level.
4. Mechanical analysis
Since lightning is not just a purely electric phenomenon, and it is much more complex, the damage obtained should be also analysed taking into account all the physics involved in the process. This section presents a complementary study for the sensitivity analysis, in which a microstructural analysis of damage is done.
4.1. Microstructural analysis
Indeed, the damage obtained in a circular burned zone on the plates is initially coming from the melting of the
-0,4 -0,2 0 0,2 0,4 0,6 0,8 Painting rear face
Thickness Position Intensity_D Duration D B Intensity_C Duration C Partial Correlation coefficient
H2/H1 DSI Volume of damage (mm3)
9
materials in this zone due to the effect of the strike. After cooling, the melted matter coagulates into the form of a deformation as seen in section 2.2. However, before cooling, this melted zone may extend, add to this the effect of the high temperature caused by the strike, all these lead to a change in some characteristics of the structure of the plate at the boundary of the damage without deforming its external appearance. A microscopic view at the boundary of the damage area clarifies this structural effect of the strike as shown in Figure 10.
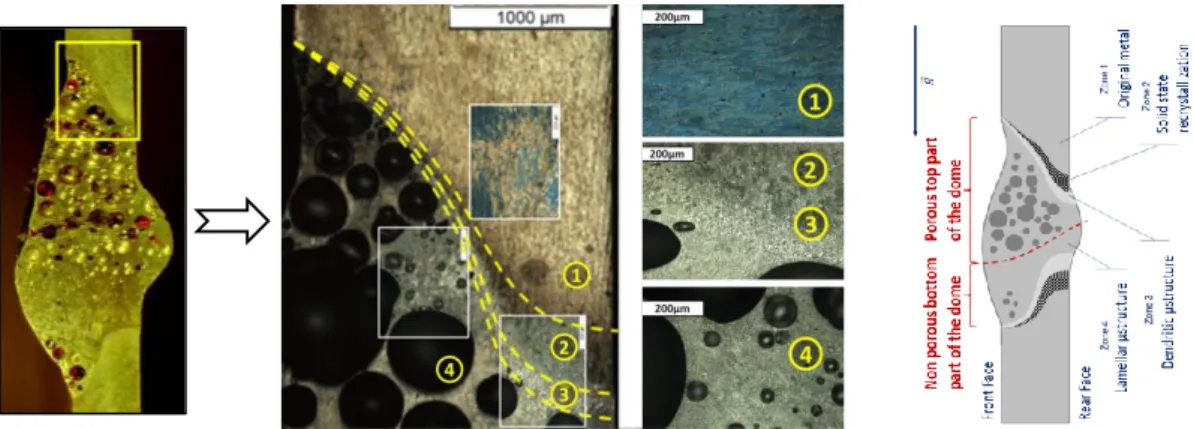
Figure 10. Microscopic view of the plate structure at the boundary of the damage zone
Starting from this microscopic view, four different zones are distinguished according to the impact on the metallic structure. At the scale of observation, in zone 1, the microstructure is analogous to the one that can be observed far from the impact and does not seem to have suffered from any phase change. It can be concluded that the temperature did not reach melting temperature (about 500°C). Zone 1 corresponds here to the original structure of the material. Zone 2 has reached a maximal temperature lower than melting temperature but high enough to have reached a phase change in the solid state or a recrystallization. It is an intermediate zone in which the state of the matter never reached the liquid phase (between about 500°C and 658°C). Zone 3 is a dendritic microstructure that shows a melted part and a local high temperature (between about 658°C and 2500°C). Zone 4 is a lamellar microstructure, where bubbles are concentrated. In this zone the matter has reached very high temperatures above the melting and even the evaporation temperature (2500°C). The cooling rate seems to be lower than the one in zone 3 because of the phase change from liquid to gas or event solid to gas.
4.2. Perforation mechanisms
By analysing the internal structural profile of the damage, we draw an elementary description of the evolution of the damage up to perforation. Indeed, if we considered the four zones localized in Figure 10, we see that neither Zone 1 nor Zone 2 contribute to the risk. On the other hand, Zone 3 is rapidly cooled and hence the risk of damage is locally high. However, the risk comes mainly from Zone 4 due to the vaporization of the matter at the high temperature concentration causing the thinning of the ‘neck’ that may have developed into perforation. More precisely, the damage observed is created in two stages, by heating according to energy deposition, then during the flow and removal of material. During heating, a 'kettle effect' is likely to occur while the liquid material collapses and the bubbles rise in the firing pattern due to gravity effect in vertical position. This raise of bubbles could also be affected by magnetic pumping and thermal effects in the neighbour ambient air. The weakening of the neck in the upper part, that occurs during cooling, could explain the switch over from the dome mode to crater mode and then more unstable from crater mode to perforation.
5. Conclusions and perspectives
This paper considers the problem of the variability of the damage forms obtained from lightning strike tests done on metallic panels under the same general standards. The current waveform used to imitate lightning strikes is the D+B+C* current waveforms reproduced by specific current delivery devices at DGA-Ta lightning lab. Note that
the charge of most of the test was about 55C and not 18C as required by the standard. In order to detect the role of different experimental parameters on this variability up to damage, a sensitivity analysis is carried out through an experimental process. The inputs that are considered in the sensitivity study are the testing parameters related to the current waveform or from the sample modification. Concerning the output, in a first try a non-destructive measurement is done and the volume of damage is approximated. Even though this volume has a linear regression with respect to the charge of the waveform C*, it fails to express the severity of the damage up to perforation. For this, we propose a new geometric output using the internal profile of the damage. This new output is called Damage Severity Index (DSI). It is demonstrated to be much more coherent with the severity level proposed qualitatively than the volume.
Then we use the Partial Correlation Coefficients to express the sensitivity of the experimental parameters with respect to the DSI. Results show that the duration of the charge C* has a strong effect on the damage, while the thickness of the plate and the distance of the strike to the centre on the plate have moderate effects. Waveform B appears to have no effect; this can be referred to the small range of variation allowed by the used device (EMMA generator). So in order to validate this effect a larger range of variation should be tested.
Complementary to this sensitivity study, a microstructural analysis of the damage is performed. This enables us to detect different thermally affected zones, and consequently the evolution of the severity according to these zones. These results are obtained based on the analysis of the plates after cooling, where the influence of gravity was clearly visible on the flow of the molten metal drop as the plates were placed vertically. This encourages the analysis of the case of placing the plates horizontally. In addition, in this study the effect of the external temperature and humidity was not taken into consideration, as they were measured just before the run of each test, future work can extend taking a new set of parameters related to the external atmosphere.
6. Acknowledgement
The DGA-Ta is thanked for the tests campaign and mutual efforts. The DGA MRIS is warmly thanked for having supported this work over two years under grant number 2015.60.0090.00.470.75.01.
References
1 ED-84, "Aircraft Lightning Environment and Related Test Waveforms," EUROCAE, 1997 2 ED-105, "Aircraft Lightning Test Methods," EUROCAE, 2005.
3 L. Chemartin, P. Lalande , B. Peyrou , A. Chazottes, P. Elias , C. Delalondre, B. Cheron, F. Lago, "Direct Effects of Lightning on Aircraft structure: Analysis of the Thermal, electrical and Mechanical Constraints," Journal of Aerospace Lab, vol. 5, pp. 1-15, 2012.
4 D. Morgan, C. J. Hardwick, S. J. Haigh and A. J. Meakins, "The Interaction of Lightning with Aircraft and the Challenges of Lightning Testing," Journal of Aerospace Lab, vol. 5 –AL05-11, hal-01184419, pp1-10, 2012. 5 F. Lago, G. Fontaine, C. Larrieu, P.Q. Elias, L. Chemartin, P. Lalande, "Measurement by a digital image correlation technique of the deflection of panels submitted to lightning impulse," in ICOLSE Oxford, 2011. 6 A. Saltelli, M. Ratto, T. Andres, F. Campolongo, J. Cariboni, D. Gatelli, M. Saisana and S. Tarantola, "Global Sensitivity Analysis: The Primer," John Wiley & Sons Ltd, ISBN 978-0-470-05997-5, 2008.
7 J. C. Helton, J. D. Johnson, C. J. Sallaberry and C. B. Storlie, "Survey of sampling-based methods for uncertainty and sensitivity analysis," Reliability Engineering & System Safety, vol. 91, no. 10-11, pp. 1175--1209, 2006.