Open Archive TOULOUSE Archive Ouverte (OATAO)
OATAO is an open access repository that collects the work of Toulouse researchers and
makes it freely available over the web where possible.
This is an author-deposited version published in :
http://oatao.univ-toulouse.fr/
Eprints ID : 18105
To link to this article : DOI:
10.1016/j.ijfatigue.2016.11.015
URL :
http://dx.doi.org/10.1016/j.ijfatigue.2016.11.015
To cite this version :
Fessler, Emmanuel and Andrieu, Etienne and
Bonnand, Vincent and Chiaruttini, Vincent and Pierret, Stéphane
Relation between crack growth behaviour and crack front
morphology under hold-time conditions in DA Inconel 718. (2017)
International Journal of Fatigue, vol. 96. pp. 17-27. ISSN 0142-1123
Any correspondence concerning this service should be sent to the repository
administrator:
[email protected]
Relation between crack growth behaviour and crack front morphology
under hold-time conditions in DA Inconel 718
E. Fessler
a,b,⇑, E. Andrieu
c, V. Bonnand
b, V. Chiaruttini
b, S. Pierret
a aSafran Aircraft Engines, établissement de Villaroche, 77550 Moissy-Cramayel, FrancebONERA, The French Aerospace Lab., 29 avenue de la division Leclerc, 92320 Châtillon, France cCIRIMAT, INP-ENSIACET, 4 allée Emile Monso, BP 44342, 31010 Toulouse Cedex 4, France
Keywords: Crack growth Hold-time Crack front shape Potential drop DA Inconel 718
a b s t r a c t
The crack growth behaviour of Direct Aged Inconel 718 was studied at 550 !C. Experiments were carried out under pure fatigue cycles, hold-time cycles of different durations and a mix of both. Hold-time cycles were systematically associated with complex crack front morphologies. A new numerical approach was developed to assess the effect of crack front morphology on the direct current potential drop technique, mechanical fields at the crack tip and ultimately, measured crack growth rates. Using this approach, a clear relation was established between crack front morphology and its evolution, and the crack growth behaviour under hold-time conditions. Complex crack front morphologies are demonstrated to be responsible for increased crack growth rates. From this, a crack growth mechanism under hold-time con-ditions is proposed. Finally, the numerical framework here presented is to be considered as a new, easily reproducible, way to properly analyse experimental data when dealing with complex loading cycles and complex crack front morphologies.
1. Introduction
Crack propagation is a major issue for aero-engines manufac-turers. Indeed, critical components such as turbine discs, made of Direct Aged (DA) Inconel 718, have to meet certification require-ments in terms of fatigue crack propagation life. However, the main loading cycle is defined by the take-off - cruise - landing sequence. Hold-time cycles should then be considered instead of pure fatigue cycles since they are more representative of in-service loading conditions. Under such conditions, the effect of fati-gue, creep, oxidation and their interactions have to be considered. Predicting fatigue crack propagation life of components under hold-time conditions is quite challenging since these effects must be taken into account in models, and established models are often too conservative. This study then aims at investigating the effect of hold-time cycles on the crack growth behaviour of DA Inconel 718. It is well established that hold time cycles have a strong effect on the high temperature crack growth behaviour of Inconel 718
[1–6]. Over the years, this effect has been investigated over a wide range of hold-time durations, from 10s by Clavel and Pineau[2]up to 6 h in the recent study by Gustafsson et al.[7]. The creep crack growth behaviour of Inconel 718 has also been widely investigated
[8–10]. Inconel 718 alloy, as well as other Ni-based superalloys, appears very sensitive to hold-times at maximum load. Reducing the loading frequency also leads to increased CGRs. At high tem-perature, under hold-time conditions, increased CGRs are accom-panied with intergranular fracture while transgranular fracture is usually observed under pure fatigue loading, or under hold-time conditions in the near-threshold regime[11].
Hold-time effect is often related to the deleterious effect of oxy-gen on the crack growth behaviour of Inconel 718[1,12–14]. In
[15,16], CGRs were demonstrated being dependent on the oxygen partial pressure PO2, especially under hold-time conditions.
Although the exact damaging mechanism occurring at the crack tip is still not understood, two mechanisms are proposed: stress assisted grain boundary oxidation (SAGBO) [17] and dynamic embrittlement (DE)[18]. They both state the existence of a dam-aged zone surrounding the crack tip, associated with reduced frac-ture toughness. Experimental studies were carried out to assess this damaged zone [19,20]. This concept is also used in crack growth models to assess fatigue-creep-environment interactions
[21–24]. With these analyses, the hold-time effect is investigated at a fine scale, that is the volume of material surrounding the crack tip affected by environmental, and mechanical damage.
However, when dealing with hold-time cycles, complex crack front shapes are observed with a large amount of crack curvature and tortuosity (seeFig. 1). Similar crack front shapes were reported in[8,25–28]. In most cases, the crack length is monitored using the http://dx.doi.org/10.1016/j.ijfatigue.2016.11.015
⇑ Corresponding author at: Safran Aircraft Engines, établissement de Villaroche, 77550 Moissy-Cramayel, France.
direct current potential drop technique (DCPD). However, the effect of crack front shapes on the DCPD technique and subsequent measured CGRs is seldom discussed. Indeed the DCPD technique is often, experimentally or numerically, calibrated assuming an ide-alised straight or 1/2 circular crack front. Two exceptions can be noted in [25,29] where non-idealised crack front shapes were considered.
This study aims at investigating the crack growth behaviour of DA Inconel 718 under hold-time conditions, with a particular emphasis on the macroscopic scale that is crack front morphology. Crack growth tests were carried out at 550 !C under pure fatigue and hold-time cycles. CGRs were measured using the DCPD tech-nique in a classical way. Crack front shapes were carefully charac-terised using optical microscopy and the crack growth mechanisms were investigated under SEM. Based on experimental observations, a numerical study was carried out to evaluate the bias introduced by complex crack front shapes on the DCPD technique and how it can be related to the crack growth behaviour under hold-time con-ditions. Finally, a crack growth mechanism under hold-time condi-tions is proposed, simply based on geometrical consideracondi-tions, since crack front morphology is believed to be responsible for dif-ferent crack growth behaviour. However, the underlying mecha-nism that may explain such complex crack front shapes are not addressed.
2. Material and experimental procedures 2.1. Material data
The material used in this study was Inconel 718, a wrought polycrystalline Ni-base superalloy widely used in high tempera-ture applications such as aero-engines high pressure turbine discs. It derives its strength from
c
00andc
0hardening precipitates withinthe matrix solution and from solid solution of alloying elements. It was delivered in the form of an as forged turbine disc which was given the direct ageing (DA) heat treatment: 8 h at 720 !C and 8 h at 620 !C, directly after forging steps. It exhibits a large amount of d phase particles in intergranular position and the average grain size is 7
l
m. This microstructure is illustrated inFig. 2. All speci-mens used in this study were extracted from the as forged disc in an area where the microstructure is rather homogeneous. 2.2. Experimental proceduresCrack growth tests were conducted under load control on a Schenck servo hydraulic machine with a load capacity of 40 kN.
Single edge notched specimens were used, with a rectangular cross-section of 2 mm " 16 mm. A straight through thickness star-ter notch of 0.3 mm depth was introduced using electro discharge machining (EDM).
Specimens were heated using an induction coil which was designed so that the shoulders of the sample are heated by induc-tion and the mean secinduc-tion by conducinduc-tion. No coil is placed in front of the mean section in order to keep a maximum accessibility to the sample. Temperature was controlled using six thermocouples spot welded on the side of the specimen opposite to the starter notch. Moreover, a thermal camera was used to control thermal homogeneity on the sample back face. Thus, temperature was con-trolled within the range ±8 !C over the mean section.
Specimens were first fatigue precracked at test temperature up to a crack length of 0.6 mm to get a sharp crack with a reduced plastic zone at its tip. This was achieved using a load shedding pro-cedure according to ASTM standard[30].
Crack growth tests were then carried out at 550 !C with a load ratio R = 0.05, in laboratory air. Different wave shapes signal were used. First, tests were carried out under 2 Hz pure fatigue cycle. They are considered as a reference cycle in this study since the crack growth mechanism is purely cycle-dependent at this fre-quency. Then, tests were performed under 10-HT-10 hold-time cycles with 10s loading and unloading, and hold-times (HT) at maximum load of various durations (300 s, 1200 s and 3600 s). They were used to investigate the deleterious effect of hold-time at maximum load on the crack growth behaviour of DA Inconel 718. Moreover, such cycles lead to a time-dependent crack growth mechanism as opposite to a 2 Hz pure fatigue loading. Finally, tri-angular 10–10 cycles (10 s loading and unloading) were used. These cycles are equivalent to the load reversal part of 10-HT-10 cycles. The comparison between 10–10 and 10-HT-10 cycles will therefore allow to understand how the hold-time at maximum load affects the load reversal part a hold-time cycle.
An additional experimental procedure was used, consisting in alternating crack propagation under hold-time cycles and pure fatigue cycles on the same sample. This procedure was previously used in[19,20]. It is also convenient since it acts as a beachmarking technique.
During tests, crack length was monitored using the direct cur-rent potential drop technique. Platinum wires were spot welded on both sides of the EDM notch, as close as 0.5 mm to allow the highest sensitivity to the crack growth[25]. The crack length was derived from potential drop measurements using the Johnson analytical formula [31] widely used for SEN specimens, see Eq.(1):
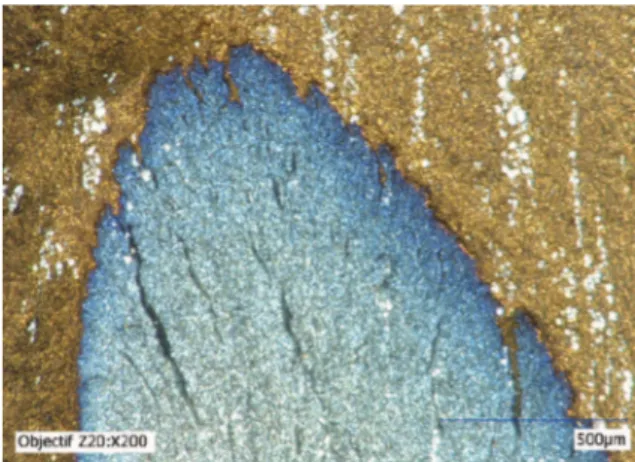
Fig. 1. Example of a complex crack front shape observed under hold-time conditions.
a ¼ 2W
p
! " cos$1 cosh p d 2W # $ cosh V Vrefcosh $1 cosh pd 2W ð Þ cos#p2Waref$ ! " ! " 0 B B @ 1 C C A ð1Þwith W being the sample width, d the distance between prob wires and EDM starter notch (seeFig. 3), aref and Vref a reference crack
length and associated potential drop value. For sinusoidal (2 Hz) and triangular (10–10) cycles, DCPD data were acquired in synchro-nisation with the maximum load of each cycle, while it was acquired every second for hold-time cycles. This allows extracting the crack growth increment occurring during the hold-time and at load reversal. The stress intensity factor range DK is calculated using the formula found in[32].
Crack growth tests were analysed in terms of da=dNðDKÞ curves. A close attention was paid to crack front shapes observation, using optical microscopy. SEM observations were carried out to identify whether the crack growth mechanism is transgranular or intergranular.
3. Results
3.1. Crack growth rates data
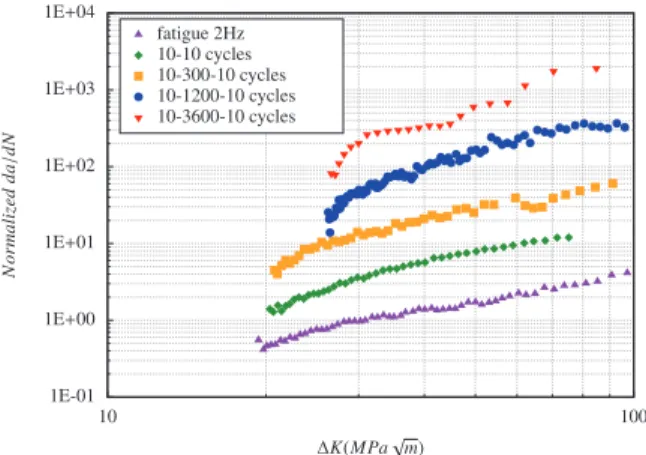
Test results obtained at 550 !C for the different investigated cycles are shown inFig. 4. These results are to be seen as comple-mentary data to a previous study by Pierret et al.[6], on the same material but using KB specimens. They were obtained under the assumption of a straight through thickness crack for CGRs mea-surements using the DCPD technique andDK calculation, which is supposed to be valid for SEN specimens.
First, a tremendous effect of loading frequency is noticed by comparing triangular 10–10 cycles (0.05 Hz) and 2 Hz cycles. A change in the crack growth mechanism is also observed. 2 Hz pure fatigue cycles lead to a fully transgranular fracture (Fig. 5a) while 10–10 cycles lead to a fully intergranular fracture (Fig. 5b).
Hold-time cycles lead to even greater CGRs as compared to 2 Hz fatigue cycles. For all investigated hold-time cycles, intergranular fracture is observed. At 550 !C, no saturation of the hold-time effect on CGRs is observed in the investigated range of hold-time durations. This is supported by data reported in [7] even with hold-time cycles as long as 21,600 s.
Under hold-time conditions, crack growth occurs during the hold-time and at the load reversal. These two contributions were extracted from the whole cycle and are respectively denoted as creep and fatigue contributions. The sum of these two contribu-tions being the crack growth over the whole cycle. Results of this decomposition are presented inFig. 6a. At 550 !C, for all investi-gated hold-times, the fatigue contribution is the most damaging one. Similar results are reported in [7,33]. However, the crack growth partition between fatigue and creep contributions depends on test temperature and hold-time duration. The creep contribu-tion may even become the major contribucontribu-tion in Astroloy under 10–300–10 cycles at 750 !C[33]. On the basis of a da=dt Kð maxÞ
dia-gram, the creep contribution appears independent on the hold-time duration, indicating that a steady creep crack growth regime is reached after a 300 s hold-time. It can be fitted by a single power law, analogue to a Paris law. The fatigue contribution is the most damaging one and is depending on the hold-time duration. The longer the hold-time, the more the crack propagates at load rever-sal which indicates that the creep contribution has an effect on the load reversal.
The deleterious effect of hold-time cycles is often associated to a damaged zone at the crack tip due to environmental effects[19– 21]. This concept was here investigated, applying an experimental procedure previously used in [19,34]. It consists in alternating crack propagation under hold-time and pure fatigue cycles on the same sample. Results presented inFig. 7 were obtained by transitioning from 10–300–10 cycles to 2 Hz fatigue cycles at 550 !C. When applying fatigue cycles a transient is observed on the da=dNðDKÞ curve, with decreasing CGRs before a steady Paris regime is reached. During the transient, a crack growth increment of 450
l
m is measured. Similar tests were performed in[20]and the crack growth increment occurring during the transient was associated to the size of a damaged zone at the crack tip due to environmental effect occurring under hold-time conditions. How-ever, results obtained in the present study are not even comparable to those reported in[20]. Indeed, similar transients were measured on Inconel 718 at 550 !C but for 21,600 s hold-time cycles and on KB specimens. The question that arises is why the length of the transient (or damaged zone) is specimen dependent, especially if it is considered to be related to environmental effects such as inter-granular oxidation at the crack tip. Considering an environment related damaged zone of the order of hundreds microns seems inconsistent with known pure oxidation mechanisms or diffusion kinetics in Inconel 718 (see [16]). However, high stress level at the crack tip may assist the oxidation process as in SAGBO[17]. Intergranular failure, due to intergranular oxidation at the crack tip[12]will therefore be assisted by the local high stress level. InFig. 3. SEN specimen geometry and notations.
the upcoming section, the transient will be considered regarding geometrical effects. Indeed, this procedure also acts as a beach-marking technique. Crack front shapes observed after the applica-tion of hold-time (the start of the transient) and fatigue cycles are seen inFig. 7and two very different crack front morphologies are observed.
3.2. Fracture surfaces and crack front shapes observation
All the results presented so far were analysed assuming a straight through-thickness crack for DCPD calibration (Johnson’s formula) andDK calculation. Crack fronts observed under pure fati-gue and hold-time conditions are presented inFig. 8. The validity and accuracy of crack monitoring and DK calculation methods are discussed regarding observed crack front shapes.
Under 2 Hz cycles, at a macroscopic scale, crack fronts are slightly curved and even (seeFig. 8a and d). They also appear even at a microscopic scale (seeFig. 9a). InFig. 9a, a transition from 2 Hz pure fatigue cycles to hold-time cycles was performed, leading to a change of crack growth mechanism, from transgranular (at the bottom left corner) to intergranular (at the top right corner), respectively. This transition allows to see the crack front obtained under 2 Hz cycles, here highlighted with the white dashed line. Finally, under 2 Hz cycles, the crack can be assumed as straight, consistently with the Johnson’s formula. Crack lengths measured by the mean of heat-tints are found to be in good agreement with those derived from the DCPD technique. The best accuracy is obtained when using the Johnson’s formula with the normalisation value Vreftaken at the end of the propagation. Thus, an accuracy of
50
l
m is reached. Similar crack front shapes are observed for 10– 10 cycles.Fig. 5. Transgranular fracture with ductile striation observed under 2 Hz fatigue loading at 550 !C (a), typical intergranular fracture observed for 10–10 and 10-HT-10 cycles at 550 !C (b).
(a)
(b)
Fig. 6. Decomposition of fatigue and creep contribution at 550 ! C for 10–300–10 cycles (a), creep contribution only for different hold-time cycles (b).
Fig. 7. Transition from hold-time to fatigue cycles at 550 !C, transient measure-ment and associated crack fronts.
When it comes to hold-time cycles, crack fronts are more com-plex and three different scales have to be considered. First, at a macroscopic scale, a noticeable crack curvature is observed and it increases with increasing hold-times (seeFig. 8b, c, e and f). This is denoted as crack tunnelling. Second, at an intermediate scale, fracture surfaces exhibit a much more pronounced relief with a ‘‘mountain-valley” aspect leading to local crack propagation under mixed I + II + III mode (seeFig. 8c). Finally, at a microscopic scale, a saw-teeth aspect of the crack front is observed. This aspect is illus-trated onFig. 9b. As previously mentioned, the crack front is visible thanks to a transition of loading cycle, and associated crack growth mechanism, this time from hold-time cycles (at the bottom part, with intergranular fracture) to 2 Hz pure fatigue cycles (at the top part, with transgranular fracture). For the longest hold-time, the degree of crack tortuosity is large enough to be seen at a macroscopic scale (seeFig. 8c). The amount, amplitude, of crack
tortuosity increases with increasing hold-time duration (see
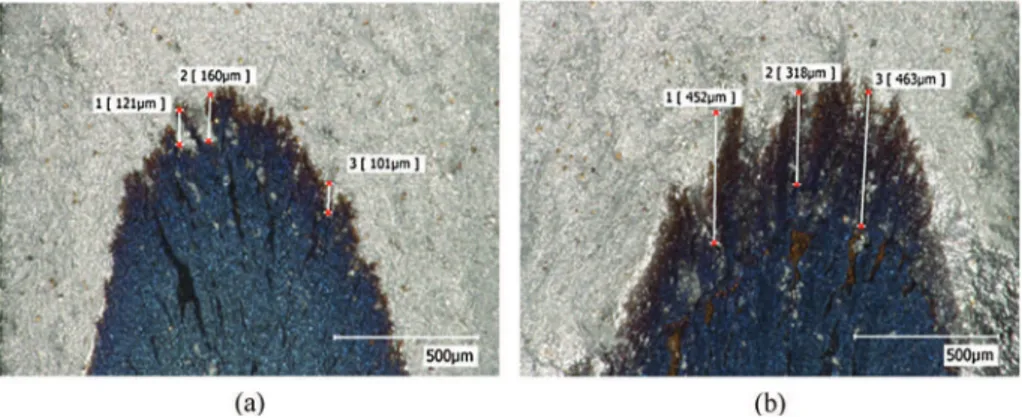
Fig. 10). Moreover, it can be seen from oxides colours observation that ligaments (in brown, see Fig. 10b) of unbroken material remained behind the crack front. They must have broke later dur-ing crack propagation since a brown oxide colour indicates a lower oxidation time than a blue oxide colour. With such complex crack front morphologies, crack lengths measured on the fracture sur-faces (at mid-thickness) hardly match those derived from the DCPD technique, whatever the choice of the normalisation value Vref is. Similar curved and tortuous crack fronts were reported in [27,28,35,36].
Hold-time then appears responsible for both crack curvature and tortuosity. Indeed, one can notice on Fig. 8c how much the crack front curved between the two visible beachmarks. The first, slightly curved, crack front corresponding to 2 Hz cycles and the second, curved and tortuous one, corresponding to a single
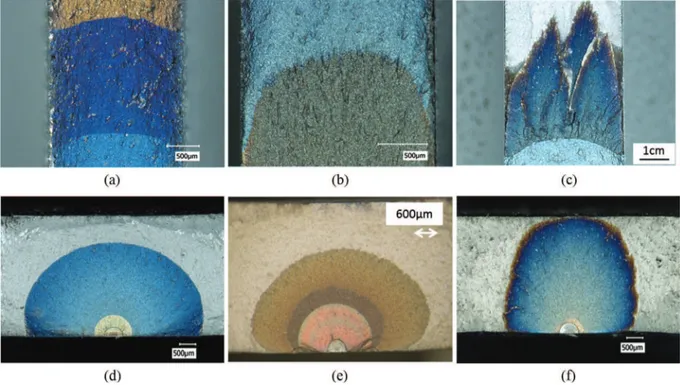
Fig. 8. Comparison of crack front shapes: 2 Hz fatigue cycles at 550 !C on SEN (a) and KB specimens (d), 10–300–10 cycles at 550 !C on SEN (b) and KB specimens (e), 2 h hold-time at 550 !C on SEN specimens (c) and 10–1200–10 cycles at 550 !C on KB specimens (f). KB specimens shown here were tested in[6].
Fig. 9. Small amount of crack front tortuosity under 2 Hz fatigue cycles (a) and large tortuosity under 10–300–10 cycles (b). The dashed lines illustrate the crack front position.
time at 550 !C. Moreover, it is worth noting the change of crack front shape when transitioning from hold-time to pure fatigue cycles. The crack curvature and tortuosity observed under hold-time cycles unfold when applying fatigue cycles (see fracture sur-face onFig. 7). These observations were made on SEN and KB spec-imens (seeFig. 8).
Crack front shapes are more complex under hold-time condi-tions than under pure fatigue loading and they do not match the hypotheses of calibration curves for the DCPD technique andDK calculation neither for SEN, nor for KB specimens (see [25] for DCPD calibration and[37]forDK calculation on 1/2 circular crack). The effect of curved and tortuous crack front shapes on the DCPD response needs to be considered. This is what is achieved in the next section.
3.3. Effect of crack front shape on the DCPD technique
Finite element (FE) simulations were performed to assess the bias introduced by crack curvature and tortuosity on the DCPD technique and measured crack lengths and CGRs. This is achieved by meshing various non-idealised crack front shapes and comput-ing the DCPD response of such cracks.
3.3.1. Crack insertion tool and computation method
The Zset-Zcracks software was used to insert cracks into FE meshes. First the 3D mesh of the sane sample and the 2D mesh of the crack surface are created. The crack mesh is positioned at the desired position in the sane mesh, a mesh intersection is per-formed and meshes are refined at the crack tip. Finally a conform mapping of the cracked model is obtained. Various crack front shapes were then meshed and used for simulating the DCPD response of these cracks. The DCPD simulation consists in solving Eq.(2):
J !
¼ $
r
+++!gradð/Þ ð2Þwith J being the electrical current,
r
the electrical conductivity and /the electrical potential. After computation, the electrical potential is post-processed at the position where probe-wires are welded on the sample (seeFig. 11).Simulations were carried out using the analogy between electri-cal potential and temperature since the Zset software includes a thermal solver. The electrical current passing through the sample is simulated with an incoming and out-coming surface heat flux, respectively at the top and bottom of the cracked mesh.
3.3.2. Effect of crack curvature and tortuosity
Various meshes were generated with curved cracks. The degree of crack curvature is defined by the tunnelling parameter defined by Eq.(3)(see scheme onFig. 12for notations):
pt ¼
D
am$D
asT ð3Þ
withDambeing the crack length at the mid-thickness,Dasthe crack
length at the surface of the specimen and T the specimen thickness. The potential drop response of such cracks is simulated and crack lengths are derived from numerical DCPD data using the
Fig. 10. Amplitude of crack tortuosity for 10–300–10 cycles at 550 !C (a) and for 10–3600–10 cycles at 550 !C (b).
Fig. 11. Illustration of DCPD simulation and DV post-processing; iso-potential lines.
Johnson’s formula, as for experiments. These crack lengths are compared to the length of the inserted crack, defined at the mid-thickness (seeFig. 12).
The computation method used to simulate the DCPD method gives results in almost perfect agreement with the Johnson’s for-mula only when a straight crack is inserted. Indeed, the slop of the curve for such a crack front is 1 (seeFig. 12). This indicates that the method used is reliable to simulate the DCPD technique. Crack curvature introduces a tremendous bias on the DCPD technique (seeFig. 12). Real crack lengths are greatly underestimated when using the Johnson’s formula. This is supported by experimental data representing crack lengths measured by the DCPD technique against the actual crack lengths measured on the fracture surface at mid-thickness. These experimental values corresponds to tun-nelling parameters ranging from 0.2 to 0.7. A huge bias is intro-duced by crack curvature on the DCPD technique, showing that even a small approximation of the crack curvature has a strong effect on the crack length measurement.
Considering that the crack curvature does not evolve during crack growth, one could easily re-calibrate the DCPD method. However, crack curvature is believed to build-up during crack propagation. Under pure fatigue cycles, a small amount of crack curvature builds-up at the very beginning of the crack propagation and no longer evolves once it is established (seeFig. 8a). That is why a good accuracy is reached using the Johnson’s formula, espe-cially when the normalisation value Vref is taken at the end of the
test, once the curvature is established. Under hold-time conditions, the large amount of crack curvature is believed to build-up during a large part of the propagation. That is why, whatever the choice of the normalisation value Vref is, crack lengths derived from the
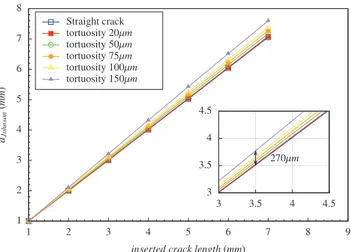
DCPD method hardly match those measured on fracture surfaces. The same strategy was used to assess the bias introduced by crack tortuosity on the DCPD technique. Tortuosity is represented by sinusoidal cracks, of given frequency and amplitude (see
Fig. 13). The number of periods along the crack front was taken as an integer so that, for a given average crack length, all cracks have the same area whatever the amplitude and frequency are. The bias introduced by crack tortuosity on the DCPD technique can be seen inFig. 14).
Crack tortuosity also introduces a bias on the crack length mea-surement. However, its effect is far less pronounced than for crack curvature. Indeed, in that case, the crack remains essentially straight, apart from its tortuosity, which matches the main hypoth-esis of the Johnson’s formula.
Crack curvature and tortuosity introduce a bias on the crack length measurements using the DCPD technique. This bias must be carefully considered when dealing with fine analyses such as transient measurement during the transition from hold-time to pure fatigue cycles. Indeed, the bias introduced by crack tortuosity
is of the same order than the crack growth increment measured during the transient (see Section3.1). This bias must also be con-sidered when decomposing creep and fatigue contributions under hold-time conditions. This decomposition is obtained assuming a straight through thickness crack and may be biased due to geomet-rical effects. The analyse of these data should be done by consider-ing geometrical effect in order to properly analyse the underlyconsider-ing crack growth mechanism. The bias highlighted here was revealed considering non propagating cracks. However, during propagation, crack front morphology evolves. The effect of crack front shape evolution is investigated is the next section.
4. 3D crack growth simulations and effect of crack front evolution on the DCPD method
The dynamic effect of crack front shape evolution on the DCPD technique is here assessed on the basis of growing cracks. A numerical approach was developed where experimental crack front shapes are replicated and inserted into finite elements meshes. Crack growth simulations are then performed in conjunc-tion with DCPD simulaconjunc-tions and analysed the same way as experiments.
4.1. Crack growth algorithm
The used crack growth algorithm is restrained to the case of fatigue loading and based on LEFM. A Paris law is used as crack propagation law. The algorithm can be described as follows:
1. Initialisation: Kmax¼ Kmin¼ 0
2. Compute current time step and keep extremal K values for the current cycle
3. ComputeDa for every nodes along the crack front
4. Get maximalDa value. If it is greater than a specified Damax
parameter (controlling crack growth), reduce DN accordingly for Paris law integration
5. Update N with DN value and process remeshing with incre-mented crack position
6. Go back to 1
During the remeshing step, Barsoum’s elements are inserted at the crack tip. During computation, the energy release rate G is computed using the G $Hmethod. K values are derived from G using the Irwin formula with the assumption of pure mode I load-ing and plane strain hypothesis.
During crack the growth simulation, all generated meshes are saved and used to simulate the DCPD response of the crack all
Fig. 13. Sketch defining geometrical parameters for tortuous crack mesh.
along the numerical crack propagation. Then, crack lengths are derived from numerical DCPD data using the Johnson’s formula.
DK values are derived from obtained crack lengths. Thus, da=dNðDKÞ curves are obtained from crack growth simulations the exact same way as for experiments.
4.2. Crack growth simulation of experimental curved cracks
Crack growth simulations were performed with initial curved crack front reproduced from fracture surfaces, as obtained under hold-time cycles (see Fig. 15). From this, pure fatigue cycles are simulated, as for corresponding experiments where a transition from 10–300–10 cycles to 2 Hz pure fatigue cycles was applied. The Paris law used in simulation was identified from experiments at 550 !C under 2 Hz fatigue cycles.
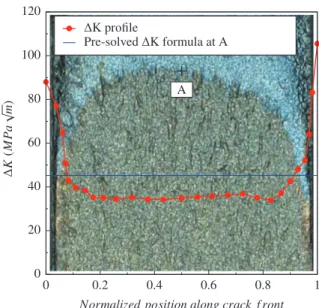
First, consideringDK profile along the initial curved crack front, one can notice higherDK values near the specimen surface than at mid-thickness (seeFig. 16) due to a reduced area of the unbroken ligament ahead of the crack front and consequent higher stress level. These highDK values will lead to higher CGRs in this area than at mid-thickness. Consequently, a rapid unfolding of the crack front curvature occurs as the crack propagates. This is consistent with experiments since the application of fatigue cycles after hold-times cycles leads to crack curvature unfolding (see second crack front inFig. 15).
The da=dNðDKÞ obtained from simulation exhibits the same transient as experiments (see Fig. 17). From simulations, it can be concluded that the transient ends once the crack front curvature has unfolded (point B inFig. 17). After what, propagation goes on, no more crack front evolution occurs and a steady state Paris law is observed. Branco and Antunes[38], by performing crack growth simulations using a similar algorithm, observed the same two-stepped evolution of complex crack fronts.
Both the crack front curvature unfolding and the transient on the da=dNðDKÞ curve are found to be consistent with experiments, and so is the length of the transient:Da ¼ 450
l
m.It is concluded that the transient is related to a geometrical that is crack front shape evolution during propagation and its effect on the DCPD technique. From crack growth simulations and fracture surfaces analyses it can be concluded that the transient corre-sponds to the number of pure fatigue cycles needed to unfold a curved and tortuous crack front, as obtained after hold-time cycles. The geometrical nature of the transient may explain why there is a large difference between the transients measured on SEN (in the present study) and KB specimens[20]for identical loading
con-ditions. The same numerical procedure was used for KB specimens, using curved crack front obtained under hold-time conditions (10– 300–10 cycles at 550 !C). Corresponding fracture surfaces were obtained from tests carried out in [6]. The numerical PD data obtained during the crack growth simulation were analysed using a calibration curve for 1/2 circular crack andDK was calculated using the formula found in [37]. The same transient is observed and its length isDa ¼ 130
l
m, which is found to be in good agree-ment with data reported in[20]for similar loading conditions. This confirm the geometrical nature of the transient.This demonstrates how significant is the effect of the crack front morphology and its evolution on the DCPD technique, at the macroscopic scale that is the crack curvature. Significant crack front evolution leads to ‘‘unusual” transients on the da=dNðDKÞ curve, which must then be geometrically considered. It is also responsible for increased CGRs, at the beginning of the transient, as compared to the steady Paris regime.
4.3. Crack growth simulation of tortuous crack fronts
Moving one scale further, crack propagation simulations were carried out on tortuous crack front shapes. Once again, tortuosity
Fig. 15. Meshing of exact curved crack front (10–300–10 cycles at 550 !C).
Fig. 16. K profile along experimental curved crack front.r¼ 400 MPa.
Fig. 17. da=dN DKð Þ curve obtained from crack growth simulation on SEN specimens and comparison with experiment.
is represented by a sinusoidal crack front in finite elements meshes. As for crack curvature, crack tortuosity unfolds during crack growth due to heterogeneousDK distribution along the crack front (seeFig. 18where the mesh represents the cracked surface). HighestDK values are observed in the depth of crack tortuosity, where the remaining unbroken ligament ahead of the crack tip is the smallest. For an average crack length of 2 mm and a tortuosity amplitude of (120
l
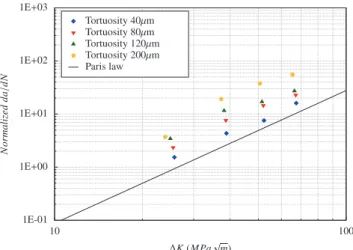
m;DK values in the depth of tortuosity are 15 times higher than those at the top of it. This difference increases with increasing crack length and tortuosity amplitude. The DK value calculated using the average crack length and a pre-solved formula (as for experiments) is somewhere in between these two extremal values. CGRs are then significantly higher in the depth of crack tortuosity than at the top. Regarding the unfolding process, tortuosity is considered as a generalisation of crack curvature at a smaller scale.Crack growth simulations on tortuous crack fronts were anal-ysed as in Section4.2. Hold-time appears responsible for crack tor-tuosity and fracture surfaces analyses show that pure fatigue cycles tend to unfold this tortuosity (and curvature). It is assumed that the load reversal part of each hold-time cycle acts as a pure fatigue cycle, hence unfolding, at least partially, crack tortuosity and curvature. For this reason simulations, starting from a initially tortuous crack front, were stopped after a few remeshing steps that is DN ) 50, so that tortuosity partially unfolds. Once again, the DCPD technique is simulated and analysed as for experiments. This was repeated for different average crack lengths and crack tortuos-ity amplitudes. Results can be seen onFig. 19. Measured CGRs are compared to the Paris law used for the crack growth simulations. CGRs measured with the DCPD method are significantly increased as compared to those predicted by the Paris law. The big-ger the tortuosity, the higher the CGRs. This can be explained by significant local CGRs in the depth of tortuosity, where the highest
DK values are calculated (seeFig. 18). The DCPD method appears even sensitive to these very local crack growth extensions. When drawing da=dNðDKÞ curves,DK values are calculated from crack lengths measured by the DCPD method using the Johnson’s for-mula (or any calibration curve). Those are average crack lengths of the tortuous crack. Finally highest local CGRs, detected by the DCPD method, are plotted against averageDK values. This explains why higher CGRs are observed for tortuous cracks, as compared to the used Paris law.
This result, regarding the effect of crack tortuosity, can be related to experimental data presented in Fig. 4 to explain the
higher CGRs measured under hold-time cycles as compared to those obtained with 10–10 cycles. Indeed, 10–10 cycles lead to slightly curved and even crack fronts while hold-time cycles lead to curved and tortuous crack fronts. Moreover, 10–10 and hold-time cycles lead to intergranular fracture. The first order difference between these two conditions is then only crack front morphology. 2 Hz pure fatigue cycles are excluded from the comparison since they exhibit a transgranular fracture. InFig. 19the Paris law is to be considered as corresponding to experimental results obtained under 10–10 cycles. CGRs numerically measured for various crack tortuosity amplitudes are to be considered as CGRs obtained under various hold-time cycles. The amplifying effect of tortuosity on numerically measured CGRs appears rather consistent with the amplifying effect of hold-time on CGRs as compared to 10–10 cycles. This is also experimentally supported since longer hold-time durations give rise to higher crack front tortuosity (see
Fig. 10). Of course, crack curvature unfolding may also contribute to increased CGRs.
The DCPD technique appears sensitive to geometrical effects at a large scale, that is crack curvature, and at a small scale, that is crack tortuosity. They are demonstrated to be responsible for unu-sual crack growth behaviour, like the transient, and increased CGRs. Moreover they were related to experimental observations. Such phenomena must definitely be taken into account when ana-lysing CGRs data obtained with the DCPD technique, especially when dealing with loading conditions leading to complex crack front morphologies. The crack growth behaviour may be closely related to such morphologies and their evolution.
5. Crack growth mechanism under hold-time conditions considering crack front shape evolution
Fracture surfaces analyses have shown that hold-time cycles induce a large amount of crack front curvature and tortuosity. They both are increasing with increasing hold-time duration and tem-perature and so are the CGRs. Crack front curvature and tortuosity both disappear under pure fatigue cycles. From these observations and simulations the following mechanism of crack propagation under hold-time conditions is proposed (seeFig. 20).
During the hold-time, creep crack growth occurs. Crack growth is driven by local interactions between environmental effects, local stress state and microstructure at the crack tip[1,36,39]. The crack front could locally pin on d phase particles or a large grain, con-tributing to initiate the crack tortuosity. Moreover, during the hold-time, oxidation assisted grain boundary weakening may occur. Intergranular fracture will occur if the local stress level at
Fig. 18. Stress intensity factor distribution along tortuous crack front. 2 mm average crack length andr¼ 400 MPa.
the crack tip exceeds the fracture toughness of the weakened grain boundary. This local stress level depends on the orientation of the grain boundary with respect to the loading axis. Moreover, the weakening effect of grain boundary due to environmental effects may be itself assisted by stress level. Then, the conjunction of oxi-dation assisted grain boundary weakening and local stress level will lead to heterogeneous CGRs, hence initiating crack front tortu-osity. Regarding these different mechanisms crack front tortuosity will progressively build-up during the hold-time. This is consid-ered as the creep contribution (seeFig. 6). In the same time, a large amount of plastic strain will develop at the crack tip near the sam-ple surface due to a plane stress state. This will lead to a high degree of PICC and subsequent crack curvature at the surface dur-ing the next load reversal.
The load reversal part of the cycle, instead, is considered acting as a pure fatigue cycle. Under fatigue cycles crack growth is assumed to be driven by (local)DK values according to the Paris law. As shown by simulations, crack tortuosity and curvature will unfold at load reversal due to heterogeneousDK distribution. This unfolding process is responsible for increased CGRs. That is the fati-gue contribution of hold-time cycle. Apart from this geometrical mechanism, creep-fatigue interaction may occur[40–42]. Indeed, it was evidenced in other Ni based superalloys[40,41]that the fati-gue behaviour is strongly influenced by the prior application of a creep loading, revealing a load history effect. On the opposite, a prior fatigue loading does not influence the creep behaviour[41], which is supported by the observed steady creep crack growth behaviour (see Fig. 6b). Such interaction may also contribute to increasing CGRs at load reversal under hold-time conditions.
At the next cycle, the curved and tortuous crack leads to even more heterogeneousDK distribution at the crack tip. Local interac-tions between environmental effects, local stress state and microstructure will once again occur during the hold-time, ampli-fying crack curvature and tortuosity as cycles are applied. This pro-cess, illustrated inFig. 20, goes on and on.
Such an analyse of crack growth mechanism was enabled thanks to the numerical framework presented in this paper. The approach here proposed could allow one to carefully analyse mea-sured crack lengths and CGRs, when derived from the DCPD method, as well as precisely compute DK when complex crack front shapes are observed. Moreover it can quite easily be applied with most commercial FE software.
6. Conclusion
Crack growth behaviour of DA Inconel 718 was investigated under hold-time conditions. Tests were carried out at 550 !C for pure fatigue cycles, hold-time cycles (of various hold-time dura-tions) and a mix of both. Tests were analysed in terms of da=dNðDKÞ curves, obtained via the DCPD method, using pre-solved calibration for SEN specimens. A close attention was paid to crack front shapes observation at different scales. The effect of crack front shape on the CGRs measurement was numerically investigated. The following conclusions can be drawn:
1. Hold-time cycles lead to increased CGRs as compared to pure fatigue cycles. The major part of crack propagation occurs at load reversal. The CGRs ðda=dtÞ measured during the hold-time itself are independent on its duration.
2. Hold-time cycles lead to a large amount of crack front curvature and tortuosity while pure fatigue cycles (2 Hz or 10–10 cycles) lead to slightly curved and even crack fronts.
3. A numerical approach was developed to investigate the effect of crack front curvature and tortuosity on the DCPD method, con-sidering static cracks. The DCPD method is strongly influenced by crack front shape.
4. Crack growth simulations were performed with initial curved crack fronts replicated from fracture surfaces obtained under hold-time conditions. The simulated crack front evolution is found to be in good agreement with the experimental evolution when considering transition from hold-time to pure fatigue cycles. The DCPD method was simulated during numerical crack growth and analysed the same way as for experiments to draw da=dNðDKÞ curves. It is demonstrated that significant crack front evolution lead to transient on the da=dNðDKÞ curves. 5. Crack growth simulations with tortuous crack fronts were also performed and analysed with the DCPD method. It is demon-strated that crack front tortuosity leads to increased CGRs, mea-sured with the DCPD method, as compared to those predicted by the Paris law used in the simulation.
6. From fracture surfaces analyses and results of simulations a mechanism of crack propagation under hold-time conditions is proposed, taking into account the crack front shape evolution during the hold-time itself and at load reversal.
Acknowledgments
The authors would like to thank Safran Aircraft Engines for hav-ing funded this research work as well as for havhav-ing provided the material.
References
[1]Pedron J, Pineau A. The effect of microstructure and environment on the crack growth behaviour of Inconel 718 alloy at 650 !C under fatigue, creep and combined loading. Mater Sci Eng 1982;56:143–56.
[2]Clavel M, Pineau A. Frequency and wave-form effects on the fatigue crack growth behavior of alloy 718 at 298 K and 823 K. Metall Trans A 1978;9:471–80.
[3]Nicholas T, Weerasooriya T. Hold-time effects in elevated temperature fatigue crack propagation. In: Fracture mechanics: seventeenth volume. ASTM International; 1986.
[4]Lynch S, Radtke T, Wicks B, Byrnes R. Fatigue crack growth in nickel-based superalloys at 500-700 !C. II: Direct-aged alloy 718. Fatigue Fract Eng Mater Struct 1994;17:313–25.
[5]Bache M, Evans W, Hardy M. The effects of environment and loading waveform on fatigue crack growth in Inconel 718. Int J Fatigue 1999;21:S69–77. [6]Pierret S, Pinho RDM, Pineau A. Hold time effects on the crack growth behavior
in Inco 718 alloy. In: 8th International symposium on superalloy 718 and derivatives. Wiley Online Library; 2014. p. 537–51.
[7]Gustafsson D, Moverare J, Johansson S, Simonsson K, Hörnqvist M, Månsson T, et al. Influence of high temperature hold times on the fatigue crack propagation in Inconel 718. Int J Fatigue 2011;33:1461–9.
[8]Sadananda K, Shahinian P. Creep crack growth in alloy 718. Metall Trans A 1977;8:439–49.
[9]Sadananda K, Shahinian P. The effect of environment on the creep crack growth behavior several structural alloys. Mater Sci Eng 1980;43:159–68.
[10]Branco C, Baptista J, Byrne J. Crack growth under constant sustained load at elevated temperature in IN718 superalloy. Mater High Temp 1999;16:27–35. [11]Fessler E, Pierret S, Andrieu E, Bonnand V. Crack growth threshold under hold time conditions in DA Inconel 718 – a transition in the crack growth mechanism. Fract Struct Integr 2015:223–31.
[12]Andrieu E, Molins R, Ghonem H, Pineau A. Intergranular crack tip oxidation mechanism in a nickel-based superalloy. Mater Sci Eng: A 1992;154:21–8. [13]Floreen S, Kane R. An investigation of the creep-fatigue-environment
interaction in a Ni-base superalloy. Fatigue Fract Eng Mater Struct 1979;2:401–12.
[14]Ghonem H, Nicholas T, Pineau A. Elevated temperature fatigue crack growth in alloy 718 – Part II: Effects of environmental and material variables. Fatigue Fract Eng Mater Struct 1993;16:577–90.
[15]Andrieu E, Cozar R, Pineau A. Effect of environment and microstructure on the hight temperature behavior of alloy 718. Superalloys 718, 625 Various Derivatives 1989:241–56.
[16]Molins R, Hochstetter G, Chassaigne J, Andrieu E. Oxidation effects on the fatigue crack growth behaviour of alloy 718 at high temperature. Acta Mater 1997;45:663–74.
[17]Evans H, Li H, Bowen P. A mechanism for stress-aided grain boundary oxidation ahead of cracks. Scripta Mater 2013;69:179–82.
[18]Woodford DA. Gas phase embrittlement and time dependent cracking of nickel based superalloys. Energy Mater 2006;1:59–79.
[19]Liu X, Ma L, Chang K, Barbero E. Fatigue crack propagation of ni-base superalloys. Acta Metall Sin (Engl Lett) 2009;18:55–64.
[20]Gustafsson D, Moverare J, Simonsson K, Johansson S, Hörnqvist M, Månsson T, et al. Fatigue crack growth behaviour of Inconel 718 – the concept of a damaged zone caused by high temperature hold times. Proc Eng 2011;10:2821–6.
[21]Bouvard J, Gallerneau F, Paulmier P, Chaboche J. A phenomenological model to predict the crack growth in single crystal superalloys at high temperature. Int J Fatigue 2012;38:130–43.
[22]Gustafsson D, Lundström E, Simonsson K. Modelling of high temperature fatigue crack growth in Inconel 718 under hold time conditions. Int J Fatigue 2013;52:124–30.
[23]Lundström E, Simonsson K, Gustafsson D, Månsson T. A load history dependent model for fatigue crack propagation in Inconel 718 under hold time conditions. Eng Fract Mech 2014;118:17–30.
[24]Storgärds E, Simonsson K, Sjöström S. Three-dimensional crack growth modelling of a Ni-based superalloy at elevated temperature and sustained loading. Theor Appl Fract Mech 2016;81:2–10.
[25]Doremus L, Nadot Y, Henaff G, Mary C, Pierret S. Calibration of the potential drop method for monitoring small crack growth from surface anomalies – crack front marking technique and finite element simulations. Int J Fatigue 2015;70:178–85.
[26]Gourdin S, Doremus L, Nadot Y, Hénaff G, Pierret S. Fatigue crack growth from handling surface anomalies in a nickel based superalloy at high temperature. In: MATEC web of conferences, vol. 14. EDP Sciences; 2014. p. 16003. [27]Storgärds E, Simonsson K. Crack length evaluation for cyclic and sustained
loading at high temperature using potential drop. Exp Mech 2015;55:559–68. [28]Antunes F, Ferreira J, Branco C, Byrne J. Influence of stress state on high temperature fatigue crack growth in Inconel 718. Fatigue Fract Eng Mater Struct 2001;24:127–35.
[29]Riemelmoser F, Weinhandl H, Kolednik O, Pippan R. The influence of irregularities in the crack shape on the crack extension measurement by means of the direct-current-potential-drop method. J Test Eval 1999;27:42–6. [30] ASTM E647-05. Standard test method for measurement of fatigue crack
growth rates. ASTM International; 2008.
[31]Johnson H. Calibrating the electric potential method for studying slow crack growth (calibration of electric potential technique to study slow or steady crack growth in high strength materials). Mater Res Stand 1965;5:442–5. [32]Brown W, Srawley J. Plane strain crack toughness testing of high strength
metallic materials. In: Plane strain crack toughness testing of high strength metallic materials. ASTM International; 1966.
[33]Carbou C. Interactions fatigue-fluage sur le comportement en fissuration à haute température des superalliages pour disques de turbine. Effets d’oxydation Ph.D. thesis. ENSMA; 2000.
[34]Gustafsson D, Lundström E. High temperature fatigue crack growth behaviour of Inconel 718 under hold time and overload conditions. Int J Fatigue 2013;48:178–86.
[35]Hörnqvist M, Viskari L, Moore KL, Stiller K. High-temperature crack growth in a Ni-base superalloy during sustained load. Mater Sci Eng: A 2014;609:131–40. [36]Li H, Sun J, Hardy M, Evans H, Williams S, Doel T, et al. Effects of microstructure on high temperature dwell fatigue crack growth in a coarse grain pm nickel based superalloy. Acta Mater 2015;90:355–69.
[37]Newman J, Raju I. An empirical stress-intensity factor equation for the surface crack. Eng Fract Mech 1981;15:185–92.
[38]Branco R, Antunes F. Finite element modelling and analysis of crack shape evolution in mode-I fatigue middle cracked tension specimens. Eng Fract Mech 2008;75:3020–37.
[39] Liu CD, Han YF, Yan MG, et al. Creep crack growth behaviour of Alloy 718. In: Superalloys, vol. 178, no 625; 1991. p. 537–48.
[40]Hu D, Ma Q, Shang L, Gao Y, Wang R. Creep-fatigue behavior of turbine disc of superalloy GH720Li at 650 !C and probabilistic creep-fatigue modeling. Mater Sci Eng: A 2016;670:17–25.
[41]Hu D, Wang R. Experimental study on creep–fatigue interaction behavior of GH4133b superalloy. Mater Sci Eng: A 2009;515:183–9.
[42]Thébaud L, Villechaise P, Cormier J, Crozet C, Devaux A, Béchet D, et al. Relationships between microstructural parameters and time-dependent mechanical properties of a new nickel-based superalloy AD730TM. Metals 2015;5:2236–51.