Any correspondence concerning this service should be sent
to the repository administrator:
[email protected]
This is an author’s version published in:
http://oatao.univ-toulouse.fr/27271
To cite this version:
Ochoa Robles, Jesus and Azzaro-Pantel,
Catherine and Garcia, Guillem Martinez and Lasserre, Alberto Aguilar
Social cost-benefit assessment as a post-optimal analysis for hydrogen
supply chain design and deployment: Application to Occitania
(France). (2020) Sustainable Production and Consumption, 24.
105-120. ISSN 2352-5509
Official URL
DOI :
https://doi.org/10.1016/j.spc.2020.06.010
Open Archive Toulouse Archive Ouverte
OATAO is an open access repository that collects the work of Toulouse
researchers and makes it freely available over the web where possible
Social
cost-benefit
assessment
as
a
post-optimal
analysis
for
hydrogen
supply
chain
design
and
deployment:
Application
to
Occitania
(France)
Jesus
Ochoa
Robles
a,
Catherine
Azzaro-Pantel
a, ∗,
Guillem
Martinez
Garcia
a,
Alberto
Aguilar
Lasserre
ba Laboratoire de Génie Chimique, Université de Toulouse, CNRS, INPT, UPS, Toulouse, France b Instituto Tecnológico de Orizaba, Oriente 9, Emiliano Zapata, 94320 Orizaba, Ver., Mexico
a
r
t
i
c
l
e
i
n
f
o
Keywords:
Social cost-benefit analysis Hydrogen mobility Fuel cell vehicles Hydrogen supply chain
a
b
s
t
r
a
c
t
Alotofrecentstudieshaveconcludedthathydrogencould graduallybecomeamuchmoresignificant componentoftheEuropeanenergymixformobilityandstationaryfuelcellsystemapplications.Yet,the challengeofdevelopingafuturecommercialhydrogeneconomystillremainsthroughthedeploymentof aviablehydrogensupply chainandan increasingfuelcellvehiclemarket share,whichallowsto nar-rowtheexistingcostdifferenceregarding theconventionalfossilfuelvehiclemarket.Inthispaper,the marketpenetrationofhydrogenfuelcellvehicles,assubstitutesforinternalcombustionenginevehicles hasbeenevaluatedfromasocialandasubsidy-policyperspectivefrom2020to2050.Forthispurpose, thebestcompromisehydrogensupplychainnetworkconfigurationafterthesequentialapplicationofan optimizationstrategyandamulti-criteriadecision-makingtoolhasbeenassessedthroughaSocial Cost-BenefitAnalysis(SCBA)todeterminewhetherthehydrogenmobilitydeploymentincreasesenoughthe socialwelfare.Thescientificobjectiveofthisworkisessentiallybasedonthedevelopmentofa method-ologicalframeworktoquantifypotentialsocietalbenefitsofhydrogenfuelcellvehicles.Thecasestudyof theOccitaniaRegioninFrancesupportstheanalysis.Theexternalitycostsinvolvetheabatementcostof CO2, noiseandlocalpollutionaswellasplatinumdepletion.Asubsidypolicyscenariohasalsobeen
im-plemented.Forthecasestudyconsidered,theresultsobtainedthatarenotintendedtobegeneral,show thatCO2 abatementdominates theexternalities,platinum isthe secondlargestexternality,yet
reduc-ingthebenefitsobtainedbytheCO2 abatement.Thepositiveexternalitiesfromairpollutionandnoise
abatementalmostreachtocompensateforthenegativecostscausedbyplatinumdepletion.The exter-nalitieshaveapositiveeffectfrom2025.Usingasocietalcostaccountingframeworkwithexternalities andsubsidies,hydrogentransitiontimingisreducedbyfouryearsfortheexampleconsidered.
1. Introduction
Hydrogen, the simplest element on earth, consisting of only one proton and one electron, can store and deliver usable energy. Since hydrogen does not typically exist by itself in nature, it must be produced from compounds that contain it ( IEA2017).
Hydrogen production and distribution have been developed for many years mainly for several industrial applications, i.e., in chemical and metallurgical uses, food industry, and space program ( IEA 2017). Hydrogen can also be used in fuel cells to generate power using a chemical reaction rather than combustion, produc- ing only water and heat as by-products. These features make it attractive for the automotive sector, which requires a clean and
∗ Corresponding author.
E-mail address: [email protected] (C. Azzaro-Pantel).
feasible substitute for current internal combustion engine vehicles (ICEVs) that run with fossil fuels ( IEA 2015). Transport is one of the main contributors to energy demand and, currently, the fastest- growing source of greenhouse gas (GHG) emissions: in 2015, the transport sector contributed 25.8% of total EU-28 greenhouse gas emissions. Hydrogen technologies, using hydrogen as a carrier of sustainably produced renewable energy, have been presented as solutions to rising levels of GHG emissions from transport, and at the same time, hydrogen fuel cell technologies promise very low levels of noise and particle pollution from cars ( IEA 2017). A range of socio-cultural barriers to the implementation of hydro- gen technologies in the transport sector needs yet to be overcome ( PetersenandAndersen,2009): awareness, familiarity, and general acceptance of the technologies.
Mobility attitudes of individuals cannot be considered as iso- lated choices of technically or environmentally efficient solutions https://doi.org/10.1016/j.spc.2020.06.010
Acronyms
APA Pollution abatement CBA Cost-benefit analysis CCS Carbon Capture and Storage CO Carbon monoxides
FCV Fuel Cell Vehicle FCV number Number of FCVs GA Genetic algorithms GHG Greenhouse Gas
GWP Global Warming Potential HC Hydrocarbon
HRS Hydrogen refuelling station HSC Hydrogen supply chain
ICEV Internal Combustion engine Vehicle LCA Life cycle assessment
NA Noise abatement NOx Nitrogen oxides NPV Net present value
NSGA Non-dominated sorting genetic algorithm MC Maintenance costs
MCDM Multi-criteria decision-making PD Platinum depletion
PP Purchase price RC Running cost
SMR Steam methane reforming SNPV Social net present value SCBA Social cost-benefit analysis TCO Total cost of ownership
TOPSIS Technique for Order Preference by Similarity to Ideal Solution
VAT Value added tax vkm Vehicle-kilometre
since the deployment of a hydrogen economy for mobility applica- tions involves several stakeholders (consumers, automotive manu- facturers, hydrogen producers, and distributors, filling station own- ers, and policymakers…). Although the risks associated with a fos- sil fuel-oriented transport system have been one of the driving forces behind the development of hydrogen technologies for trans- port, the hydrogen alternative is not considered without risk. For example, some concern has been expressed about the danger of explosion related to onboard storing of hydrogen for cars in high- pressure fuel tanks ( Vieiraetal.,2007).
In that context, the deployment of hydrogen supply chains (HSCs) for market penetration of FCVs has raised a lot of interest. A lot of studies have addressed several issues re- lated to HSC design and deployment ( Agnolucci et al., 2013;
Almansoori and Betancourt-Torcat, 2016; Almansoori and
Shah, 2012; Almaraz et al., 2014; Gondal and Sahir, 2013;
Guillén-Gosálbez etal., 2010; Han etal., 2013; Hugoetal., 2005;
Kamarudin etal., 2009; Kim etal., 2008; Kim andMoon, 2008;
Sabio etal., 2010; Samsatliet al.,2016; Woo etal., 2016) to find the most efficient HSC network taking into account several criteria, that are mainly based on techno-economic consideration, such as the levelized hydrogen cost and environmental assessment with Global Warming Potential (GWP) impact as a key indicator and, in a more systemic way with Life Cycle Assessment (LCA) ( Guillén-Gosálbezetal.,2010; Hugoetal., 2005) as well as a risk index ( Almarazetal.,2014; Hanetal.,2013; KimandMoon,2008;
Sabioetal.,2010).
Even if socio-cultural issues of technological development and energy transition are intertwined with the technological and eco- nomic aspects, socio-cultural criteria are often difficult to be quan-
tified at early development so that they are scarcely integrated into design methodologies despite their importance.
The social aspects of hydrogen usage have so far been ad- dressed mainly either from a qualitative sustainable perspective or at a macroscopic scale to evaluate the social relevance of global scenarios. Firstly, several papers have been focused on hydrogen, as the main actor to make the change to a more sustainable scenario regarding mobility and production of energy ( Afgan etal., 2007;
Chang et al., 2011; Ren etal., 2013; Ren etal., 2013; Hsu, 2013;
Markertetal.,2016). Secondly, a few strategies have been assessed to narrow the gap towards a hydrogen economy ( Qadrdan etal., 2008; Molineretal., 2016; Kelesetal., 2008). The potential of a hydrogen economy and its acceptance in the future have also been investigated compared to other sustainable alternatives ( Ball and Weeda,2015; Riccietal.,2008; Sgobbietal.,2016).
For policy-making and large-scale studies on emission reduc- tion, cost-benefit analysis (CBA) and, in particular, social cost- benefit analysis (SCBA) referring to cases where the project has a broad impact across society has received much attention over the last 20 years, requiring that the benefits are expressed in mone- tary units. Social cost-benefit analysis is a systematic method to survey all the impacts caused by a project encompassing the fi- nancial effects (investment costs, profits …), and the societal ef- fects, like pollution, environment, safety, health, labor market im- pacts, legal aspects …. This is particularly useful for projects, that have both socio-economic and environmental components. Social CBA is scientifically established and widely used in policy impact assessments as highlighted in ( vanderKamp,2019).
To our knowledge, the societal lifetime cost of hydrogen fuel cell vehicles has been first addressed in ( Sun et al., 2010). This work evaluates societal lifetime cost as an important measure for evaluating hydrogen fuel cell vehicles (FCVs) from a societal wel- fare perspective as compared to conventional gasoline vehicles. In this paper, special attention is focused on the comparison of both types of vehicles.
More recently, a social cost-benefit analysis (CBA) for hydro- gen market penetration has been investigated in some significant works: the progressive replacement of gasoline ICEV by hydrogen FCV in the European market over the period 2015-2055 has been assessed in ( Sun etal., 2010; Creti et al., 2015). This study pro- vides a comprehensive support scheme that bridges the gap be- tween three main dimensions: (1)market requirements with the reduced cost of cars and hydrogen fuelling stations, (2)sustainabil- ity and climate requirements, and (3)hydrogen technology devel- opment ( Cantuarias-Villessuzanne etal., 2016) targeting to lower or replace the use of noble materials like platinum in fuel cells and electrolyzers.
On a smaller scale, a techno-economic-financial evaluation of a PV production plant to produce hydrogen to be sold as a feedstock for industries and research centers has been recently proposed in ( Nicitaetal.,2020).
Despite the benefits behind green hydrogen, policy initiatives that help reduce its cost and remove market barriers need to be set up, as highlighted in ( Cretietal.,2015).
Given the challenges of the hydrogen market for mobility, this work presents an SCBA framework to assess the progressive re- placement of ICEVs by hydrogen FCVs in the French market of the Occitania region (part corresponding to the former Midi-Pyrénées region) over the period from 2020 to 2050, supported by the multi-objective optimization framework for HSC design and de- ployment proposed in ( Cantuarias-Villessuzanneetal.,2016).
In the studies about hydrogen mobility CBA studies ( Cretietal., 2015; Cantuarias-Villessuzanne et al., 2016) that are reported in the literature, the hydrogen supply chain encompasses pro- cesses with a “coarse-grained” approach for each technology in- cluding techno-economic and environmental assessment (average
values for cost and carbon emissions for instance). They are more prospective-oriented investigations while this study is more design-oriented for the identification of the components of a sup- ply chain adapted to a specific region. The approach proposed by ( Cantuarias-Villessuzanne etal., 2016) thus considers a hydro- gen production mix of five technologies: steam methane reform- ing (SMR) from natural gas; SMR with carbon capture and storage (CCS); water electrolysis; SMR with biogas and SMR on-site type station.
The contribution of this work is the development of a compre- hensive framework based on a “fine-grained” approach that con- nects the results that have been obtained from multi-objective op- timization and a subsequent multi-criteria decision making for hy- drogen supply chain design with the SCBA evaluation criteria so that a more precise description of the mix of technologies of the different echelons of the supply chain is involved. The scientific ob- jective of this work is thus essentially based on the development of a methodological framework to quantify the potential societal ben- efits of hydrogen fuel cell vehicles. The main interest is to show how, from a methodological point of view, the information from the optimization and decision support approach can be used to feed the SCBA analysis and how the different approaches can in- teract.
The case study that will be proposed is a part of Occitania’s re- gion, the former Midi-Pyrénées: Occitania’s ambition is to become the first Positive Energy Region in Europe and is committed to di- viding by two its energy demand per capita, that is the equiva- lent of a 40% reduction of the energy demand of the Region, and to multiplying by three its renewable energy production, both by 2050. The costs and benefits of the penetration of FCV will be stud- ied here as one solution to achieve this ambition, even some of the data used are not the most accurate that are available.
This paper attempts to answer the following research questions: how can the HSC design strategy integrate an SCBA methodology? What is the magnitude of externalities and other social costs for FCVs as compared to ICEVs? Will the societal benefits of hydrogen and FCVs make these vehicles more competitive with ICEVs? How does this affect transition timing for hydrogen FCVs?
This paper is divided into four sections following this introduc- tion. Section 2presents the methods and tools used in the global framework involving multi-objective optimization framework for HSC design, Multi-Criteria Decision Making (MCDM), and Social Cost-Benefit analysis. Section3is devoted to the application of the methodological framework with the main assumptions used. The results obtained are discussed in Section 4. The conclusions are highlighted in Section5.
2. Methodsandtools
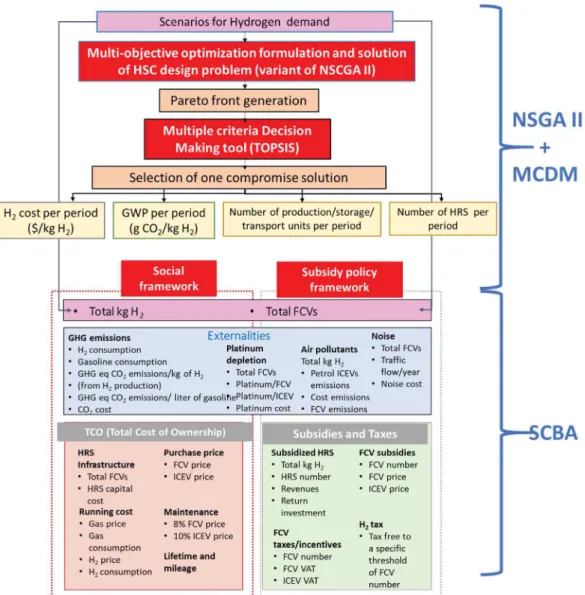
Fig. 1 presents the global framework including the multi- objective optimization formulation for HSC design and deployment model, the Multi-Criteria Decision Making technique used for the selection of a compromise solution, and the SCBA methodology.
2.1. Multi-objectiveoptimizationframeworkforHSCdesign
The first step of the methodology for the determination of the optimal HSC network is based on a multi-objective multi-period demand-oriented model ( OchoaRoblesetal.,2016) using a genetic algorithm to generate the Pareto front.
A general Supply Chain Network (SCN) model for hydrogen is considered (production plants, storage units, distribution grids and demand for each grid) (see Fig.2) The model formulation involves the territory division into districts in which the number, size, and type of production and storage units (integer variables) have to
be determined with the considered objective functions and con- straints as well as the flow rate (continuous variables) of hydro- gen transported into the network. An average distance between the main cities is considered to calculate the delivery distances over the road network. The technical, financial, and environmental data as well as the hydrogen demand are embedded in the model as input parameters.
The assumptions for this study are: - A grid is defined as a territorial division, - The number of grids is known;
- The capacity of the production plants and the storage plants is known;
- The demand for each one of the grids is fixed and known; - It is possible to either import or export hydrogen from/to each
grid;
- Liquid hydrogen transport is achieved by tanker trucks. Even if distribution costs will drop significantly with higher utilization of distribution system infrastructure, and in particular with the usage of existing pipeline networks, this option has not been explored for the case study due to the relatively low hydrogen demand at the regional scale;
- In the model, hydrogen can be produced by either steam methane reforming (SMR) or electrolysis: (1)at or near the site of use in distributed production (DisElectrolysis), or (2)at large facilities and then delivered to the point of use in central pro- duction (Electrolysis).
- The model also computes the number of hydrogen refueling stations (HRS) to be installed.
The modeling approach used one economic objective based on hydrogen total daily cost (TDC) derived from Total Cost of Owner- ship (TCO) and one environmental objective based on GHG (green- house gas) emissions based on Global Warming potential indicator. These two criteria were identified as target criteria in a previous study from which the comparison may be possible among the sce- narios that have been studied (see ( De-LeónAlmarazetal.,2014)). The involved constraints are related to demand satisfaction, the availability of energy sources, production facilities, storage units, transportation modes, and flow rates.
The issue addressed in the paper is formulated as a multi- objective (here bi-objective) problem as most of the practical engi- neering optimization problems. It is well recognized in the ded- icated literature that typical challenges in solving optimization problems include a large number of decision variables as well as a large number of constraints. In addition, in multi-objective opti- mization, a high number of objective functions provides additional challenges for algorithms ( Grecoetal.,2017).
Among these methods, existing evolutionary multi-objective optimization methods, which turned out to be very attractive due to their ability to lead to a well-representative set of Pareto- optimal solutions in a single simulation run, are generally applied only to problems with two to three objective functions. The ma- jor impediments in handling a large number of objectives are re- lated to the stagnation of search process, increased dimension- ality of Pareto-optimal front, and large computational cost. Fur- thermore, several objectives may be redundant so that a multi- objective strategy is not, strictly speaking, necessary.
Multi-objective optimization is part and parcel of the global HSC design framework. The interest of performing the optimiza- tion with Total Cost of Ownership and Global Warming Potential as objective functions is that their evaluation requires fewer parame- ters than for the evaluation of the criterion involved in SCBA, thus reducing uncertainty at the main optimization step of the method- ology. The monetized version (to optimize based on a single pa- rameter) that could be used including all the externalities and not
Fig. 1. General methodology - FCV: Fuel Cell Vehicle; ICEV: Internal Combustion engine Vehicle; NSGA II: Nondominated Sorting Genetic Algorithm II; MCDM: Multi-criteria decision-making; SCBA: social cost-benefit analysis.
only Global Warming Potential has thus not been considered at this level.
All these elements are in favor of the methodology proposed here and justify why the externalities have been added neither to the set of objective functions nor as additional constraints related to SCBA in the optimization phase.
This model has been embedded in an external optimization loop based on a variant of the non-dominated sorting genetic al- gorithm (NSGA-II) to manage multi-objective formulation so that compromise solutions can be produced automatically ( Ochoa Rob-lesetal.,2020).
2.2. Multi-criteriadecisionmaking(MCDM)withTOPSIS
The choice of the HSC configuration that will be selected and proposed to SCBA is performed through a multi-criteria decision- making process. MCDM approaches are major parts of decision theory. The objective is to help decision-makers to learn about the problems they face, and to identify a preferred course of action for a given problem. A large variety of approaches have been proposed in the dedicated literature ( Mardani et al., 2015). Among them, TOPSIS (Technique for Order of Preference by Similarity to Ideal Solution) is a common method used in engineering problems. Its main advantage over other methods is the reduced number of pa- rameters involved in its implementation thus limiting subjectivity. A modified TOPSIS (M-TOPSIS) evaluation is based on the original concept of TOPSIS and proposed by ( Ren etal., 2007) is used. It chooses an alternative that has simultaneously the closest distance from the positive ideal solution and the farthest distance from the negative ideal solution, solving the rank reversal and the evalua- tion failure problem presented in the original TOPSIS technique.
2.3. Socialcost-benefitanalysis(SCBA) 2.3.1. Socialframework
The methodological framework is based on the SCBA proposed by ( Cantuarias-Villessuzanneetal.,2016) that also extends the CBA approach conducted by ( Creti et al., 2015). The interest of using SCBA is to include external costs in order to consider the costs and benefits to society as a whole ( Cantuarias-Villessuzanneetal., 2016): costs and benefits will be considered from a broad, so- cietal perspective as opposed to the « narrow » perspective of individual investors in greenhouse gas reduction activities. The study presented by ( Creti et al., 2015) was applied to the Ger- man market considering the abatement cost of carbon through FCV and various hydrogen production processes while the external costs related to platinum depletion were also included ( Cantuarias-Villessuzanneetal.,2016).
The societal perspective can be applied to a country, a region, e.g. the European Union, or the world. This work sets out to con- sider the perspective of the former region « Midi-Pyrénées » for which the HSC deployment has already been studied before the new region segmentation in France in 2016.
A baseline scenario considering that petrol ICEVs would be the dominant form of vehicles in the future has been implemented for comparison purposes.
Besides, for performing a social cost-benefit analysis of a long- lasting project, several crucial aspects should be addressed: (I) First, benefits and costs at different dates should be aggregated.
For this purpose, a specific discount rate is used to find the present values of future benefits and costs generated. A social discount rate - i.e. a rate of discount appropriate for social cost- benefit analysis of a project - needs to be applied instead of any financial discount rate that is only relevant to the project pro- moters;
(II) Second, external effects need to be identified: based on a lit- erature review ( Sunetal., 2010; Cretietal., 2015; Cantuarias-Villessuzanne et al., 2016; Nicita et al., 2020), the following externalities GHG emissions, platinum depletion, air pollutant, and noise have been considered and their social value is as- sessed: a price per period must be assigned to each externality. (III) Financial (market) prices may be corrected for project accep-
tance: indirect subsidies need to be added and indirect taxation subtracted ( Egenhoferetal.,2006).
(IV) At last, the net present value (NPV) which is the sum of the discounted differences between benefits and costs is referred to as the indicator of the viability of the project. The project should be accepted if the NPV is positive ( Cretietal.,2015) and rejected otherwise. The NPV is calculated as follows:
NPV= n X t=0
(
Bt−Ct)
(
1+i)
t (1)where n is the project duration, i is the discount rate. In this ex- pression, Ctand Bt represent the future cost or benefit in monetary terms at year t.
NPV will be indexed NPVCBA and NPVSCBA when respectively a cost-benefit (or a social cost-benefit) assessment is implemented. NV will refer to the differences between benefits and costs (with- out discounting).
2.3.2. Subsidypolicyframework
The abovementioned discussion has emphasized that the mar- ket penetration of fuel cell vehicles (FCVs) involves different stake- holders. According to the dedicated literature, most economic models describing the introduction of hydrogen-powered vehicles have only focused on one segment of the car market. One signif- icant contribution ( Kelesetal., 2008) models the market penetra- tion of fuel cell vehicles, taking the various stakeholders involved into account: this study highlights that the combination of tax-free hydrogen fuel, subsidies on FCVs, and sufficient hydrogen infras- tructure supply could lead to quick market penetration of FCVs. Although the study proposed in ( Kelesetal.,2008) can be viewed as relatively old, the analysis has been conducted through scenar- ios seeking to represent the key processes driving a transition to a hydrogen-fueled transportation system. So even if the scenario can be considrered as optimistic ( McDowall,2016) it has been used in this study for the sake of illustration of the proposed methodol- ogy that is generic enough to be replicated with updated data. The definition of energy scenarios, and particularly, the role that hydro- gen should play in the future energy mix. is identified by several authors as a challenging task ( Quartonetal.,2019).
The analysis proposed by ( Keles et al., 2008) is particularly meaningful in the sense that it takes into account the actions of the whole market (consumers, automotive manufacturers, filling station owners, and policymakers) and their interactions as well as the corresponding data set. According to our knowledge, no such comprehensive study has been published most recently.
Following the guidelines proposed by ( Keles et al., 2008), the impact of subsidy policies is considered in the social CBA addressed here based on the work reported in ( Cantuarias-Villessuzanneetal.,2016).
2.3.3. SCBAcriteriaassessment
The economic comparison for the social framework is evalu- ated by the Total Cost of Ownership (TCO) method ( Creti et al., 2015). The TCO of replacing petrol ICEVs by FCVs considers the costs over the lifetime of a vehicle, including purchase price (the sum of all costs to deliver the assembled vehicle to the customer), maintenance cost, running cost and HRS infrastructure cost. This economic comparison is based on the difference between buying
Table 1 HSC configuration.
Year 2020 2030 2040 2050
Demand (t per day) 7.90 59.43 138.79 198.17 Number of total production facilities 25 62 92 110 Number of total storage facilities 12 66 150 214 Capital cost
Plants and storage facilities (10 6 €) 304.47 401.53 263.71 43.44
Operating cost
Plants and storage facilities (10 3 € per day) 43.44 307.15 708.68 1013.16
Total daily cost (10 3 € per day) 80.12 489.34 1036.96 1446.56
Cost per kg H 2 ( €) 10.14 8.23 7.47 7.30
Production facilities (t CO 2 -eq per day) 8.27 61.35 142.51 201.91 Storage facilities (t CO 2 -eq per day) 5.56 41.84 97.71 139.51 Total GWP (t CO 2 -eq per day) 13.73 103.18 240.22 341.42 kg CO 2 -eq per kg H 2 1.74 1.74 1.73 1.72
an FCV, including the infrastructure needed, and the conventional case of buying a petrol ICEV ( Cantuarias-Villessuzanneetal.,2016). The
1
TCO is given by the variation of cost of ownership of thevehicle (FCV vs. petrol ICEV) for the purchase price (PP), mainte- nance cost (MC) and running cost (RC), plus the investment on HRS infrastructure (HRSI) per car unit in the market, as shown in Eq.2.
1
TCOt =1
PPt[ICEV−FCV]+1
MCt[ICEV−FCV]+
1
RCt[ICEV−FCV]+HRSIt∀
t∈2020...2050(2)
The purchase price (PP) has been distributed among the differ- ent years included in the lifetime of the vehicles. The running cost (RC) depends on fuel consumption, using the results obtained in
Table1.
The NPV TCOis obtained by the product of
1
TCOtand the num- ber of FCVs in each period, as shown in Eq.3.NPVTCO= n X t=0 1
(
1+i)
t(
1
TCOt ×FCVnumber)
(3)Eq.4expresses SNPV for the social-economic framework.
SNPV= n X t=0 1
(
1+i)
t
−(
1
TCOt×FCVnumber)
+NVCO2abatement−NVplatinumdepletion+NVair pollutionabatement
+NVnoiseabatement
(4)
A similar expression can be proposed for the subsidy-policy frame- work, in Eq.(5) NPVsubsidies = n P t=0 1
(1+i)t[−NVSubsidiesHRS−NVSubsidiesFCVs+NVTaxesFCVs −NVTaxesH2+NVCO2abatement−NVplatinumdepletion
+NVairpollutionabatement+NVnoiseabatement
¤
(5) where: NVSubsidizedHRS= II AI+(
II×M)
−(
Q2020×MG)
(6) NVSubsidiesFCVst=FCVpricet−FCVpaidt (7)NVTaxesFCVs=FCVnumbert×
(
VATICVt−VATFCVt)
(8) NVTaxesH2=³
FCV2020−FCVuntaxed FCV2020 ×Q2020×C2020´
(9) In these expressions:II is the initial investment for the HRS AI is the depreciation period for HRS
M is the maintenance cost in percentage of the II
Q 2020 is the quantity of hydrogen consumed by the FCVs in
2020
MG is the profit margin per kg of H 2 FCV priceis the price of each FCV with VAT FCV paidis is the price of each FCV with VAT FCV numberis the number of FCVs
VAT ICEVis the VAT of the ICEV VAT FCVis the VAT of the FCV
FCV untaxedis the number of untaxed FCVs FCV 2020is the number of FCVs in 2020
C 2020is the H 2cost per kg in 2020 i is the discount rate
3. Applicationsofthemethodologicalframework
3.1. HydrogendemandandFCVmarket
To identify the demand of vehicles for each grid, a study of their evolution in the last 20 years was conducted, and then a weight factor depending on population density was assigned. Finally, fol- lowing the observed trend, a 30 year-prediction has been imple- mented for demand estimate. The categories considered are par- ticular vehicles. The hydrogen demand is a function of the average distance covered in km/year and of the standard fuel economy for each category.
The introduction of FCVs is compared to a business-as-usual scenario considering the existing petrol ICEVs. This work only con- siders passenger vehicles, accounting for almost 90% of the existing vehicles in Europe, and over 60% of the CO 2 emissions from trans- port mobility ( InternationalCouncilonCleanTransportation2016). The number of FCVs (market size) and the hydrogen demand are based on market penetration assessment from ( De-León Al-marazetal.,2014):
FCVnumber=Market penetration×Totalnumber o f
v
ehicles (10)3.2.MainfeaturesofHSCconfigurationforpost-optimalSCBA
The HSC configuration corresponds to the compromise solu- tion obtained from the sequential implementation of the multi- objective optimization procedure and the MCDM technique (see
Table 1), i.e., TOPSIS ( Renet al., 2007) with equal value for cost and environmental criteria.
Even if hydro-electric and wind power are among the top clean energy technologies, their environmental impact can be analyzed, assessed, and compared via a life-cycle assessment approach (in- cluding the manufacturing, construction, operation, and decommis- sioning stage). Due to the importance of Global Warming Potential
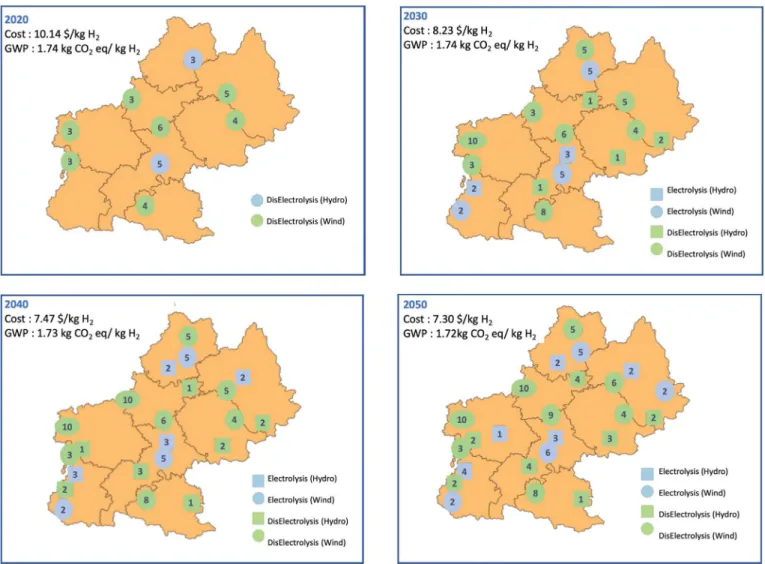
Fig. 3. Maps of the HSC configuration (the number of installed plant is indicated between brackets).
Table 2
Use ratio of energy sources for hydrogen production. Energy sources 2020 2030 2040 2050 Hydro 22% 30% 22% 33%
Wind 78% 70% 78% 67%
in climate change metrics, this indicator has been adopted and its value covers the activities of the entire supply chain.
In the first period (see Fig. 3), the distributed plants are the main source of production, while in the other periods the elec- trolysis plants started to be installed in the grids. There is also no transport between grids (this is also recurrent for the other periods and the HSC is fully decentraliszed) and the CO 2 emissions for the
plants installed remain very low ( Table1) and quite constant. For all the periods, most of the energy sources used stem from wind, with almost the 70% of the electricity produced ( Table2): hydro- gen produced via electrolysis from solar energy (see Appendix) is eliminated in the optimization process since it is the most expen- sive process and exhibits a higher carbon footprint compared to wind and hydro.
Hydrogen produced with electrolysis from a hydro source is the less expensive one (see Appendix for the cost model). It must be emphasized that in Occitania (in particular in former Midi Pyrénées region), hydropower is one main energy source in some departments, (i.e. 950 MWp installed in 130 hydraulic plants in Hautes Pyrénées). Only the run-of-river power plants were con- sidered, as the production of impoundment facilities is essentially
used as a water reservoir, and the pumped storage systems are used for electricity generation during high demand peaks.
3.3. AssumptionsforSCBA
The SCBA analysis that has been conducted is based on the fol- lowing assumptions:
• the average distance per vehicle is 14,0 0 0 km/year ( ACEA2009) , • the lifetime of a vehicle is set at 10 years ( Cretietal.,2015) , • FCV vehicles enter the market in 2020,
• four sizes of HRS are considered: 80, 20 0, 40 0 and 10 0 0kg/day
( Cretietal.,2015) ,
• the lifetime of an HRS is fixed at 15 years ( Cretietal.,2015) , • a discount rate of 5% is considered as in (
Cantuarias-Villessuzanne et al., 2016). A low value for the discount rate is generally adopted in order to promote renewable energies as highlighted in the scenarios presented in ( ADEME2016) and in ( Ferreroetal.,2016).
• the hydrogen demand, the production mix, the CO 2 emissions
(production step), and the production costs are obtained from ( OchoaRoblesetal.,2016),
• the maintenance costs (MC) considered represent 8% and 10%
of the capital costs, for FCVs and petrol ICEVs respectively and are constant over the time period ( Cretietal.,2015),
• a total of 2.3 million car journeys per day in Toulouse, each one
of 7 km was considered ( Thomas,2017). The total vehicle dis- tance per year is 5,876,500 (1000 vkm (vehicle-kilometre)).
Table 3
Noise abatement cost.
Mode Time of the day Urban ( € per 1.0 0 0 vkm) Suburban ( € per 1.0 0 0 vkm) Toulouse Metropolitan ( € per 1.0 0 0 vkm)
Car Day 15.10 0.95 12.27
Night 27.50 1.70 22.34
13.78 Noise abatement cost 1.70
Table 4
Air pollutant assumptions.
ICEV emissions (g/km) Unitary Cost ( €/t)
Nox 0.06 8,419.85
CO 1.00 2,185.93
HC 0.10 3,322.31
• according to ( ‘ToulousePopulation2018’2017), 80% of Toulouse
population is 80% urban and 20% suburban. In the same way, as the distance traveled during the day is longer than during the night, a 0.85-0.15 ratio has been adopted,
• a marginal noise cost of 8.8 and 21.4 €per 10 0 0 vkm, for dense and light traffic respectively, is considered during the day. Dur- ing the night, a cost of 38.9 and 17.7 € per 10 0 0 vkm, for a dense and light traffic respectively, is considered ( Ricardo-AEA 2014). A ratio of 0.5-0.5 for the type of traffic has been adopted,
• the noise reduction for using an EV instead an ICEV is 12.30%
( Iversen, 2015). The noise abatement cost is 1.70 € per 10 0 0 vkm ( Table3),
• the NOx (nitrogen oxides), CO (carbon monoxides), and HC (hy-
drocarbon) emissions for ICEV, and their associated cost are
Table 5
General main assumptions (the running cost is given by multiplying the gasoline price with ICEV efficiency ( Cantuarias-Villessuzanne et al., 2016 in Table 5 ) (with VAT).
Units 2020 2030 2040 2050 FCV efficiency ( Cantuarias-Villessuzanne et al., 2016 ) kg/100km 0.870 0.800 0.7529 0.700 Market penetration ( De León Almaraz, 2014 ) 1% 8% 18% 25% Number of vehicles 31,565 236,744 552,403 789,148 ICEV efficiency ( Cantuarias-Villessuzanne et al., 2016 ) l/100km 6.20 4.88 4.83 4.80
Average carbon price ( Cantuarias-Villessuzanne et al., 2016 )
€/ton CO 2 40 90 130 155
HRS types (Capital cost)
( Creti et al., 2015 ) 80 kg/d 200 kg/d k € 1,000 1,000 872 872 822 822 783 783 400 kg/d 1,732 1,418 1,312 1,235 1,000 kg/d 3,000 2,301 2,121 1,984 HRS types (Units) 80 kg/d 0 0 0 0 200 kg/d 9 58 31 0 400 kg/d 7 44 107 75 1,000 kg/d 6 44 111 182
FCV purchasing cost (20% VAT not included)
( Cantuarias-Villessuzanne et al., 2016 )
k € 37.90 28.90 25.41 23.10
ICEV purchasing cost (20% VAT not included)
( Cantuarias-Villessuzanne et al., 2016 )
k € 21.40 21.10 20.80 20.50
Gasoline price (wo VAT) ( Cantuarias-Villessuzanne et al., 2016 )
€/l 1.35 1.46 1.58 1.71
ICEV running cost
( Cantuarias-Villessuzanne et al., 2016 ) €/km 0.100 0.085 0.092 0.098 ICEV CO 2 emissions ( Cantuarias-Villessuzanne et al., 2016 ) Kg CO 2 /100 km 17.4 13.7 13.6 13.5 FCV Platinum ( Cantuarias-Villessuzanne et al., 2016 ) g/vehicle 35.00 18.70 12.96 10.00 ICEV Platinum ( Cantuarias-Villessuzanne et al., 2016 ) g/vehicle 5.60 5.60 5.60 5.60 Platinum Cost ( Cantuarias-Villessuzanne et al., 2016 ) €/g 19.44 19.44 19.44 19.44 FCV Distance traveled km 4,419,100 33,144,160 77,336,420 110,924,417 Total FCV distance per year 1000 vkm 117,527 881,474 2,056,773 2,938,250
Fig. 4. Consideration of taxes for FCVs and hydrogen fuel.
Table 6
Initial HRS investment.
HRS type Number of HRS Initial Investment (M €)
80 kg/d 0 0.0
200 kg/d 9 13.5
400 kg/d 6 12.0
1000 kg/d 2 6.0
Total 31.5
based on ( Song, 2016) ( Table 4). The FCVs are considered as zero-emission vehicles.
• FCVs and ICEVs are analyzed within the same scope. For both
vehicles, the manufacturing step is not included in the lifecycle assessment.
• Some assumptions concerning the number of FCVs, the cost and
number of HRS, the FCV and ICEV purchasing costs, and addi- tional information are presented in Table5.
The dataset adopted is mainly from ( Cantuarias-Villessuzanne et al., 2016). It must be yet highlighted that more updated values could have been adopted (see for instance ( IEA,2017) for ICEV efficiencies).
In the case of the subsidy-policy framework, the main assumptions have been based on the estimatesperformed in ( Kelesetal.,2008) for the German market (44.4M passenger cars ( Bekker,2016), adjusting the parameters to Midi-Pyrénées (1.58M passenger cars ( DeLeónAlmaraz,2014)):
• 17 subsidized HRSs are implemented before FCV market pene-
tration in 2017 with cumulated hydrogen supplying capacity of 2,133 tonnes/year (Q 2020). The initial investment (II) for the de- ployment of the HRS is 31.5M €, in order to satisfy the required supply capacity ( Table 6). A 8-year depreciation period (AI) is considered for HRS (depreciation of 3.94 M €/year).
• the HRS operational and maintenance costs (M) represent 10%
(of the capital cost) in 2020 and decrease until 9% in 2025,
• a margin of gain (MG) of 2 €is considered for the initial HRS, to
the hydrogen price that allows generating some profits,
• subsidies for FCVs equal the cost difference between FCVs
and petrol ICEVs, minus 2,0 0 0 €. Consumers are willing to pay 2,0 0 0 € more for the ”clean” technology ( Keles et al., 2008) (FCV paidis the price of each FCV with VAT plus 20 0 0),
• hydrogen fuel is completely tax-free until the FCV market rep-
resents 16,667 cars (FCV untaxed). Subsequently, the vehicle tax level is raised, following a linear growth curve, to reach 20% VAT until 33,333 FCVs are sold ( Fig.4),
4. Resultsanddiscussion
4.1. Economicframework
Following the abovementioned guidelines, TCO is evaluated and the results are presented in Table6. The social framework will be compared to this baseline scenario in what follows. From the re- sults of Table 7, FCVs become cost-competitive with petrol ICEVs in 2046.
4.2. Subsidy-policyframework
Incentives to subsidize both HRS and FCV that help stimulate the adoption of fuel cell and hydrogen technologies have been con- sidered ( Table8), including subsidies for HRS, FCV, tax alleviation of hydrogen tax, and of FCV purchase (see the aforementioned assumptions). The equations used to obtain the subsidy-policy framework are those presented in Section2.3.3. From an economic viewpoint, the implementation of the subsidy-policy framework is less favourable.
4.3. Externalities
The externalities are third-party effects caused by hydrogen mobility usage, which are not accounted directly for as a mone- tary cost or benefit.
4.3.1. Greenhousegasemissions
A comparison of GHG emission level between FCVs and petrol ICEVs is performed from the optimization results. Regarding FCVs, GHG emissions are involved for production, storage, and trans- portation of hydrogen (yet no transportation has been observed for the optimal HSC under study). Regarding ICEVs, only the emissions generated during the combustion process have been considered.
Besides, the future carbon prices in EU-28 will be used to cal- culate CO 2 abatement value. The CO 2 abatement is given by the difference of the emissions between FCV and ICEV and the price of CO 2 (in €/ton CO 2). For the case of the FCV emissions, the values from Table1are used ( Eq.10).
CO2abatementt=
(
1
Emissionst)
(
CO2costt)
(10) To calculate CO 2 abatement, an average value of carbon prices in EU-28 has been used. The results show the cumulated CO 2abatement benefits through the different periods ( Table 9). The presence of FCVs contributes to a reduction of 21 × 10 9 kgCO 2 from 2020 to 2050. Moreover, this reduction represents an external social benefit of 42.22 M €(2017) in 2050.
Table 7
Economic comparison.
2020 2030 2040 2050
1HRSI infrastructure €per year year/vehicle € per year -1239.47 -183.42 -116.09 -100.64
1Purchase price -1980.00 -936.00 -552.00 -312.00
1Maintenance cost -892.00 -202.00 48.00 202.00
1Running cost -64,96 -260,18 -340,49 -617,83
1TCO €year/vehicle 4046,51 1061,24 279,60 -407,20
NV TCO M € per year -127,73 -317,95 -238,58 254,16
NPV TCO M € per year -110,34 -168,61 -77,67 50,80
Table 8
Net present economic values for the subsidy-policy framework.
2020 2030 2040 2050 NPV Subsidized HRS M € -10.80 0 0 0 NPV Subsidies for FCVs -474.44 -222.13 -92.77 -15.26 NPV Taxes on FCV purchase -59.04 12.76 11.89 8.48 NPV Taxes on hydrogen -10.14 0 0 0 Total NPV -554.43 -209.37 -80.88 -6.78 Table 9 CO 2 abatement results. 2020 2030 2040 2050 Total FCVs Emissions 10 3 ton CO
2 6.68 46.08 101.19 134.41
Total ICEVs Emissions 10 3 ton CO
2 77.33 451.81 1,051.77 1,497.47
1Emissions 10 3 ton CO
2 70.65 405.73 950.57 1363.06
Average CO 2 price €/ton CO 2 40 90 130 155 NV CO 2 abatement M € in year 2.82 36.51 123.57 211.27 NPV CO 2 abatement M € 2.44 19.36 40.23 42.22
Table 10
Platinum depletion results.
2020 2030 2040 2050
1Platinum depletion M € in year -18.04 -15.33 -13.07 -9.07 NPV platinum depletion M € -15.58 -8.13 -4.25 -1.81
4.3.2. Platinumdepletion
Expensive and insufficient platinum supply could be expected to be a barrier to widespread commercialization of hydrogen FCVs. According to ( Cantuarias-Villessuzanne et al., 2016), the required platinum amount at a European level could reach nearly 600 met- ric tons by 2050, which is three times the current platinum supply. Thus, its scarcity will be calculated by measuring platinum deple- tion.
The mineral depletion is the change in stock value of the min- eral resources and is commonly evaluated by the net price method (the market price minus the marginal extraction cost).
According to ( Cantuarias-Villessuzanneetal.,2016), each gram of platinum extracted is depleting at 19.44 €(2015). This value is considered as constant over the studied period.
Currently, on the one hand, an FCV contains approximately from 30 to 40 g of platinum and a progressive reduction of platinum use down to 10-15 g in 2050 is expected to occur ( Calle-Vallejoetal., 2015). As the fuel cell technology applied to vehicles is quite new, the required amount of platinum is expected to decrease due to technology improvement over the first years and stabilize progres- sively afterwards.
On the other hand, each petrol ICEV consumes 5.6 g of platinum and, given the maturity of the technology involved, this quantity is expected to remain stable during the analysed period.
The platinum depletion ( PD) can be expressed as follows:
PDt=FCVt
(
1
platinumt)
¡
costplatinumt¢
(11)where ( FCVt) is the number of FCVs each year, (
1
platinum) is the discrepancy between the platinum amount used in FCVs and ICEVs and ( costplatinum) is the cost per gram of platinum.Table10presents the results regarding the platinum depletion cost and the cumulative present value of the platinum depletion costs over time. The presence of FCVs generates an external so- cial cost, due to platinum scarcity, of 1.81 M €(2017) from 2020 to 2050.
4.3.3. Airpollutantabatement
Air pollution has important impacts on human health, as well as on the natural and built environments. Through the damage cost methodology, it is possible to predict the impacts of changes in air pollution. These damage costs measure the marginal external costs or benefits caused by each additional tonne of pollutants emitted or avoided and can be used to value the benefits of air quality impacts of certain policies or projects when the only information available is the amount (in tonnes) of a pollutant that is reduced.
The air pollution abatement caused by the deployment of hy- drogen takes into account the emissions of petrol vehicles and FCVs (zero-emission).
The air pollution abatement ( APA) is based in ( Song,2016), and is given by the sum of the abatements of NO x, CO and HC, multi-
Table 11
Air pollution abatement results.
2020 2030 2040 2050
1NOx emissions t NOx 26.51 156.53 361.64 515.79
NOx abatement M € 0.22 1.31 3.04 4.34
1CO emissions t CO 441.91 2608.87 6027.25 8596.46
CO abatement M € 0.96 5.70 13.17 18.79
1HC emissions t HC 44.19 260.89 602.73 859.65 HC abatement M € in year 0.14 0.86 2.00 2.85 NV Air pollution abatement M € in year 1.33 7.88 18.22 25.99 NPV air pollution abatement M € 1.15 4.18 5.93 5.19
Fig. 5. Temporal evolution of monetary cost of externalities (cumulated value) and FCV market deployment.
Table 12
Noise abatement results.
2020 2030 2040 2050 NV Noise abatement cost M € in year 0.19 1.49 3.48 4.98 NPV noise abatement cost M € 0.17 0.79 1.13 0.99
plied by distance traveled by the FCVs ( Eq.12).
APAt =
(
FCVdistance)
[(
1
NOxt)
(
costNOxt)
+(
1
COt)
(
costCOt)
+
(
1
HCt)
(
costHCt)
] (12)Table11presents the temporal evolution of pollution abatement benefits. The introduction of FCVs involves a significant reduction of air pollution from 2020 to 2050. This reduction represents an external social benefit of 5.19 M €(2017) in 2050.
4.3.4. Noiseabatement
The noise emissions generated by road traffic have not been very widely tackled in the CBA literature despite their environmen-
tal concern. Noise exposure is not only a disutility in the sense that it disturbs people, but can also result in health impairments and a loss of productivity and leisure. The reason the problem is growing is a combined effect from greater urbanization and an in- crease in traffic volume. Whereas the increase in traffic volume means higher noise levels, the urbanisation has led to more indi- viduals being exposed to traffic noise ( Ricardo-AEA2014). Accord- ing to this report, several studies have treated this problem by an- alyzing and quantifying the exposure to high noise levels and its consequences.
The external cost of road mobility considering the different modes of transport, the time of the day, the traffic type, and the region (urban, suburban and rural) has been quantified in ( Ricardo-AEA 2014). Annoyance (reflecting the disturbance which individu- als experience when exposed to traffic noise) and health impacts (related to the long-term exposure to noise, mainly stress-related health effects like hypertension and myocardial infarction) are the two major impacts usually considered when assessing noise im- pacts.
Table 13 Social NPV results.
2020 2030 2040 2050 NPV economic comparison TCO M € in year -110,34 -168,61 -63,81 50,80 NPV with externalities CO 2 M € in year 2,44 19,36 40,23 42,22
Platinum depletion -16,78 -10,16 -6,17 -3,05
Air pollution 0,96 3,39 4,86 4,32
Noise 0,17 0,79 1,13 0,99
SNPV M € in year -123,55 -155,23 -23,76 95,28
In the case of fuel cells, as they use no combustion or mov- ing parts, they are quieter than internal combustion engines. FCVs almost entirely eliminate engine noise, and the relatively high- pitched noise electric motors do emit does not propagate that far. Moreover, car horns and sirens could also be made quieter, because they would not have noisy engines. Nonetheless, basic traffic noise is a combination of engine, tire, wind passage and road-noise (dif- ferent surfaces have different noise characteristics).
The noise abatement ( NA) is given by the FCV market share ( %market), the distance traveled by the FCVs ( FCVdistance) and the noise cost ( Iversen,2015) in €per 1.0 0 0 vkm ( Eq.13).
NAt=
(
%markett)
(
FCVdistancet)
(
Costnoise)
(13) The benefits obtained from the noise abatement due to the in- troduction of hydrogen FCVs are shown in Table12. These results are the cumulative noise abatement benefits over the different pe- riods studied, considering the annual FCV market share.These results show that the noise abatement has a relevant im- pact on the overall social analysis, being of a similar order of mag- nitude as the platinum depletion and air pollution. Its external so- cial benefits are of 0.99 M €(2017) in 2050.
4.3.5. Summaryofexternalitycosts/benefits
A summary of the external costs and benefits and their tem- poral evolution is shown in Fig.5. The CO 2abatement showed by far the biggest share. From 2030 to 2050 (with a step of 5 years), it accounts for 154%, 112%, 102%, 98%, and 96% of the externality benefits. The evolution is strongly correlated with the increase in FCV launched in the market for the scenario considered. Platinum is the second-largest externality, yet reducing the benefits obtained
by the CO 2 abatement. From 2035, the positive externalities from
air pollution and noise abatement are almost of the same order of magnitude in absolute value of platinum depletion and compen- sate for its negative cost.
The global benefits obtained from the externalities will have to be compared to the economic costs and the subsidy policies.
4.4.SCBAresultswithoutandwithsubsidy-taxstrategy
The social net-present value is computed, where all the costs and benefits are updated to the base year (2017) (see Table13).
The analysis of SNPV shows that the expenses from the eco- nomic comparison and the platinum depletion are compensated by the benefits of the other externalities in 2050 (50.42 M €(2017)).
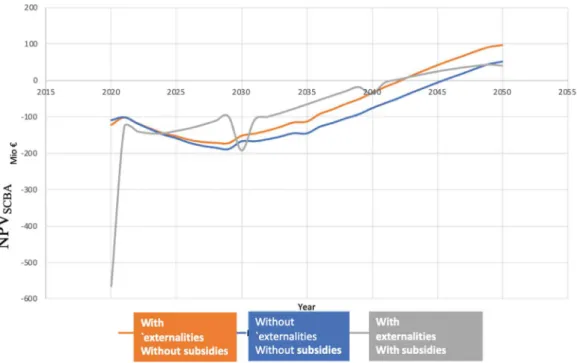
Fig.6shows the evolution of the NPV SCBA over time for the dif- ferent strategies studied.
Without accounting for externalities and subsidies, the cumu- lative net present value needed to bring hydrogen FCVs to life- time cost parity with gasoline vehicles reaches a breakeven point in 2046. Using a societal cost accounting framework with external- ities and without subsidies, hydrogen transition timing is reduced by 3 years.
The results of the subsidy policies NPV are shown in Table14. The expenses related to subsidies and the platinum depletion are balanced by the other externalities. A benefit of 39.82 M € (2017) is generated over the period from 2020 to 2050.
With this framework, the evolution of the benefits vs. cost dif- ference per year starts from a very negative deficit in 2020 (under -550 M €) due to the purchase of FCV supported by the subsidies. Also, as a 10-year average lifetime for FCVs is considered, a
J.O. Robles, C. Azzaro-Pantel and G.M. Garcia et al. / Sustainable Production and Consumption 24 (2020) 105–120
Table 14
NPV SCBA with subsidy policies.
2020 2030 2040 2050 NPV subsidy policies Subsidy for HRS M € in year -2.43 0.00 0.00 0.00
Subsidy for FCVs -474.45 -222.13 -92.77 -15.26 Taxes on FCV purchase -59.05 12.77 11.89 8.48
Taxes on hydrogen -10.14 0.00 0.00 0.00
NPV externalities CO 2 abatement M € in year 2.44 19.36 40.23 42.22 Platinum depletion -15.58 -8.30 -4.25 -1.81 Air pollution abatement 0.96 1.15 4.18 5.93
Noise abatement 0.17 0.79 1.13 0.99
NPV SCBA with subsidy policies M € -566.24 -193.15 -37.83 39.82
ative peak due to FCV fleet renewal occurs from 2030. The year of conversion is 2042 ( Fig.6). The earlier breakeven of the subsidy scenario is due to the higher tax income but the discrepancy is not very significant with the other scenarios.
This study suggests that the payback time is 2043 (socio- economic scenario), 2042 (subsidy-policy scenario), or 2046 (eco- nomic scenario). Our results are broadly consistent with those ob- tained for France in ( Cantuarias-Villessuzanneetal.,2016) in which the value obtained is 2049 (optimistic scenario), 2052 (moderate scenario), or 2054 (conservative scenario).
The subsidies do not make a big difference in the breakeven year (only 3 years).
With a 20% increase in gasoline price conducted in an addi- tional computation, the economic comparison converges in 2044 (economic scenario), or in 2041 (social-economic scenario). The small difference between the original and the increased-price cases can be explained by the scale at which the analysis has been per- formed.
Other externalities as hydrogen risks, supply stability/reliability, energy independence, employment effects, could also be quantified and added to the SCBA framework. The geographical scope could also be widened to the whole country of France to have a national point of view, and other types of vehicles could be incorporated to evaluate the impact of hydrogen mobility.
5. Conclusions
The scientific objectives set out in this study had manifold lev- els that were achieved and presented in this paper.
From a methodological viewpoint, a generic framework has been proposed to quantify the potential societal benefits of hy- drogen fuel cell vehicles (FCVs). For this purpose, the methodol- ogy that was developed in our previous work ( OchoaRoblesetal., 2016) to tackle the Hydrogen Supply Chain (HSC) design problem has been associated with an SCBA as a post-optimal assessment. The global HSC design has been formulated by a multi-objective optimization method. The interest of performing the optimization with Total Cost of Ownership and Global Warming Potential as ob- jective functions is that their evaluation requires far fewer parame- ters than for the evaluation of the criterion involved in SCBA, thus reducing uncertainty at the main optimization step of the method- ology. A post-Pareto approach is then proposed by the application of an MCDM method (TOPSIS) to prune the non-dominated set of solutions obtained by multiple objective optimization so that a compromise solution is then proposed to SCBA.
The cost-benefit analysis of FCEV versus gasoline ICE vehicles was tackled from a methodological viewpoint:
– it starts from a scenario characterized by an exogenously given market size for the deployment of FCEV over the period 2020-2050, (using the Occitania market as an illustration);
– the various cost components associated with this scenario (manufacturing, distribution, fuel, infrastructure…) have been
obtained from multi-objective optimization and multicriteria decision making;
– the relevant externalities have been determined; – a subsidy policy framework has been introduced; – SCBA criteria have been defined.
From the viewpoint of externalities for FCVs as compared to ICEVs, we have considered greenhouse gas emissions due to their contribution in the transport sector with respect to climate change, local air emissions, responsible for particulate matter, ozone and acid rain, noise as well as the use of platinum metal groups in the fuel cell stack, that could lead to platinum depletion. The SCBA ap- proach is then based on the computation of the Total Cost of Own- ership considering these externalities. A subsidy/tax policy frame- work has also been integrated.
CO 2 abatement dominates the externalities and for the case study considered, platinum is the second-largest externality, yet re- ducing the benefits obtained by CO 2 abatement. Nevertheless, the
positive externalities from air pollution and noise abatement al- most reach to compensate for the negative costs caused by plat- inum depletion. The externalities have a positive effect from 2025.
From a socio-economic viewpoint, for the case study consid- ered, the societal benefits of hydrogen and FCVs that make these vehicles more competitive with ICEs are only observed from 2043 (socio-economic scenario), 2042 (subsidy-policy scenario) or 2046 (economic scenario). The subsidies do not make a big difference for transition timing for hydrogen FCVs and are not very efficient.
It must be yet emphasized that the trends observed are depen- dent on the scenario of the case study and the outcomes of the numerical example may not be generalized and could be updated for further study. The analysis has been conducted through scenar- ios seeking to represent the key processes driving a transition to a hydrogen-fueled transportation system. The proposed methodology is generic enough to be replicated with updated data.
Authorshipconformationform
All authors have participated in (a) conception and design, or analysis and interpretation of the data; (b) drafting the article or revising it critically for important intellectual content; and (c) ap- proval of the final version.
This manuscript has not been submitted to, nor is under review at, another journal or other publishing venue.
The authors have no affiliation with any organization with a di- rect or indirect financial interest in the subject matter discussed in the manuscript
The following authors have affiliations with organizations with direct or indirect financial interest in the subject matter discussed in the manuscript.
DeclarationofCompetingInterest None
Table A1
Prices of natural gas and costs of electricity from different sources (2013)
Energy source (Price/unit) 2020 2030 2040 2050 Reference
European price of natural gas ($2010/kg) 0.587 1.300 1.750 ∗ 2.200 For 2030 and 2050 ( IEA 2011 )
Cost of electricity (nuclear) in France ( $2013/kWh ) 0.0439 0.0665 0.089 ∗ 0.112 ∗ For 2020: ( EDF 2013 ) For 2030: ( Percebois et and Mandil, 2013 )
Cost of electricity (PV) France ( $2013/kWh ) 0.328 0.101 0.060 ∗ 0.053 For 2020: ( EDF 2013 ) For 2030 and 2050: ( ADEME 2015 )
Cost of electricity (Wind) France ( $2013/kWh ) 0.073 0.068 ∗ 0.063 ∗ 0.058 For 2020[59] For 2050: ( ADEME 2015 )
Cost of electricity (Hydro) France ( $2013/kWh ) 0.018 0.044 ∗ 0.071 ∗ 0.098 ∗Calculated by interpolation
Table A2
Original UPC values ( De León Almaraz, 2014 ) Production technology UPC ($ per kg)
SMR 3.36
Electrolysis 4.69 DisElectrolysis 6.24
Appendix
In addition to hydrogen demand, one of the most significant pa- rameters is feedstock cost ( OchoaRoblesetal.,2020). In the origi- nal model ( DeLeónAlmaraz,2014), the unit production cost (UPC) of electricity remains fixed for all the time periods whatever the technology, which was a severe simplification. In what follows, an evaluation of UPC is considered taking into account the fixed facil- ity costs (maintenance, labor cost) as well as electricity and feed- stock costs.
TableA1presents the price of electricity produced from differ- ent energy sources and the price of natural gas for conditions in France (2013).
In the original model, UPC is a fixed parameter ( Table A2) which is only dependent on the size of the production unit ($ per
kg H 2). A better vision of UPC is to consider the fixed costs as well
as theelectricity and feedstock costs. The fixed cost is related to labor and maintenance.
All the contributions are reflected in Eq. (A1), where the UPC calculation ($ per kg H 2) is given by the addition of the fixed cost
of a production plant type p size j in period t (FCP ept, $ per kg H 2),
the electricity cost for general usage in a production plant type p
projected for the time period t (EC ept, $ per kg H 2) and the feed-
stock e cost for production plant p type (FSC ept). The FSC eptis ob-
tained by multiplying the feedstock e efficiency in the process p
in time t (kWh elec/kg H 2) by the feedstock e price ($/kWh elec), for
electrolysis process, the feedstock considered is electricity and the energy source cost will vary depending on the type, e.g. fossil vs. renewable ( Eq.A1).
UPCe,p,t=FCPe,p,t+ECe,p,t+FSCe,p,t (A1)
The feedstock cost is likely to gain importance because it de- pends on the energy transition scenario and will induce a cost change of renewable energy impacting the hydrogen cost in the long-time horizon from 2020 to 2050.
The new UPC calculated for the model is presented in
TableA3where hydrogen produced via electrolysis with solar en- ergy is the most expensive, while hydrogen produced with elec- trolysis from a hydraulic source is the less expensive one.
Table A3
UPC calculated with the new costs Production
technology
Fixed cost of production ($ per kg H 2 )
Feedstock cost for production plant ($ per kg H 2 ) Electrical need to produce a kg of H 2 kWh elec /kg H 2 Cost of energy source ($ per kg H 2 ) ∗ UPC ($ per kg H 2 ) 2020 2030 2040 2050 2020 2030 2040 2050 SMR 0.16 0.02 ♦ 4.02 ¥ 3.71 2.61 3.46 4.62 3.89 2.79 3.64 4.80 Electrolysis PV 0.39 0.06 55 18.04 5.56 3.30 2.93 18.49 6.01 3.75 3.38 Wind 0.39 0.06 55 4.00 3.72 3.45 3.17 4.45 4.17 3.90 3.62 Hydro 0.39 0.06 55 0.98 2.44 3.90 5.36 1.43 2.89 4.35 5.81 Nuclear 0.39 0.06 55 2.41 3.66 4.90 6.14 2.86 4.11 5.35 6.59 Dis Electrolysis PV 0.75 0.11 55 18.04 5.56 3.30 2.93 18.90 6.42 4.16 3.79 Wind 0.75 0.11 55 4.00 3.72 3.45 3.17 4.86 4.58 4.31 4.03 Hydro 0.75 0.11 55 0.98 2.44 3.90 5.36 1.84 3.30 4.76 6.22 Nuclear 0.75 0.11 55 2.41 3.66 4.90 6.14 3.27 4.52 5.76 7.00
∗[Energy source cost ($/KWh)x Electrical need to produce a kg of H
2 (kWh elec /kg H 2 )]. ¥ kg/kg H 2 .