Edited by
Claudia Goldin and Lawrence F. Katz
The University of Chicago Press
2018
Women Working Longer
Increased Employment
at Older Ages
vii
Acknowledgments ix
Introduction 1
Claudia Goldin and Lawrence F. Katz I. Transitions over the Life Cycle
1. Women Working Longer: Facts and
Some Explanations 11
Claudia Goldin and Lawrence F. Katz
2. The Return to Work and Women’s
Employment Decisions 55
Nicole Maestas
3. Understanding Why Black Women Are
Not Working Longer 85
Joanna N. Lahey
II. Family Matters: Caregiving, Marriage, and Divorce
4. Changes in Marriage and Divorce as Drivers of Employment and Retirement
of Older Women 113
Claudia Olivetti and Dana Rotz
5. Women Working Longer: Labor Market
Implications of Providing Family Care 157
Sean Fahle and Kathleen McGarry
viii Contents
III. Financial Considerations: Resources, Pensions, and Social Security
6. Older Women’s Labor Market Attachment,
Retirement Planning, and Household Debt 185
Annamaria Lusardi and Olivia S. Mitchell
7. Teaching, Teachers’ Pensions, and Retirement across Recent Cohorts of College- Graduate
Women 217
Maria D. Fitzpatrick
8. The Role of Social Security Benefits in the Initial Increase of Older Women’s
Employment: Evidence from the Social
Security Notch 239
Alexander Gelber, Adam Isen, and Jae Song
9. The Hidden Resources of Women Working Longer: Evidence from Linked
Survey- Administrative Data 269
C. Adam Bee and Joshua Mitchell
Appendix: The Health and Retirement
Study (HRS) 297
Contributors 299
Author Index 301
1
Introduction
Claudia Goldin and Lawrence F. Katz
American women from their fifties to their seventies are working more now than ever. Their increased participation at older ages started in the late 1980s, before the turnaround in older men’s labor force participation and prior to the economic downturns of the first decade of the twenty- first century. Their participation rates when fifty- five to sixty- four years old differ from men’s by less than 10 percentage points, whereas around 1970 they differed by about 40 percentage points (figure I.1). The higher labor force participation of older women is a real trend that has persisted for almost thirty years. It is, moreover, consequential and consists disproportionately of women who are working at full- time, not part- time, jobs. The nine chapters in this volume address the reasons for the increase in the United States and what the future will bring for women working longer.
Many other Organisation for Economic Co- operation and Development (OECD) nations have also experienced growth in the participation of older women. But few have had as large an increase and from as high a level as has the United States for both the sixty- to sixty- four- and the sixty- five- to sixty- nine- year- old groups.
From 1990 to 2015 participation rates for women sixty to sixty- four years old in the United States increased from 36 to 50 percent. Sweden, the only OECD nation with a higher participation rate in 2015 (and considerable
Claudia Goldin is the Henry Lee Professor of Economics at Harvard University and a research associate of the National Bureau of Economic Research. Lawrence F. Katz is the Elisabeth Allison Professor of Economics at Harvard University and a research associate of the National Bureau of Economic Research.
For acknowledgments, sources of research support, and disclosure of the authors’ material financial relationships, if any, please see http:// www .nber .org /chapters /c13797 .ack.
2 Claudia Goldin and Lawrence F. Katz
full- time employment), increased from 53 to 67 percent. Older Japanese women also have significant participation, but they have experienced less change and have a far greater fraction working part time. Most important is that all seven nations in figure I.2, panel A, show significant increases in the participation rate of women sixty to sixty- four years old during the 1990 to 2015 period. For women sixty- five to sixty- nine years old levels are lower, as seen in figure I.2, panel B, but increases for the seven nations have also been large.1
Changes in national retirement rules can have large effects on women’s participation at older ages. For example, Germany passed legislation in 1992 stipulating that by 2004 both men and women would reach their normal retirement ages at sixty- five, rather than earlier for women. German women sixty to sixty- four years old greatly increased their participation around that time, eventually catching up to US participation rates by 2015, as can be
1. Social security regulations in most countries incentivize the retirement age, particularly when replacement rates are high. For country rules concerning normal and early retirement ages and differential treatment of men and women, see Gruber and Wise (1999, 2007) and the US Social Security Administration, “Social Security Programs throughout the World,” https:// www .ssa .gov /policy /docs /progdesc /ssptw/, published in collaboration with the International Social Security Association.
Fig. I.1 Labor force participation rates for males and females ages fifty- five to fifty- nine and sixty to sixty- four (1962 to 2014)
A
Fig. I.2 Female labor force participation rates for seven nations (1990 to 2015). (A) Women ages sixty to sixty-four. (B) Women ages sixty-five to sixty-nine.
Source: OECD Stat Extracts, table LFS, Sex and Age Indicators (http:// stats .oecd .org /Index
.aspx ?DataSetCode = LFS _SEXAGE _I _R).
Notes: The female labor force participation rate is given. Hours of work and the fraction
considered part time varies by country and by year. Using the OECD “common definition” of part- time employment, the fraction working part time among sixty- to sixty- four- year- olds in 2015 was as follows: Canada 0.31, France 0.33, Germany 0.45, Japan 0.48, Sweden 0.18, and the United Kingdom 0.52. The United States is not included in the common definition, but using national definitions it is below the lowest using the common definition, Sweden, for the fifty- five- to sixty- four- year- old group (0.226 for the United States and 0.307 for Sweden using the national definitions).
4 Claudia Goldin and Lawrence F. Katz
seen in figure I.2, panel A. In contrast, the labor force participation rate for German women sixty- five to sixty- nine, that is at or above normal retire-ment age, remains far below the US level, as seen in figure I.2, panel B. In other nations, increased women’s participation at older ages is not as obvi-ously related to a change in retirement regulations or to a decrease in the generosity of social security. What then are the factors mainly responsible for the change?
According to the analysis in the chapter by Claudia Goldin and Law-rence F. Katz, increased labor force participation of women in their older ages (they use fifty- nine to sixty- three years) is part of the general rising trend of cohort labor force participation throughout the life cycle. Women have worked a greater fraction of their years from twenty- five to fifty- four by birth cohort, at least up to the early 1950s cohorts.
Each birth cohort had a higher labor force participation rate than the previous cohorts at fifty- nine to sixty- three years old and the estimated cohort effects are due mainly to increased college graduation and greater accumulated lifetime work experience. Those who remain working at older ages have had a history of more rewarding jobs. In fact, those who continue to be employed, perhaps not surprisingly, reported six to eight years prior that they liked their jobs far more than those who did not persist in the labor force to their early sixties. But will these trends continue?
Job experience between ages twenty- five and fifty- four years rose from around fifteen to twenty- two years between cohorts born in the mid- 1930s to those born in the late 1950s. But accumulated job experience has stopped rising among the most recent cohorts and that could mean that working lon-ger at older ages will slow down. College graduation trends have continued to rise. In addition, participation at older ages for college- graduate women has recently increased beyond what would be predicted by the impact of life cycle experience. Thus, even though accumulated work experience by the most recent cohorts has reached a possibly temporary plateau, more educated women will probably be working even longer in the future. And there will be more of them.
The story told in the Goldin and Katz chapter is a useful overarching statement about the reasons why women are working longer, but it is not a complete one. Other factors can also help explain the rise of women working longer and they supplement the predictions of its future. Many are taken up in the next eight chapters.
The partners of a couple have in the past tended to retire around the same time. But because women are often married to older men, the members of the couple retire at different ages and, in consequence, many married women retire at younger ages than their spouse. That fact is at odds with their sepa-rate pecuniary interests. Because women have longer life expectancies, and often have had shorter careers, the opportunity cost of retirement in terms of the forgone potential earnings and accruals to Social Security wealth may be
Introduction 5 larger for married women. Nicole Maestas finds that the economic returns to additional work beyond midlife are greater for married women than for married men. The potential gain in Social Security wealth alone is enough to place married women on nearly equal footing with married men in terms of Social Security wealth at age seventy. Working longer makes sense for women, particularly in cohorts where education gains have been great and the pecuniary returns to employment are high.
Although most women have been working much longer into their fifties and sixties relative to earlier cohorts, black women have not. At ages fifty to seventy- two black women, recently, have had lower employment rates than similar white women. The fact holds even though these same black women had higher employment rates when they were middle- aged and younger. Furthermore, earlier cohorts of black women did work more than their white counterparts when they were older, although they no longer do so. The chapter by Joanna N. Lahey discusses factors that have contributed to these differential changes by race. She finds that changes in occupation, industry, and health outcomes can explain some of the differences. Black women enter their older years in worse health than white women. Their occupations when younger were more physically taxing and some of these employments have suffered serious declines.
Women’s current marital status and past marital history greatly influ-ence their later- life labor force participation. Claudia Olivetti and Dana Rotz explore the role of marriage by exploiting variation in laws governing divorce across states and over time. They quasi- experimentally identify how the timing of an exogenous increase in divorce risk, caused by the intro-duction of unilateral divorce, has impacted employment and retirement for older women. The spread of unilateral divorce, they find, was associ-ated with cross- cohort differences in the probability of divorce over the life cycle. For women with an ex ante low risk of divorce (using their estimate of “risk”), later exposure to unilateral divorce significantly increased the probability of older age full- time employment and significantly decreased retirement wealth. Thus, these ever- divorced women are working longer remedially. For women with an ex ante high risk of divorce, later exposure to increased divorce risk does not impact full- time employment after age fifty, but is positively associated with investment in education after mar-riage. Those who had previously faced a high risk of divorce acted earlier to safeguard their futures.
At older ages, women face new competing demands on their time in the form of care for elderly family members. Due to increasing life expectancy, women who are now in their fifties and early sixties are more likely than ever before to have a living parent and are thus more likely to be at risk of providing care. Sean Fahle and Kathleen McGarry analyze the preva-lence of the provision of long- term care for women in their preretirement years to see how caregiving affects their employment. They find a significant
6 Claudia Goldin and Lawrence F. Katz
positive trend across cohorts in the need to provide care and a significant negative effect of caregiving on work. Caregiving is estimated to reduce the probability of work by more than 8 percent and the number of hours worked by 4 percent. These research findings imply that increased demands from aging parents and the lack of affordable long- term care options may have a substantial future negative impact on the employment rates of older women. Women have been working longer, but demands from their increas-ingly older surviving parents may provide a competing claim on their time. Various factors such as more lifetime work experience, greater education, more unexpected marital disruption, and fewer children have been found in previous chapters to be of importance in the working longer phenomenon. But surely household finances are also of great importance. Annamaria Lusardi and Olivia S. Mitchell show how retirement wealth plays a key role.
Older women today have more debt than previous cohorts and they have lower savings and wealth. Lusardi and Mitchell show how financial fragility affects employment at older ages. A one standard deviation increase in the ratio of mortgage debt to home value is associated with a 3.4 to 5.5 percent rise in women’s anticipated probability of working at age sixty- five. Women who were more financially literate were more likely to plan for retirement, were less likely to have excessive debt, and were less prone to be financially fragile. Income shocks play a key role in older women’s debt status, but it is not enough to have resources. Women also need the financial literacy and capacity to manage their resources if they are to stay out of debt as they head into retirement.
The college educated are a distinctive group regarding working longer. One reason is that a large fraction of college- graduate women in the past were teachers, but that is no longer the case. About 45 percent of college- graduate women born in the 1930s were teachers at some point in their lives, but just 15 percent have been for women born in the late 1950s. Teachers, for various reasons, retired earlier than those in other employments. Therefore, the decrease in the fraction who are teachers should increase employment at older ages among college- graduate women.
Maria D. Fitzpatrick provides evidence supporting the hypothesis and she shows that older college- educated women who worked as teachers experi-enced lower increases in labor force participation than their counterparts who never taught. Goldin and Katz also estimate similar effects for women who were “ever a teacher.” A main reason explored by Fitzpatrick is that teachers are generally covered by defined- benefit pensions, even more so in the past, and these pensions usually allow workers to retire earlier than Social Security. In addition, the collection of a defined- benefit pension gen-erally requires the individual to leave her current employment. Although such individuals can take up employment elsewhere, particularly in a related line of work, they have generally not done so.
Introduction 7 is the extent to which changes in Social Security generosity have played a role. Alexander Gelber, Adam Isen, and Jae Song estimate the impact of changes in Social Security benefits on women’s employment rates. They can examine the large and sudden end of an inadvertent increase in Social Security bene-fits that occurred when Congress, in 1972, double indexed benebene-fits to both the Consumer Price Index (CPI) and wages. Ending the double indexation in 1977 cut women’s (and men’s) average Old- Age and Survivors Insurance (OASI) benefits substantially in the 1917 birth cohort relative to that of 1916. A “notch” in benefits was then produced by the 1977 Social Security Act amendments and led to sharply different benefits for similar women born just one day apart. Using Social Security Administration microdata on earnings in the full US population by day of birth, Gelber, Isen, and Song find substantial effects of the policy change on older women’s employment rates. The slowdown in the growth of Social Security benefits in the mid- 1980s can account for more than one- quarter of the increased growth of older women’s employment in the subsequent period.
Some of the reasons that have been offered in the preceding chapters for women working longer have emphasized the increase in the positive aspects of employment in one’s older years: better working conditions, ris-ing incomes, and promotions in later years. Other chapters have stressed the constraints on women’s wealth, particularly during the large economic downturn that began in 2008 and the fate of women whose divorces were unanticipated. C. Adam Bee and Joshua Mitchell show that our usual mea-sures of retirement income are understated and that many women who are working longer could retire as previous cohorts had done but choose not to do so.
Despite women’s increased labor force attachment over the life cycle, household surveys such as the Current Population Survey Annual Social and Economic Supplement (CPS- ASEC) do not show increases in retire-ment income such as pensions, 401(k)s, and individual retireretire-ment accounts (IRAs) for women at older ages. Using linked survey- administrative data, Bee and Mitchell demonstrate that retirement incomes are considerably underreported in the CPS- ASEC and that women’s potential retirement income at older ages has been substantially understated. Specifically, the CPS- ASEC shows that median household income for women sixty- five to sixty- nine years old rose 21 percent since the late 1980s, whereas the admin-istrative records show an increase of 58 percent.
In contrast to previous work, the authors find that most women do not experience noticeable drops in income up to five years after claiming Social Security and that retirement income plays an important role in maintaining their overall standard of living. The results of this compelling chapter sug-gest that total income replacement rates for recent female retirees are high. The fact that so many women have continued to work despite having resources to retire reinforces the notion that work in one’s older years has
8 Claudia Goldin and Lawrence F. Katz
taken on a different meaning for women. Women have become about as attached to their métier, calling, and profession as men. Among women fifty- nine to sixty- three years old and currently married to employed husbands, 68 percent are working, up from 52 percent for cohorts born in the 1930s. Among those whose husbands are not working, 45 percent continue to work, up from 35 percent for cohorts born in the 1930s. Some of the chapters point to the possibility that these trends will not continue, but other essays suggest that they will. Only time will tell.
References
Gruber, Jonathan, and David A. Wise, eds. 1999. Social Security and Retirement
around the World. Chicago: University of Chicago Press.
———. 2007. Social Security Programs and Retirement around the World: Fiscal
Implications of Reform. Chicago: University of Chicago Press.
OECD Stat Extracts, Table LFS, Sex and Age Indicators, http:// stats .oecd .org /Index .aspx ?DataSetCode = LFS _SEXAGE _I _R.
US Social Security Administration. “Social Security Programs throughout the World.” Published in collaboration with the International Social Security Asso-ciation. https:// www .ssa .gov /policy /docs /progdesc /ssptw/.
I
11
1
Women Working Longer
Facts and Some Explanations
Claudia Goldin and Lawrence F. Katz
Women have been working longer for a long time in US history. Their labor market participation increased decade after decade during the twentieth century, as more women were drawn into the labor force. But that is an old story. The new story is that a large portion of women are working a lot lon-ger into their sixties and even their seventies. Their increased participation at older ages started in the late 1980s before the turnaround in older men’s labor force participation and before the economic downturns of the first decade of the twenty- first century.1
Claudia Goldin is the Henry Lee Professor of Economics at Harvard University and a research associate of the National Bureau of Economic Research. Lawrence F. Katz is the Elisabeth Allison Professor of Economics at Harvard University and a research associate of the National Bureau of Economic Research.
We are indebted to the University of Michigan, David Wise, and the staff at the NBER, especially Mohan Ramanujan, for enabling use of the restricted- access version of the HRS. We thank our research assistants who labored over the CPS, HRS, and the Social Security earnings files: Amira Abulafi, Natalia Emanuel, Celena (Yuezhou) Huo, and Jonathan Roth. We thank our discussant Katharine Abraham and others at the conference for providing valu-able comments and to Maria Fitzpatrick for the “ever a teacher” varivalu-able code. We gratefully acknowledge the financial support of the Alfred P. Sloan Foundation’s Working Longer pro-gram under grant no. 2013-6-16, “Women Working Longer.” For acknowledgments, sources of research support, and disclosure of the author’s or authors’ material financial relationships, if any, please see http:// www .nber .org /chapters /c13798 .ack.
1. According to OECD data, most nations from around 2000 have had increased labor force participation of women in their sixties. These countries include Canada, France, Germany, Sweden, and the United Kingdom. Increases have also been experienced among women sixty- five to sixty- nine years old. In terms of levels for sixty- to sixty- four- year- olds, the United States and Japan had been the highest but most are now at about the 50 percent level. Levels are much lower for sixty- five- to sixty- nine- year- olds and considerably lower than that for the United States. Other than the United States and possibly Sweden, part- time work is reason-ably high for older women in the nations mentioned. In only a few cases are changes in social security regulations obviously related to these increases. (For the data, see the introduction to
12 Claudia Goldin and Lawrence F. Katz
Women’s increased participation beyond their fifties is a change of real consequence. Rather than being an increase in marginal part- time workers, the higher labor force participation of older women disproportionately con-sists of those working at full- time jobs. Women are remaining on their jobs as they age rather than scaling down or leaving for positions with shorter hours and fewer days.2
Why have women as a group increased their participation at older ages? Increased labor force participation of women in their older ages, we will emphasize, is part of the general increase in cohort labor force participation rates. Successive cohorts, for various reasons, increased their participation at all ages, resulting in an upward shift of participation by birth cohort. As more women graduated from college, held jobs with greater advancement potential, enjoyed their jobs more, were not currently married or were mar-ried to men who also extended employment into their senior years, more remained active in the labor force into their sixties and beyond.
Rising cohort effects in labor force participation across successive birth cohorts of US women are clearly visible in the microdata from the Current Population Survey (CPS) Annual Social and Economic Supplement (ASEC) and the Health and Retirement Survey (HRS). But these cohort effects are considerably dampened when education is considered. Higher participation at all ages has been due to greater levels of education, particularly college graduation. The increase in cohort effects in labor force participation for women in their late fifties and early sixties is also lessened by including work experience at younger ages and by adding information on the main prior occupation. We find some (negative) impact on employment at older ages from having been a teacher and discuss why that is the case.
Most important is that we find that those who “enjoyed” their jobs ear-lier in life remained employed for much longer later in life independent of their hours and earnings on the job six to eight years earlier. The difference between those who agree with the statement about enjoying their job versus those who disagree with the statement is 10 percentage points (on a base of 70) and the effect is twice that between those who strongly disagree with the statement and those who agree. Women who work more hours when fifty- nine to sixty- three years old are far more likely to have worked more hours six years before. But that is in addition to their greater satisfaction in the job earlier and their greater fulfillment contemporaneously. That is clearly not the case for all older workers, but it is the case for most.
Many of the cohorts we consider were those that also experienced greater divorce. Therefore, current marital status is related to employment at older this volume and OECD.STAT, LFS by Sex and Age, Indicators http:// stats .oecd .org /Index .aspx ?DataSetCode = LFS _SEXAGE _I _R.)
2. Maestas (2010) discusses the emergence of nontraditional retirement paths, including the increasing role for planned transitions out of retirement and the greater fraction of those who state they are retired but who have positive and often substantial hours of work.
Women Working Longer: Facts and Some Explanations 13 ages. Because couples often coordinate their work and leisure, current employment of the spouse is an additional correlate of whether a woman is working longer.
Most of the factors just mentioned, particularly educational attainment and earlier employment continuity, were determined prior to the employ-ment decision under question. The addition of these factors almost nullifies the cohort effects, except in one important case. For the most recent cohorts of college- graduate women we can study to their sixties (those born from 1949 to 1955), the predetermined, observable factors do not eliminate the cohort effect. Something else, yet undetermined, is keeping them in the labor force at older ages.
Labor force participation rates of women in their early sixties can be observed today for cohorts born up to the mid- 1950s. Participation rates of forty- and fifty- year- old women born in the late 1950s and early 1960s have not increased relative to those of prior cohorts. Life cycle cohort labor force functions are no longer the humped functions they once were. They have become flat lines, more like those of men than they had been. These flat lines, moreover, have intersected the humped life cycle participation functions of prior cohorts, showing the decrease in participation relative to previous cohorts. But these new and flatter participation functions appear not to be decreasing at older ages relative to prior cohorts. That may indicate that women will continue to work longer even though their participation rates at middle age had stagnated relative to prior cohorts.3
Several factors may operate to offset the stagnation or dip in the par-ticipation of US women in middle age. One of the reasons for the dip in women’s participation in their late thirties and early forties is that women in these cohorts have had their children later. Therefore, the dip had been accompanied by an increase in their participation in their twenties relative to previous cohorts.
We find in our exploration of the correlates of participation that college- graduate women currently in their early sixties have positive cohort effects that remain substantial even after controlling for their earlier life cycle participation rates. Today’s younger women will likely retire later than one would have predicted based on their educational attainment and life cycle participation rates. The finding is particularly noteworthy since female college- graduation rates are continuing to increase by birth cohort.4
3. See Goldin and Mitchell (2017) on changes in life cycle labor force participation. Hurd and Rohwedder (2014) use questions in the HRS on subjective probabilities of employment to predict future labor force participation rates. See also Maestas and Zissimopoulos (2010) for participation forecasts at older ages to 2030 and for an excellent summary of the issues.
4. The college graduation rate (the share with a bachelor’s degree) for women age twenty- five to twenty- nine years increased from 30 percent in 2000 (for the 1971 to 1975 birth cohorts) to 39 percent in 2015 (for the 1986 to 1990 birth cohorts). (See US Department of Education 2015, table 104.20.)
14 Claudia Goldin and Lawrence F. Katz 1.1 Labor Force Participation Rates
1.1.1 By Age, Sex, and Education Level
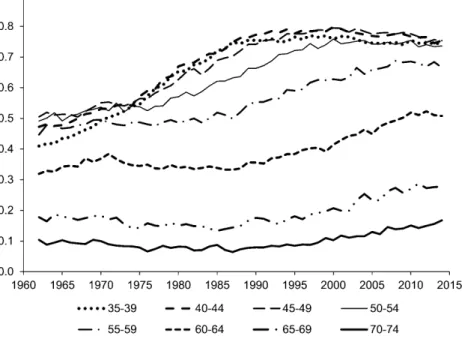
The central facts concerning the labor force participation of women by age are shown in figure 1.1, which uses the March CPS- ASEC microdata samples and gives contemporaneous labor force participation rates during the survey reference week for women by five- year age groups since 1962. Throughout much of the period shown, participation rates increased for women in the thirty- five- to fifty- four- year- old group. The thirty- five- to forty- nine- year- old group flattens out in the early 1990s. In contrast, rates for women fifty- five years and older were flat until the 1980s, when an almost continuous increase ensued, even for the seventy- to seventy- four- year- old group.
The labor force participation data are also given in figure 1.2 for college- graduate women, since school attainment increases by birth cohort. The series is restricted to currently married women because a large fraction of the earlier cohorts of college- graduate women—those born from the 1890s to the 1910s—never married or married late. In consequence, a large frac-tion of college- graduate women, even those who eventually married, never had children and had higher labor force participation rates (Goldin 1997).
Fig. 1.1 Female labor force participation by five- year age groups, 1962 to 2014
Women Working Longer: Facts and Some Explanations 15
Considering only the group who were currently married dampens the selec-tion problem but does not eliminate it because of later marriage ages. Par-ticipation rates for college- graduate women, therefore, decline somewhat over time as their marriage and childbearing rates become more like others in their cohort.
If one ignores cohorts born before around 1920, the series for all women and that for college- graduate women fifty- five years or older are first rela-tively constant and then increase, particularly after the mid- to late 1980s.5
The percentage point increase during the past twenty- five years, shown in table 1.1, is not much different between the aggregate group of women and the college graduates. But because college- graduate women have had consid-erably higher participation rates than less educated women, the shift toward college has increased participation rates for older women and the growth of women’s employment at older ages.
Also clear in table 1.1 is that the increased participation of older women exceeds that of older men in the last twenty- five years, both absolutely and relative to the base levels. Among sixty- to sixty- four- year- old women, for 5. For the sixty- to sixty- four- year- old group, participation rates after 1980 are for individu-als born after 1920.
Fig. 1.2 Female labor force participation by five- year age groups for currently married college graduates, 1965 to 2013 (three- year centered moving averages)
16 Claudia Goldin and Lawrence F. Katz
example, participation increased by 17 percentage points on a base of 34 percent, but for males the increase is just 6 percentage points on a base of 55 percent. The percentage point increase for sixty- five- to sixty- nine- year- old males and females is similar in absolute magnitude, but the initial base for women is far lower (15 versus 26 percent).
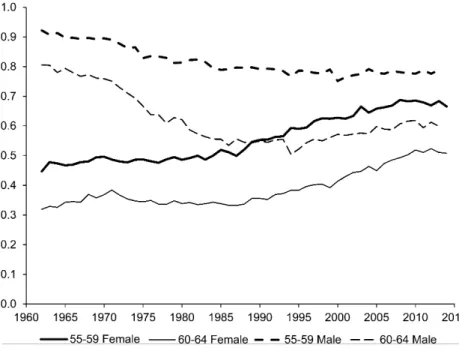
The relative increase for older women has meant that the gender gap in participation at older ages has greatly decreased, as can be seen in figure 1.3. Differences in participation by sex have, of course, decreased more generally. But the absolute percentage point difference at some of the older ages is now smaller than for the younger age groups. For sixty- to sixty- four- year- olds, for example, the difference in participation rates between men and women was about 50 percentage points in 1962. In 2014, the difference was just 9 percentage points, when that for males and females in their thirties to mid-forties was around 16 percentage points.
Table 1.1 Labor force participation rates for males and females, ages fifty- five to
seventy- four: CPS
Age group
Educational group
Labor force
participation rate in Percentage point change c. 1988 to c. 2013 1987–89 2012–14 Women 55–59 All 0.522 0.673 15.1 College graduates 0.685 0.779 9.4
Not college grad. 0.499 0.627 12.8
60–64 All 0.341 0.514 17.3
College graduates 0.454 0.612 15.8
Not college grad. 0.330 0.472 14.3
65–69 All 0.153 0.276 12.3
College graduates 0.240 0.367 12.7
Not college grad. 0.145 0.244 9.9
70–74 All 0.072 0.157 8.6
College graduates 0.130 0.214 8.3
Not college grad. 0.066 0.142 7.5
Men
55–59 All 0.796 0.779 −1.8
College graduates 0.886 0.896 1.0
Not college grad. 0.773 0.728 −4.6
60–64 All 0.548 0.607 5.9
College graduates 0.682 0.727 4.5
Not college grad. 0.516 0.543 2.8
65–69 All 0.258 0.380 12.2
College graduates 0.402 0.491 8.9
Not college grad. 0.231 0.321 9.0
70–74 All 0.155 0.232 7.7
College graduates 0.254 0.324 7.0
Not college grad. 0.141 0.191 5.0
Women Working Longer: Facts and Some Explanations 17
Men and women are doing more of the same things throughout their lives, and this is even truer at older ages. But is that also true within couples? The answer is that, for women fifty- nine to sixty- three years old and presently married, far more of these couples are both currently working than cur-rently retired.6 In addition, in 2014 about as many of these couples had a
wife who was working and a husband who was not than the reverse. More women are working into their sixties and more are coupled with men who are also working. But there are also substantial numbers of women who are working into their sixties even though their husbands are retired. We return to the issue of joint employment and leisure below.
1.1.2 Full- Time versus Part- Time Employment of Women at Older Ages The labor force participation rate for older women increased largely because of an increase in those working full time and full year. The expan-sion of full- time employment among participants has been especially evi-dent for the sixty- five years and older group.
As seen in figure 1.4, the fraction of sixty- five- to sixty- nine- year- old women in the labor force who worked full time and full year increased from
6. This statement is true for HRS couples in which the wife is between fifty- nine and sixty- three years old. For couples in which the woman is sixty- two or sixty- three years old, the statement holds beginning in 2008.
Fig. 1.3 Gender gap in labor force participation at older ages, 1962 to 2014: CPS
18 Claudia Goldin and Lawrence F. Katz
around 30 percent to almost 50 percent, with much of the increase occurring after 2000.7 The fraction of seventy- to seventy- four- year- old labor force
participants working full time and full year increased from 20 percent to almost 40 percent. We emphasize that figure 1.4 gives the fraction working full time, full year among those in the labor force rather than among the population in that age group. Although the timing could indicate the impact of changes in the Social Security earnings test, the increase began before 2000 for both younger and older age groups of women.8
7. The pre- 1970 data also show somewhat high fractions working full time among partici-pants and it is not clear why there was a subsequent decrease.
8. The retirement earnings test was changed in 2000 to apply only to individuals below nor-mal retirement age (NRA). The NRA had been sixty- five, but has been gradually increased to sixty- seven years for those born after 1959. Earnings taxed above the exempt amounts are repaid after NRA. From 1975 to 1982 the upper age was seventy- one and it was decreased to 69 until 2000. See Gelber, Jones, and Sacks (2016) on the retirement earnings test, its history,
Fig. 1.4 Women employed full time, full year among labor force participants during the year, 1963 to 2013: CPS
Source: CPS- ASEC microdata, March 1962 to 2013.
Notes: Both numerator and denominator refer to the calendar year. A “labor force participant
during the year” is anyone who worked during the year. Three- year centered moving averages are shown. Full- time, full- year workers are those who worked forty or more weeks and thirty- five or more hours per week.
Women Working Longer: Facts and Some Explanations 19
1.1.3 Cohort Trends
Increased employment among older women would appear to be related to their increased participation earlier in their lives. The conclusion can be deduced from the fact that all cohorts in figure 1.5, panel A, that have had increased participation in their sixties, relative to earlier cohorts, also had increased participation relative to the same cohorts when they were younger. That is, the cohorts that have begun to “work longer” had higher participa-tion rates throughout their life cycles than did previous cohorts.
Figure 1.5 begins with the cohort born in 1930, but the pattern just men-tioned is evident as well for some of the earlier birth cohorts not shown. However, cohorts born in the early 1920s show no discernible increase in participation among women in their sixties despite modest increases earlier in their lives.9 The data for college graduates given in figure 1.5, panel B,
reveal similar findings, but participation levels are higher.
As will be emphasized later, regressions of the labor force rate at older ages on birth cohort dummies indicate that cohort effects are greatly muted by the addition of various predetermined factors such as education, earlier employ-ment continuity, and women’s past occupations. That is, cohort differences in labor force participation later in life are largely, but not entirely, a function of earlier changes in human capital accumulation. These human capital advances occurred because women perceived that their investments would pay off in the labor market and that their employment would be higher and more continuous than for previous cohorts.
We noted before that the function tracing out life cycle labor force partici-pation was transformed from being hump- shaped to being almost a flat line after the mid- 1950s birth cohorts. Participation rates around age twenty- five to the early thirties greatly increased from the 1930s to the 1950s birth cohorts because women with infants had much higher labor force participa-tion and because the birth rate decreased.
The new flatter cohort life cycle functions have begun to cross each other. The crossing creates an interesting “twist” in participation for the most recent cohorts in figure 1.5, panel A, and more so for college- graduate women in figure 1.5, panel B. The twist is the cohort analog of the oft- mentioned decrease in the participation of women in their thirties and forties.10 One
clear way to see the change is to observe that slicing the cohort graphs at ages and impact. Changes for men may, however, be related to the change in the retirement earnings test (see Gustman and Steinmeier 2009; Mastrobuoni 2009). Gelber, Isen, and Song (chapter 8, this volume) show that a slowdown in the rate of growth of Social Security benefits starting in the mid- 1980s altered women’s retirement.
9. These general trends are also apparent in figure 1.1. For example, the participation line for those sixty- five to sixty- nine years begins to increase around 1987, therefore for women born in the early 1920s.
10. See Goldin and Mitchell (2017) for a discussion of the “new life cycle of women’s employ-ment.”
Fig. 1.5 Labor force participation rates for women by five- year birth cohorts (1930– 34 to 1970– 74) and five- year age groups (ages twenty- five to twenty- nine to seventy- four to seventy- nine): CPS. (A) All education groups. (B) College graduates.
Source: CPS- ASEC microdata, March 1962 to 2013.
Note: Every data point in each graph contains twenty- five birth years and ages.
A
Women Working Longer: Facts and Some Explanations 21 thirty and fifty yields the usual cohort progression. Younger cohorts have higher participation rates than older cohorts. But slicing the cohort graphs in between, say at age forty, does not yield higher rates for the most recent cohorts, such as those born from 1959 to 1973. The cohort lines appear to have twisted.
Does this mean that participation rates for these women in their fifties, sixties, and beyond will also be lower? Their increased education and labor force participation in their younger years would argue the opposite. Why they have decreased participation is still an ongoing research question, although some of the answers concern the delay of births, on the one hand, and an absence of mandated leave policy of more than twelve weeks, on the other. The decrease in participation is not large, but the disruption of the increasing trend is clear and could argue for a break in the increase of women working longer.11
The bottom line for cohort change is that increased participation at older ages has occurred for cohorts that had greater attachment to the labor force throughout their lives. The upshot is that greater attachment to the labor force earlier in the work life means longer employment at older ages. We now turn to using longitudinal information from the HRS matched to Social Security earnings records to understand the role of cohort effects.
Because we rely on the CPS for the general trends and the HRS for anal-ysis, we provide evidence that the HRS reasonably tracks general trends in the CPS for these cohorts and age groups. Appendix tables and figures show the close relationship between CPS and HRS participation rates (fig-ure 1A.1), marital status (table 1A.2), education (table 1A.3), and number of children (figure 1A.2). Labor force participation rates in the HRS and the CPS are almost identical for women in their fifties and sixties; however, the HRS has higher participation rates than the CPS for women in their seventies.12
1.2 Exploring the Role of Cohort Effects Using the HRS
Cohorts born later have higher labor force participation rates at older ages than do those born earlier. We explore whether these cohort effects are
11. Hurd and Rohwedder (2014) note that subjective probabilities of future work at ages sixty- two and sixty- five are reliable predictors of actual employment and that current HRS respondents in their early fifties have subjective probabilities of future work that exceed the actual participation rates of individuals in their sixties. Lusardi and Mitchell (chapter 6, this volume) also find using the HRS that the share of women in their early fifties who anticipate working at age sixty- five continues to rise in recent cohorts, even as women’s labor force partici-pation rates in their early fifties has flattened across cohorts. These findings indicate a further increase in the participation rates of older women.
12. The reason for the difference in participation at older ages is not clear since each survey is supposed to cover those in nursing homes and similar care units. The HRS, in addition, has a lower fraction of women who state they never had a first birth.
22 Claudia Goldin and Lawrence F. Katz
primarily due to changes in factors determined largely prior to the retire-ment option. These variables can include educational attainretire-ment, number and ages of children, and earlier life cycle labor force participation. We will also consider the degree to which the individual had relatively high earn-ings when employed, which we term the “career condition.” These largely predetermined characteristics will be measured in our empirical work prior to around age fifty- five, whereas the retirement option is considered from ages fifty- nine to sixty- three.
The retirement decision may instead be determined primarily by factors that are contemporaneous, such as a set of shocks or transitory factors. These factors may have served to increase participation at older years in the post- 1980s period and may include marital status change, fluctuations in the value of real estate or financial assets, pension losses, reductions in Social Security payments, and deteriorating health status.
The evidence points to a large impact of changes in the predetermined factors. Education reduces cohort differences in labor force participation from ages fifty- nine to sixty- three by about a half. Life cycle labor force participation from thirty- five to forty- four years produces an overshooting of the cohort effects. Our measure of high career earnings does not perform better than the simpler measure of life cycle participation.
Once these variables are considered, adding information on the number and birth years of children has no impact. Children serve to reduce par-ticipation in the twenty- five- to forty- four- year range, but have no sepa-rate effect in later life.13 The many contemporaneous factors mentioned
are related to the variance within cohorts, but do not do much to explain changes across cohorts.
The one interesting anomaly concerns the most recent of the cohorts of college- graduate women that can be followed to their sixties. Those born from 1949 to 1951 have higher participation at ages fifty- nine to sixty- three, even given measures of their life cycle participation prior to age fifty- five and their educational attainment. That is, the cohort effect for the 1949 to 1951 group remains significant even including the various predetermined factors, including life cycle participation.
The finding that later cohorts have higher participation given their ear-lier life cycle participation may be useful in forecasting what more recent cohorts will be doing when they reach their sixties. Recall that labor force participation rates across the life cycle have become relatively flat from ages twenty- five to forty- five, and that the most recent cohorts of women do not always have higher participation compared with previous cohorts. In fact,
13. Lumsdaine and Vermeer (2015) find that a grandchild’s arrival increases the hazard of a woman’s retirement independent of her opportunity cost. It is not clear that the partial or total grandchild effect has decreased with time, thus that it can help to explain the working longer phenomenon.
Women Working Longer: Facts and Some Explanations 23 the most recent data indicate a backtracking of younger cohorts of women in their forties. That is, for the college- graduate group, as well as for others, participation rates have not increased relative to prior cohorts and have even decreased at various ages.
The finding about those born between 1949 and 1951 may indicate that participation rates for even younger cohorts may be higher still in their sixties and seventies than prior generations, at least for college- educated women.
To explore the role of cohort and predetermined variables, data from the Health and Retirement Study (HRS) are used together with information on the earnings history of the respondents from Social Security earnings data and W- 2 forms (starting with 1980).14 Each of the respondents to the
HRS, beginning with the first cohorts in 1992, was asked whether her Social Security earnings history could be linked. If the individual agreed to the linkage, then all past records were linked.15 If not, then the individual was
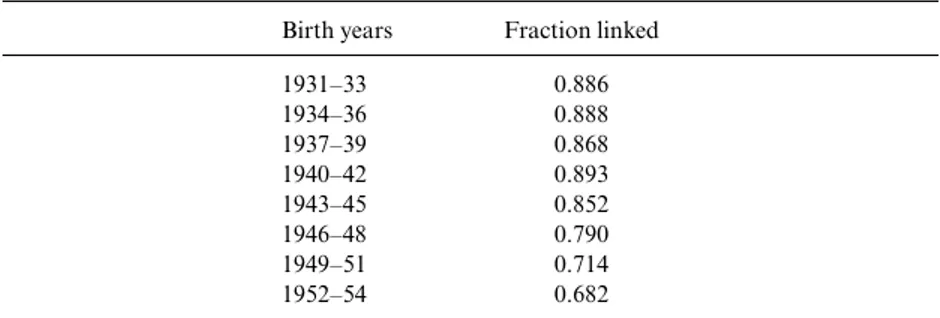
asked again in the subsequent biennial survey. Therefore, the older cohorts had more chances to agree to a linkage than the younger cohorts and linkage rates are higher in consequence.
Across all cohorts about 80 percent of respondents agreed to the linkage with Social Security (and W- 2) records. For birth cohorts from 1931 to 1945 the response rate ranges from 85 to 90 percent; the range is 71 to 79 percent for birth cohorts from 1946 to 1951. (Linkage rates are given in appendix table 1A.1 by birth cohort.) When we use information on life cycle labor force participation, we must restrict the sample to individuals who gave permission to have their Social Security earnings (and W- 2 forms) linked. Otherwise the full HRS sample is used, given age and other restrictions that may apply.
We mainly explore labor force participation rates of women fifty- nine to sixty- three years old and always include three- year birth cohort dummies. We begin in table 1.2, columns (1) to (5) by including characteristics largely determined prior to age fifty- five, such as educational attainment and life cycle participation during various intervals.16 We add in column (6) current
marital status and a summary measure of current health status.
Table 1.3 divides the group into two education levels, college graduates and 14. The W- 2 data are also provided for 1977– 79, but are incomplete in the HRS- SSA linked data.
15. A curious aspect of the HRS is that until 2006 individuals were asked every year if they would continue the linkage to the Social Security earnings data. If at any point they decided not to, the prior data were allowed but the contemporaneous and future data were not. For most HRS respondents, the break in the linkage will not matter since the HRS itself collected information on labor supply and earnings. But the break will matter for a spouse who entered the HRS at a younger age and who was folded when the individual’s birth cohort relevant HRS cohort was added. See the appendix, especially the section “Social Security Earnings Record Linkage in the HRS,” for details.
16. The addition of variables for children ever born adds no explanatory power for older women’s labor force participation after including controls for earlier life cycle participation. Thus, we do not report specifications adding controls for children.
T
able 1.2
Female labor f
or
ce participation at ages fifty-
nine to sixty-
thr
ee, all education gr
oups: HRS Full sample Link ed sample (1) (2) (3) (4) (5) (6) Y ear of birth 1934 –36 −0.00810 −0.0110 −0.0139 −0.0158 −0.0128 −0.0143 (0.0192) (0.0207) (0.0203) (0.0197) (0.0201) (0.0186) 1937 –39 0.0141 0.00448 0.000715 −0.0146 −0.00357 −0.00521 (0.0191) (0.0206) (0.0202) (0.0199) (0.0202) (0.0186) 1940 –42 0.0163 0.0137 −0.00832 −0.0354 −0.0178 −0.0312 (0.0203) (0.0218) (0.0211) (0.0206) (0.0210) (0.0195) 1943 –45 0.0464** 0.0320 −0.00461 −0.0402 −0.0184 −0.0321 (0.0229) (0.0247) (0.0239) (0.0235) (0.0237) (0.0223) 1946 –48 0.0635* 0.0529** 0.00327 −0.0389 −0.0141 −0.0257 (0.0217) (0.0240) (0.0238) (0.0235) (0.0238) (0.0220) 1949 –51 0.0973*** 0.0888*** 0.0300 −0.0110 0.0120 0.000839 (0.0217) (0.0259) (0.0250) (0.0246) (0.0249) (0.0234) High school gr ad. 0.161*** 0.121*** 0.141*** 0.0583*** (0.0180) (0.0176) (0.0180) (0.0171) Some college 0.251*** 0.199*** 0.217*** 0.106*** (0.0205) (0.0202) (0.0207) (0.0195) College gr adua te 0.295*** 0.237*** 0.251*** 0.115*** (0.0252) (0.0252) (0.0260) (0.0250) MA 0.348*** 0.280*** 0.292*** 0.159*** (0.0288) (0.0286) (0.0298) (0.0276) PhD , MD , JD , etc. 0.468*** 0.364*** 0.400*** 0.227*** (0.0458) (0.0453) (0.0458) (0.0451) Life cy cle LFP 35 –44 0.233*** 0.216*** (0.0174) (0.0165)
Car eer cond. 35 –44 0.128*** (0.0195) Curr entl y married −0.157*** (0.0309) Di vor ced 0.0806** (0.0321) W ido w 0.0113 (0.0324) Spouse in LF 0.186*** (0.0146) Health sta tus No No No No No Ye s Age dummies Ye s Ye s Ye s Ye s Ye s Ye s R ace dummies Ye s Ye s Ye s Ye s Ye s Ye s Constant 0.456*** 0.430*** 0.326*** 0.261*** 0.323*** 0.165*** (0.0331) (0.0394) (0.0365) (0.0367) (0.0366) (0.0426) N 18,383 15,431 15,431 15,431 15,431 15,431 R‑ squar ed 0.028 0.029 0.073 0.104 0.082 0.183 S ou rc es : H ea lt h a nd R et ir em en t S tu dy ( H R S) 1 99 2 t o 2 01 2, R A N D v er si on w it h a dd ed v ar ia bl es f ro m o ri gi na l H R S fi le s. S oc ia l S ec ur it y A dm in is tr at io n ea rn in gs (a nd W - 2 ) d at a ar e us ed to c al cu la te li fe c yc le la bo r fo rc e pa rt ic ip at io n (L if e cy cl e L F P < ag es > ) an d th e ca re er c on di ti on (C ar ee r co nd . < ag es > ). N ot es : T he d ep en de nt v ar ia bl e i s 1 if th e w om an is in th e l ab or fo rc e a nd 0 o th er w is e. T he H R S a sk s r es po nd en ts th ei r l ab or fo rc e s ta tu s a nd a w om an is in th e l ab or fo rc e i f s he r ep or te d b ei ng e m pl oy ed o r u ne m pl oy ed a nd s ea rc hi ng fo r w or k. H ea lt h s ta tu s i s s el re po rt ed a nd is c od ed a s 1 if “ go od ” o r b et te r a nd 0 o th er w is e. M ar it al s ta tu s v ar ia bl es r ef er to c ur re nt s ta tu s. “ L if e c yc le L F P < ag es > ” i s t he fr ac ti on o f t he in te rv al th e w om an w as in th e l ab or fo rc e a s d et er -m in ed b y a c om bi na ti on o f th e da ta s ou rc es d es cr ib ed in th e a pp en di x. T he “ lin ke d sa m pl e” in di ca te s th at th e in di vi du al g av e p er m is si on fo r S oc ia l S ec ur it y ea rn in gs d at a t o b e l in ke d. O m it te d b as e g ro up v ar ia bl es a re 1 93 1– 33 b ir th c oh or t, b el ow h ig h s ch oo l g ra du at e ( ov er al l o r f or th e l es th an - c ol le ge - g ra du at e gr ou p) , B A o nl y f or th e c ol le ge - g ra du at e g ro up , n ev er m ar ri ed , o th er ra ce , a nd a ge fi ft ni ne . O m it te d f ro m th e t ab le a re d um m y v ar ia bl es fo r m is si ng v ar ia bl es re ga rd in g s po us e i n l ab or fo rc e, c ar ee r c on di ti on th ir ty - fi ve to fo rt fo ur , a nd h ea lt h s ta tu s. T he re gr es si on s a re w ei gh te d b y H R S p er so n w ei gh ts ; t he w ei gh ts ar e ad ju st ed fo r sa m pl e se le ct io n in to th e lin ke d sa m pl e in c ol um ns (2 ) t o (6 ). S ta nd ar d er ro rs in p ar en th es es h av e be en c lu st er ed a t t he in di vi du al le ve l. ** *S ig ni fic an t a t t he 1 p er ce nt le ve l. ** Si gn ifi ca nt a t t he 5 p er ce nt le ve l. *S ig ni fic an t a t t he 1 0 pe rc en t l ev el .
T
able 1.3
Female labor f
or
ce participation at ages fifty-
nine to sixty- thr ee, by education: HRS Not college gr adua te (1) College gradua te (2) Not college gr adua te (3) College gradua te (4) Not college gr adua te (5) College gradua te (6) Y ear of birth 1934 –36 −0.0234 0.0308 −0.0263 0.0346 −0.0246 0.0390 (0.0219) (0.0522) (0.0212) (0.0506) (0.0200) (0.0472) 1937 –39 −0.00195 0.0182 −0.0218 0.0234 −0.0102 0.0182 (0.0217) (0.0543) (0.0212) (0.0545) (0.0197) (0.0521) 1940 –42 −0.0133 0.0357 −0.0441** 0.0188 −0.0388 0.0160 (0.0231) (0.0515) (0.0223) (0.0506) (0.0212) (0.0475) 1943 –45 −0.0101 0.0509 −0.0468 0.0219 −0.0370 0.0212 (0.0266) (0.0537) (0.0260) (0.0542) (0.0245) (0.0526) 1946 –48 −0.00304 0.0589 −0.0470 0.0235 −0.0345 0.0377 (0.0268) (0.0522) (0.0262) (0.0527) (0.0247) (0.0489) 1949 –51 0.00557 0.126** −0.0389 0.103** −0.0210 0.0980** (0.0291) (0.0498) (0.0287) (0.0504) (0.0272) (0.0486) High school gr ad. 0.158*** 0.115*** 0.0520* (0.0180) (0.0176) (0.0172) Some college 0.249*** 0.193*** 0.101*** (0.0205) (0.0202) (0.0197) MA 0.0502 0.0420 0.0370 (0.0316) (0.0313) (0.0295) PhD , MD , JD , etc. 0.167*** 0.136* 0.111** (0.0483) (0.0492) (0.0489) Life cy cle LFP 35 –44 0.208*** 0.0739 0.192*** 0.0709 (0.0273) (0.0573) (0.0254) (0.0589) Ne ver in LF 35 –44 −0.0548** −0.153** −0.0522** −0.150* (0.0254) (0.0730) (0.0238) (0.0716)
Curr entl y married −0.147*** −0.243*** (0.0350) (0.0649) Di vor ced 0.0613 0.119 (0.0368) (0.0638) W ido w 0.00458 −0.00416 (0.0364) (0.0712) Spouse in LF 0.177*** 0.225*** (0.0160) (0.0357) Health sta tus No No No No Ye s Ye s Age dummies Ye s Ye s Ye s Ye s Ye s Ye s R ace dummies Ye s Ye s Ye s Ye s Ye s Ye s Constant 0.285*** 0.859*** 0.258*** 0.841*** 0.167* 0.638*** (0.0385) (0.0629) (0.0434) (0.0751) (0.0508) (0.0999) N 12,789 2,642 12,789 2,642 12,789 2,642 R‑ squar ed 0.060 0.041 0.097 0.059 0.179 0.140 S ou rc es : H ea lt h a nd R et ir em en t S tu dy ( H R S) 1 99 2 t o 2 01 2, R A N D v er si on w it h a dd ed v ar ia bl es f ro m o ri gi na l H R S fi le s. S oc ia l S ec ur it y A dm in is tr at io n ea rn in gs (a nd W - 2 ) d at a ar e us ed to c al cu la te li fe c yc le la bo r fo rc e pa rt ic ip at io n (L if e cy cl e L F P < ag es > ). N ot es : T he d ep en de nt v ar ia bl e i s 1 if th e w om an is in th e l ab or fo rc e a nd 0 o th er w is e. T he H R S a sk s r es po nd en ts th ei r l ab or fo rc e s ta tu s a nd a w om an is in th e l ab or fo rc e i f s he r ep or te d b ei ng e m pl oy ed o r u ne m pl oy ed a nd s ea rc hi ng fo r w or k. H ea lt h s ta tu s i s s el re po rt ed a nd is c od ed a s 1 if “ go od ” o r b et te r a nd 0 o th er w is e. M ar it al s ta tu s v ar ia bl es r ef er to c ur re nt s ta tu s. “ L if e c yc le L F P < ag es > ” i s t he fr ac ti on o f t he in te rv al th e w om an w as in th e l ab or fo rc e a s d et er -m in ed b y a co m bi na ti on o f th e da ta s ou rc es d es cr ib ed in th e ap pe nd ix . “ N ev er in L F ” is 1 if th e in di vi du al w as r ec or de d as h av in g no y ea rs in th e la bo r fo rc e du ri ng th os e y ea rs . A ll c ol um ns u se th e “ lin ke d s am pl e. ” O m it te d b as e g ro up v ar ia bl es a re 1 93 1– 33 b ir th c oh or t, b el ow h ig h s ch oo l g ra du at e ( ov er al l o r f or th e l es th an - c ol le ge - g ra du at e g ro up ), B A o nl y f or t he c ol le ge - g ra du at e g ro up , n ev er m ar ri ed , o th er r ac e, a nd a ge fi ft ni ne . O m it te d f ro m t he t ab le a re du m m y va ri ab le s fo r m is si ng v ar ia bl es r eg ar di ng s po us e in la bo r fo rc e an d he al th s ta tu s. R eg re ss io ns a re e st im at ed s ep ar at el y fo r co lle ge g ra du at es a nd th os e w ho d id n ot g ra du at e f ro m c ol le ge . C ol le ge - g ra du at e d eg re es b ey on d a b ac he lo r’ s a re a dd ed ( M A , P hD , e tc .) , w he re M A in cl ud es a ll m as te r’ s d eg re es , a nd P hD , M D , J D , a nd s o fo rt h in cl ud es a ll gr ad ua te a nd p ro fe ss io na l d eg re es . F or th os e w ho d id n ot g ra du at e fr om c ol le ge , d um m y va ri ab le s ar e ad de d fo r th os e w it h a h ig h s ch oo l d ip lo m a a nd s om e c ol le ge . T he r eg re ss io ns a re w ei gh te d b y H R S p er so n w ei gh ts a dj us te d f or s am pl e s el ec ti on in to t he li nk ed s am pl e. St an da rd e rr or s in p ar en th es es h av e be en c lu st er ed a t t he in di vi du al le ve l. ** *S ig ni fic an t a t t he 1 p er ce nt le ve l. ** Si gn ifi ca nt a t t he 5 p er ce nt le ve l. *S ig ni fic an t a t t he 1 0 pe rc en t l ev el .
28 Claudia Goldin and Lawrence F. Katz
those who did not graduate college.17 Columns (1) to (4) of table 1.3 include
the predetermined characteristics and columns (5) and (6) add current mari-tal status and health status. Table 1.4 includes only college- graduate women. In addition to the previous variables, we add information on whether the individual was ever a teacher. About 45 percent of college- graduate women in the 1930s cohorts were teachers for much of their working lifetimes, and teachers generally had defined- benefit pensions.
The use of the HRS linked to the Social Security earnings records (called the “linked” sample) reduces the number of observations, less so for the earlier than for the more recent cohorts as previously mentioned. When we use the data with Social Security earnings, we adjust the HRS person weights for selection into the linked sample.18 In tables 1.2 and 1.4, we explore the
sensitivity of the results to using the full HRS sample and the linked sample. Because the HRS is a longitudinal data set, many of the respondents are in the sample more than once between the ages of fifty- nine and sixty- three, and we cluster the standard errors at the individual level. We also include dummy variables for the single- year ages.
In table 1.2, column (1), the baseline regression is provided for the full sample and column (2) gives the baseline for the smaller linked sample. The variables of interest are those showing the effect of birth cohort in three- year bins from 1931 to 1951 (where 1931– 33 is the omitted cohort group).19
The impacts of birth cohort on labor force participation from ages fifty- nine to sixty- three are highly similar between the two samples and both demonstrate the increase in participation at older ages for birth cohorts after 1943 and especially after 1949. The most recent cohort that can be analyzed for the fifty- nine- to sixty- three- year- old group, born from 1949 to 1951, has a participation rate that is around 10 percentage points higher in the full sample (9 for the linked sample) than for cohorts born in the 1930s. The only additional covariates included in the first two columns are single year of age and race dummies.
Educational attainment is added in column (3) and life cycle participa-tion between ages thirty- five and forty- four is included in column (4). The life cycle labor force variables give the fraction of years in the interval that the woman was in the labor force. These have been computed mainly from the restricted- access Social Security earnings data (since 1951) and W- 2 forms (when available). Additional information is used from the HRS to add labor force data for individuals exempt from Social Security taxes,
gener-17. Similar regressions to those in table 1.3 for women fifty- six to fifty- eight years old are in appendix table 1A.5.
18. The adjustment multiplies the person weight by the inverse of the predicted linkage rate, based on individual predetermined characteristics at the time of their birth cohort’s entry into the HRS. Linkage rates are predicted using a logit model for whether the woman allowed the linkage on HRS cohort wave dummies and HRS measures of employment history, race, marital status, education, and financial wealth at HRS cohort entry.
19. The last year of the HRS available is 2012. The 1952– 54 cohort is incomplete and thus is omitted.
Women Working Longer: Facts and Some Explanations 29 ally because they were government employees, such as teachers. The HRS provides information concerning two periods prior to the start of the HRS interviews in which the respondent was a government employee. When HRS survey responses are available regarding participation, they are used in place of Social Security earnings and W- 2 data. (For more details, see appen-dix: “Construction of Variables.”) Various life cycle employment variables were created for each of the three decades from age twenty- five to fifty- four and for the entire period.
The addition of educational attainment eliminates the economic and sta-tistical significance of the cohort coefficients for all but the most recent of the birth cohorts. Although only the linked sample coefficients are given, those for the full sample change in the same manner. The addition of the life cycle participation variable in column (4) further reduces the coefficient for the most recent of the birth cohorts to a slightly negative value. It also produces some modest reduction of the impact of educational attainment since the more educated have greater continuity in employment.
Instead of a variable that measures life cycle participation, one that mea-sures the degree to which a woman reaches some career level may be more important in determining future participation. Since women with greater prior employment when first beginning their careers have greater attachment to the labor force later in the lives, those with higher earnings when employed should have even greater attachment.
To test whether employment per se or years of better earning perfor-mance matter, we create a variable giving the fraction of an age interval that a “career condition” was met. The condition used here is achieving an earnings level that is some fraction (50 percent in this case) of the median earnings of a full- time, year- round male worker for the ten- year age group considered during the relevant period.20 That is, the career condition for a
woman when she was in an age group is judged relative to the earnings of the median male in the same age group during the identical period. Women who were never in the labor force in the age interval are assigned a value of zero, as do those who never earned more than the condition but were in the labor force. We find that the variable giving the career condition (in column [5]) is related to later employment, but less strongly than the simpler variable giving the fraction of the interval a woman was employed.
Column (6) augments the column (4) specification by adding two con-temporaneous variables: current marital status and current health status. The birth cohort coefficients were already extinguished with controls for
20. Earnings of the median male, in the same age group and year, are used. These data are available in published documents (US Census Bureau P‑ 60 Reports) prior to the microdata for the CPS, which begins in 1962. The calculation of all the career conditions considered requires data from 1956 (1931 + twenty- five years). A fraction of the male median is used because the median is too high a bar for employed women during much of the period considered. Women in the exempt occupations are assumed to exceed the bar. See appendix: “Health and Retirement Survey: Construction of Variables.”
30 Claudia Goldin and Lawrence F. Katz
education and earlier life cycle participation, and the added contemporane-ous variables have little further impact on the cohort effects. The addition of health status reduces the impact of education and, in most instances, almost halves the schooling- level coefficients in column (4). The more highly educated are also the healthiest or, at least, they consider themselves to be so. The coefficient on earlier life cycle participation remains substantial and is only slightly reduced.
It is useful to explore the impact of current marital status even if it does little to change the birth cohort coefficients. Being currently married decreases participation for older women, but the effect is reduced if the woman’s spouse is employed and the total impact is about equal to that of the omitted group (never married) and to widowed women.21 Divorced
women have participation rates about 8 percentage points higher than the base group of never married women.22
Disaggregating by education, as in table 1.3, reveals substantial differences between the higher (college graduate) and lower (below a college graduate) educated groups in the correlates of their later employment. Note that within the college- graduate group, dummy variables are added for degrees above the bachelor’s (MA and the various graduate and professional degrees) and, within the noncollege group, dummy variables are added for high school diploma and having some college.
The regressions in columns (1) and (2) of table 1.3 include only cohort effects (plus age, race, and education dummies). Cohort effects for college graduates (relative to the 1931– 33 cohorts) are modest, but the most recent of the cohorts has a participation rate about 12.6 percentage points higher. For the group that did not graduate from college, cohort effects are insub-stantial. Because there was upgrading within each of the education groups as more attended college, participation rates for the entire group increased by birth cohort, even though within each of the groups there was no birth cohort trend.
In columns (3) and (4) we add life cycle participation variables, including whether the woman was never in the labor force during the interval. The addition of the life cycle measures has little impact on the cohort effect for the college- graduate women born most recently. Earlier labor force partici-pation matters more for the less educated group than for the college edu-cated. For college graduates, what matters most is whether the women did not work at all in the interval, even though that group is small. The much higher labor force participation for the 1949– 51 cohort of college- graduate women remains unexplained, even with controls for current marital and health status, as seen in column (6).
Last, table 1.4 looks in more depth at college graduates in part because
21. We discuss, below, changes in the joint employment and retirement of couples. 22. Note that the mean labor force participation rate for a woman age fifty- nine, who is other race and in the 1931– 33 birth cohort, is given by the constant term in column (2).
Table 1.4 Labor force participation among college- graduate women at ages fifty- nine to sixty- three: HRS
Full
sample Linked sample
(1) (2) (3) (4) (5) Year of birth 1934–36 0.00774 0.0272 0.0308 0.0458 0.0294 (0.0497) (0.0524) (0.0507) (0.0470) (0.0508) 1937–39 0.00217 0.0169 0.0221 0.0212 0.00996 (0.0503) (0.0543) (0.0544) (0.0508) (0.0538) 1940–42 0.0389 0.0327 0.0154 0.0193 0.00204 (0.0484) (0.0518) (0.0508) (0.0473) (0.0509) 1943–45 0.0370 0.0402 0.00983 0.0179 −0.0172 (0.0503) (0.0541) (0.0543) (0.0526) (0.0550) 1946–48 0.0465 0.0482 0.0114 0.0110 −0.0256 (0.0475) (0.0525) (0.0528) (0.0503) (0.0544) 1949–51 0.0957** 0.117** 0.0931 0.105** 0.0524 (0.0452) (0.0500) (0.0505) (0.0460) (0.0510) Ever a teacher −0.0477 −0.0483 −0.0545 −0.0892* −0.0591 (0.0288) (0.0315) (0.0309) (0.0294) (0.0305) MA 0.0538 0.0578 0.0504 0.0381 0.0405 (0.0296) (0.0326) (0.0322) (0.0306) (0.0319) PhD, MD, JD, etc. 0.160*** 0.164*** 0.133* 0.107* 0.111** (0.0447) (0.0470) (0.0479) (0.0411) (0.0461) Life cycle LFP 35–44 0.0673 (0.0573) Never in LF 35–44 −0.164** (0.0731) Life cycle LFP 45–54 0.379*** (0.0710) Never in LF 45–54 −0.178 (0.0973) Life cycle LFP 25–54 0.355*** (0.0655) Health status No No No No No
Age dummies Yes Yes Yes Yes Yes
Race dummies Yes Yes Yes Yes Yes
Marital status dummies Yes Yes Yes Yes Yes
Job status of husband Yes Yes Yes Yes Yes
Constant 0.855*** 0.876*** 0.866*** 0.580*** 0.675*** (0.0591) (0.0629) (0.0755) (0.0857) (0.0708)
N 3,137 2,642 2,642 2,642 2,642
R‑squared 0.040 0.044 0.062 0.141 0.080
Sources: Health and Retirement Study (HRS) 1992 to 2012, RAND version with added variables from
original HRS files. Social Security Administration earnings (and W- 2) data are used to calculate life cycle labor force participation (Life cycle LFP <ages>) and the career condition (Career cond. <ages>).