Abstract— A numerical study on non-premixed combustion methane/air and biogas/air mixture in swirl combustor is performed. In this study the inlet velocity, NO and temperature of fuel and combustor geometry and size are kept to be the same but the effect on the variation of CO2 dilution is observed. Results of this simulation show as the CO2 dilution rate increases, flame temperature, NO and combustion velocity decreases.
Keywords— Flame, Non-premixed, Biogas, NO, Methane, CO2 dilution.
I. INTRODUCTION
he turbines are widely used in modern industry to deliver shaft power or thrust power. The combustor is part of the gas turbine. The main goal of the combustor design is lower emissions with less volume. Flow field simulation in the combustor is a challenging subject to both academics and industries. It is of commercial importance to understand and to predict various phenomena in the combustor. Gas turbine combustion systems need to be designed and developed to meet many mutually conflicting design requirements, including high combustion efficiency over a wide operating envelope and low NOx emission, low smoke, low lean flame stability limits and good starting characteristics; low combustion system pressure loss, low pattern factor, and sufficient cooling air to maintain low wall temperature levels and gradients commensurate with structural durability. The use of alternative fuels in gas turbine combustion chambers can provide advantages such as lower environmental impact. Combustion phenomenon will be accomplished effectively by the development of low emission combustor. One of the significant factors influencing the entire Combustion process is the mixing between a swirling primary air and the non-swirling fuel. To study this fundamental flow, the chamber had to be designed in such a manner that the combustion process to sustain itself in a A. Guessab, Ecole Nationale Polytechnique d’Oran, Algérie, 31000. Départment de Genie Mécanique, Oran (e-mail: [email protected]).
A. Aris, Ecole Nationale Polytechnique d’Oran, Algérie, 31000. Départment de Génie Mécanique (e-mail: [email protected]).
T. Benabdallah, Industrial Products Systems Innovation (PSIL), ENP, Oran, Algeria, 31000. Department of mechanical, (corresponding author: e-mail: [email protected], Phone: 00213555582016).
N. Chami, Industrial Products Systems Innovation (IPSIL.), ENPO, Algeria.
continuous manner and the temperature of the products is sufficiently below the maximum working temperature in the turbine. This study is used to develop the effective combustion with low unburned combustion products by adopting the concept of high swirl flow and motility of holes in the secondary chamber. The proper selection of a swirler is needed to reduce emission which can be concluded from the emission of NOx and CO2. The capture of CO2 is necessary to mitigate CO2 emissions from natural gas. Thus the suppression of unburned gases is a meaningful objective for the development of high performance combustor without affecting turbine blade temperature.
The combustion of methane-air mixture in gas turbine can-type combustion chamber was experimented numerically by Pathan et al. [1], Koutmos and McGuirk [2], Ghenai [3], Eldrainy et al. [4].
Research on the effect of CO2 dilution on methane originated simply from the notion that biogas comprised of methane with CO2 exist on different amount dependent on the gas origin and the on mechanism how the gas is naturally produced. First, by adding CO2 into the methane flow in the combustor, reduction of NOx emissions occurs due to recirculation of hot product and thus reduction of the flame temperature [5]. Second, adding different amount of CO2 into methane simulates the existence of fuel gases such as biogas in the process of combustion in the combustor [6].
Third reason is carbon capturing and sequestration technologies which are becoming mandatory in order to reduce CO2 emissions into the atmosphere to combat global warming and climate change [7-8]. And finally, choosing biogas as a fuel in combustion based power generators has long term economic advantages.
In this paper, modifications of the gas turbine can-type combustion chamber are investigated in order to reduce NOx emissions with biogas operation. The impact of modifications on air-fuel mixing, temperature field and NO volumetric formation rate was evaluated using a CFD 3D RANS reactive procedure validated by comparison with the natural gas data. The FLUENT commercial code was employed for numerical simulations. Simulations show that the proposed modifications could reduce NO emissions up to 30%.
Numerical Investigation of Methane-air Mixture
with CO
2
Dilution (in Fuel, first air and second
air inlet) in a Gas Turbine Combustor Chamber
Guessab A., Aris A., Benabdallah T. and Cheikh M.
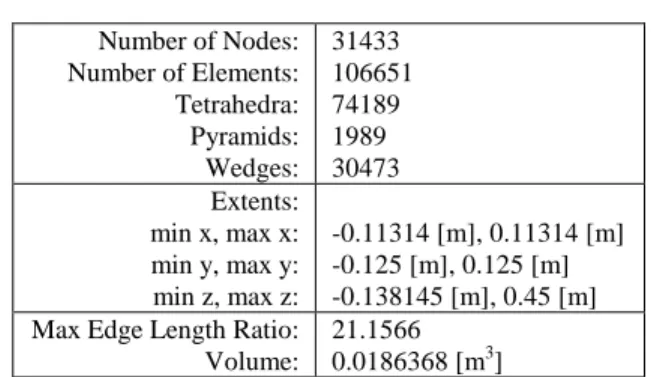
II. MODEL DESCRIPTION AND SIMULATION DETAIL The basic geometry of the gas turbine can-type combustor chamber is shown in Fig. 1. The size of the combustor is 590 mm in the Z direction, 250 mm in the Y direction, and 230 mm in the X direction (Fig. 2). The primary inlet air is guided by vanes to give the air a swirling velocity component. The total surface area of primary main air inlet is 57 cm2. The fuel is injected through six fuel inlets in the swirling primary air flow. There are six small fuel inlets, each with a surface area of 0.14 cm2. The secondary air is injected in the combustion chamber through six side air inlets each with an area of 2cm2. The secondary air or dilution air is injected at 0.1 m from the fuel injector to control the flame temperature and NOx emissions. The can-type combustor outlet has a rectangular shape with an area of 0.0150 m2. In the present study, unstructured grid has been employed due to the complexity of geometry combustor. The 3-D modeling of the combustor has been done using the pre-processors Gambit (Figs. 3 and 4) [5]. A simplified 3-dimensional solid model has been built and used to generate the computational grid. The resulting solid model is shown in Figure 1. It was constructed from the dimensions shown in Figure 2. The mesh is generated by automatic method and its main quality specifications are summarized in Table I. The geometry is complex and consists of five separate solid bodies.
Fig. 1 Solid model of combustor flow domain
Fig. 2 Dimensions of combustor flow domain. All dimensions are in mm.
Fig. 3 Combustor computational mesh.
Fig. 4 Mech geometry of gas turbine can combustor (midaxial vertical plane).
Table I: Mesh statistics Number of Nodes: Number of Elements: Tetrahedra: Pyramids: Wedges: 31433 106651 74189 1989 30473 Extents: min x, max x: min y, max y: min z, max z: -0.11314 [m], 0.11314 [m] -0.125 [m], 0.125 [m] -0.138145 [m], 0.45 [m] Max Edge Length Ratio:
Volume:
21.1566 0.0186368 [m3]
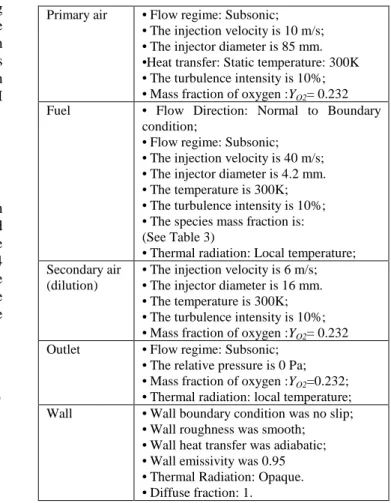
The boundary values are corresponding to different operating conditions. In the model domain, it consists of three inlets, one outlet and the remaining wall. The applied for this numerical simulation of gas turbine can-type combustion chamber are: The velocity boundary condition is used to define the flow velocity along with all relevant scalar properties of the flow at the flow inlet. The velocity magnitude and direction, the velocity components or the velocity magnitude normal to the boundary specifies flow inlet velocity. These values were taken from rig tests simulating combustor conditions following a gas turbine engine. The outlet boundary condition is used to model the flow at exit where the details of the flow velocity and pressure are not known prior to solving the problem. As these variables were not known for the case under study, the outlet boundary condition was applied for the combustor exit. When this condition was specified, the code extrapolated the required information from the interior. In the present study, Outlets were set as pressure outlets with 0 Pa (gauge pressure)
for combustor outlet, mass flows were calculated accordingly. In any flow, Reynolds number of the flow becomes very low and turbulent fluctuations are damped considerably, near the walls. The laminar viscosity starts to play a significant role. In the present case, walls were assumed to be adiabatic with no-slip condition. The standard wall functions were used to calculate the variables at the near wallcells and the corresponding quantities on the wall. The swirl components were directly introduced in the swirler air flow using ANSY Fluent 14 settings. The finite volume method and the second-order upwind method were used to solve the governing equations. The convergence criteria were set to 10-4 for the mass, momentum, turbulent kinetic energy and the dissipation rate of the turbulent kinetic energy and the chemical species conservation equations. For the energy and the pollution equations, the convergence criteria were set to 10-6. Table II lists the numerical conditions.
III. GOVERNMENT EQUATIONS
In this paper we will present a simulation of a combustion process inside a gas turbine combustor, showing the NO and CO2 formation zones. For this simulation we’ve used the ANSYS FLUENT software. The ANSYS FLUENT 14 solver [10] is used to solve the governing equations for the turbulent non-premixed combustion flame. Based on the assumptions mentioned above, the governing equations are given as follows [10]:
( )
=0 • ∇ ρV (1)(
)
i ij i j j x P u u x ∂ ∂ − = − ∂ ∂ ρ τ (2) ' ' 3 2 j i ij k k i j j i ij uu x u x u x u ρ δ µ µ τ − ∂ ∂ − ∂ ∂ + ∂ ∂ = (3)(
)
(
)
( )
i ij h j eff i u S x T k h u + ∂ ∂ + ∇ • ∇ = • ∇ ρ τ (4) t P t eff C k k Pr µ + = (5)(
)
i i j i j i j j M x Y D x Y u x ρ ρ + ω ∂ ∂ ∂ ∂ = ∂ ∂ (6)Where Yi represents mass fraction for mixture gas of CH4, O2, CO2, CO, H2O and inert N2. The term Miωiis the mass production rate of species. M is the molecular weight of i-th i
species. ωiis the reaction rate. Gas thermal conductivity, kt is derived from Prandtl number as:
t P k C µ = Pr (7) In this work, Pr = 0.07 is selected.
The diffusion coefficient, D, is calculated by Schmidt number: D
Sc= µ (8) In this work, Sc=0.7 is selected.
The flow model considered in the present investigation is based on 3-D situation, steady state and turbulence closure model for RANS. However, the utilized model for governing turbulence-chemistry interaction is the eddy dissipation concept (EDC). ANSYS Fluent CFD modeling is based on solving transport equations for continuity, momentum, energy and species conservation with the use of Reynolds decomposition method.
Table II: Inlet boundary conditions. Primary air • Flow regime: Subsonic;
• The injection velocity is 10 m/s; • The injector diameter is 85 mm. •Heat transfer: Static temperature: 300K • The turbulence intensity is 10%; • Mass fraction of oxygen :YO2= 0.232
Fuel • Flow Direction: Normal to Boundary condition;
• Flow regime: Subsonic; • The injection velocity is 40 m/s; • The injector diameter is 4.2 mm. • The temperature is 300K; • The turbulence intensity is 10%; • The species mass fraction is: (See Table 3)
• Thermal radiation: Local temperature; Secondary air
(dilution)
• The injection velocity is 6 m/s; • The injector diameter is 16 mm. • The temperature is 300K; • The turbulence intensity is 10%; • Mass fraction of oxygen :YO2= 0.232
Outlet • Flow regime: Subsonic; • The relative pressure is 0 Pa; • Mass fraction of oxygen :YO2=0.232;
• Thermal radiation: local temperature; Wall • Wall boundary condition was no slip;
• Wall roughness was smooth; • Wall heat transfer was adiabatic; • Wall emissivity was 0.95 • Thermal Radiation: Opaque. • Diffuse fraction: 1.
Closure for the Reynolds stress terms in the government equations were achieved using the RNG k-ε turbulence model.
The RNG k-ε model was derived using a rigorous statistical technique called renormalization group theory (RNG) [10]. It is similar in form to the standard k-ε model, but includes the
effect of swirl on turbulence for swirling flows. The model adopted here is based on the research results of Launder and Spalding which was referred in the sample model of a micro gas turbine engine in CFD-ACE+Manual. The transport equations for the RNG k-ε model are as follows:
The Realizable k-ε turbulence model was used. However, the model has many advantages for flow simulation including strong streamline curvature, vortices, rotations, and the spreading rate of planner and round jets. In the realizable k-ε turbulence model, k transport equation is the same as in Standard k-ε model, while the ε equation in this model differs from that of Standard k-ε model and is written as follows:
(
)
b i t i i i G C k C k C x x u x ε ε ε ε νε ε ρ ε σ µ µ ρε 3 1 2 2 + + − ∂ ∂ + ∂ ∂ = ∂ ∂ (9)In the realizable k-ε model, Cµ is not a constant and it is defined as: + = • ε µ kU A A C s 0 1 (10)
Finally, the constants are: 44
. 1 1ε =
C , C2=1.9, σε =1.2 and σk=1.0
The influence of turbulence on the reaction rate is taken into account by employing the Magnussen model [8]. In this model, the rate reaction Ri’,k is given by smaller (i.e., limiting value) of the two expressions below:
= R k R R i k i k i M Y k A M R . ' . ' ˆ , , ,' υ ε ρ υ (11) =
∑
∑
' , ' ' , , ' . ' ' . ' ˆ j k j N j P P i k i k i M Y k AB M R υ ε ρ υ (12) WhereYP represents the mass fraction of any product species
YR represents the mass fraction of a particular reactant
M represents the molecular mass of species A an empirical constant equal to 4.0 B an empirical constant equal to 0.5
The EDM relates the rate of reaction to the rate of dissipation of the reactant and product containing eddies. (k/ε) represents the time scale of the turbulent eddies following the Eddy dissipation model (EDM) of Patankar [9]. The model is useful for prediction of premixed and diffusion problems as well as for partially premixed reacting flows. The Air and fuel within the internal combustor flow field was modeled as a reacting, variable composition mixture. The two-step of Westbrook and Dryer [14] was used to compute the rate of fuel oxidation.
(
)
2 2 2 2 2 4 5 . 11 4 2 76 . 3 3 22 . 0 2 N O H CO N O N CH + + → + + + (13)(
2 3.6 2)
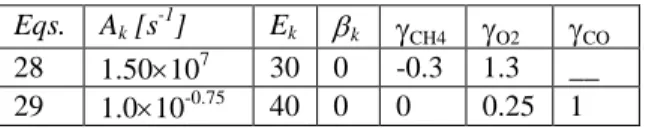
2 2 3.76 2 2CO+ O + N → CO + N (14)The constants of Arrhenius equations (3) and (4), reactions, the value of the pre-exponential factor, temperature exponent and activation energy for each reaction and the exponent rate for each species are reported in Table III.
Table III: The constants of the Arrhenius equations.
Eqs. Ak [s-1] Ek βk
γ
CH4γ
O2γ
CO 28 1.50×10⁷ 30 0 -0.3 1.3 __ 29 1.0×10-0.75 40 0 0 0.25 1IV. ZELDOVITCH REACTION AND NOX FORMATION
There are two mechanisms that create NOx in gas turbine combustor:
• Thermal NOx, which is the oxidation of atmospheric bound nitrogen in the combustion air.
• The conversion of fuel bound nitrogen into NOx.
Thermal NOx is found by a series of chemical reactions that involve the dissociation and subsequent reaction of oxygen and nitrogen to form NOx, following the well-known Zeldovich mechanism [17]. The Zeldovich reaction is represented by:
N NO O N2+ ⇒ + (15) O NO O N+ 2⇒ + (16) Net reaction: N2 +O2⇒2NO (17)
• Fuel-bound NOx is usually of less importance for normal fuels. Molecular nitrogen present in some kinds of natural gas does not contribute significatly to NOx, but my be important with some low Btu fuels.
V.RESULTS AND DISCUSSION
A. The effect of swirl angles
We begin the study of different flow configuration of various swirl angles (35°, 40° and 45°) are compared in the primary chamber between a swirling angular jet (Primary air) and the non-swirling jet (fuel). Swirling air flow is a key feature in many types of combustors.
Tangential flow component is generated in an aerodynamics element called swirler (swirl generator). Such design in low-NOx diffusion burners with staged gas. The swirler is a key burner design component that significantly influences the flow pattern in combustion chambers. This different configuration are altered to examine about the emission and to obtain effective combustor with less NOx and CO2 emission.
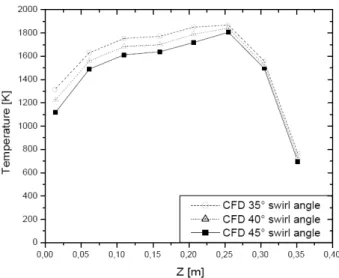
Figure 5 demonstrates the temperature for the can-type combustor with different swirler angles at axial distance. The temperature increases gradually due to the chemical reaction inside the main combustor. It is clear that after the location of primary chamber at z = 0.25m, the temperature diminishes due to the cooling effect of air from the secondary holes. Thus, it is distinct to show that the 45 degree swirler angle achieves better temperature in comparison with other swirler angles.
Depending upon the temperature the NO emission is determined by the Zeldovich mechanism. The main intention for introducing more air in the secondary chamber is to reduce the NO emission. Figure 6 demonstrates the NO mass fraction for the can-combustor with different swirler angles and axial distance. It is evident from the figure that after the location of primary chamber at Z=0.25m, the emission of NO diminishes because of the cooling effect of air. Hence, it can be stated that the 45 degree swirler angle attempts less NO emission due to low exit temperature. Figure 7 demonstrates the CO2 mass fraction for the can-combustor with different swirler angles and axial distance. The air at the secondary inlet is introduced to reduce the NO emission and also to mitigate CO2 emission
from natural gas. In Fig. 7, it is clearly predicted that CO2 mitigated to the value of 10% due to the cooling effect of air from the secondary inlet by swirling velocity.
Fig. 5 Axial temperature with different swirler angles
Fig. 6 Axial NO mass fraction with different swirler angles
Fig.7 Axial CO2 mass fraction with different swirler angles
B. Velocity streamline
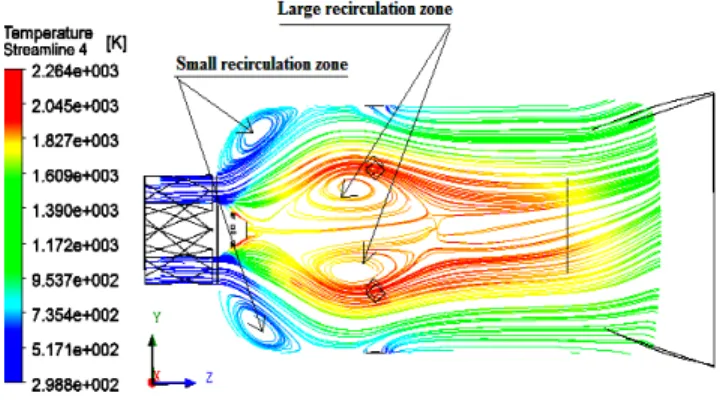
Figure 8, shows the streamline contours produced by the numerical model. The color of the streamline patterns represents the axial values of velocity. These streamlines indicate the path which a fluid particle would follow. Flame stability, combustion intensity, and performance are directly associated with the size and shape of this recirculation vortex. In primary zone, the negative axial velocities in the center of the combustion chamber indicate the existence of an inner recirculation zone. Swirl vanes around the fuel nozzle generate a strong vortex flow in the combustion air within the combustor. The flow field is typical of confined swirl flames and consists of a cone-shaped stream of burning gas in the inlet of the chamber. For sufficiently high swirl number (in this study, S=1.0), recirculation zone appears as a result of the vortex breakdown. The length of the recirculation zone is about (150 mm).
The recirculation zone operates normally at a rich mixture. This recirculation region is deeply involved in the flame stabilization process as it constantly puts hot burnt gases in contact with fresh gases allowing permanent ignition. The central recirculation zone results from the vortex breakdown generated by the Swirl. This large torridly central recirculation zone plays a main role in the flame stabilization process by acting as a store for heat and chemically active species. Negative axial velocities in corner regions indicate the existence of two corner recirculation zones resulting from sudden expansion. Corner recirculation zone above the shear layer of the recirculation zone and takes it shape from the neighboring boundary walls. The length of the corner recirculation zone is about (76 mm). Strong velocity gradients occur in the throat of the nozzle and, in the outer shear layer between inflow and recirculation zone, because of the strong turbulent mixing in those locations.
The secondary zone adds air to weaken the mixture. More air is added in the dilution zone to decrease the hot gas temperature for meeting the requirement of turbine guide vanes. This hot gas helps stabilize the flame by providing a continual source of ignition to the incoming fuel. It also serves as a zone of intense mixing within the combustor by promoting turbulence through high levels of shear between the forward and reverse flows. Recirculation zone is formed just at the downstream of the secondary air inlet (secairin).
Fuel velocity coming out from the injector at the plan 1 (Fig. 9) has a magnitude of 40m/s. Air coming through the swirled jet has a maximum velocity of 10 m/s and this flow spreads in the radial direction occupying whole space without formation of recirculation zone. This is due to the blockage effect created by the secondary air inlet jets forcing the primary air inlet jets and fuel jet to spread in radial direction. Velocity of fuel-air mixture reduces as I enter the liner axis of combustor.
From Figure 9, it can be seen that the modeling of dilution holes (secairin) results in the corresponding air jets being generated. The secairin jets help in recirculation a part of the primary air to aid in combustion in the primary zone. This zone is a prerequisite for the stable combustion. The function of the dilution air jet is to mix with the products of combustion to
cool these to a value acceptable by the turbine and also to reduce the pattern factor at the exit of the combustor.
Fig. 8 Velocity streamline in meridian plan (Oxz)
Fig. 9 Streamline of velocity field in combustor gas turbine, Horizontal section
C. Combustion aerodynamic
The design and performance of a combustor is strongly affected by aerodynamic processes. The achievement of aerodynamically efficient designs, characterized by good mixing and stable flow patterns with minimal parasitic losses, is one of the primary design objectives. Large scale central recirculation zones, as shown in Fig. 5, serve many other purposes as well.
Swirlers are static mixing devices used to impart swirl to the flow. The goal of swirler design is to maximize the benefits of recirculation by imparting sufficient swirl to the flow while minimizing the incurred pressure losses. Modern combustors also use swirlers to promote mixing of the fuel and air in the premier prior to combustion. At swirled and injector fuel jet, temperature of inlet air and fuel (100% CH4) was taken as 300K. After the initial region, temperature increases gradually from 300K to a maximum value of 2264K in the central region due to efficient combustion of fuel-air mixture. Hot combustion products become trapped in the recirculating mass and are returned to the combustor dome inlet. This hot gas helps stabilize the flame by providing a continual source of ignition to the incoming fuel.
Figure 10 illustrates the process of recirculation in a gas turbine combustor using streamlines. These streamlines indicate the path which a fluid particle would follow. The mixture flows axially after the reaction and it diffuses away
from the center to ensure entrainment of more air along the centerline of the secondary zone of the combustor thereby reducing the temperature in this region. Outlet temperature contours are more uniform (T=1300K).
Fig. 10 The process of recirculation in a gas turbine combustor using temperature streamlines
D. Effect of Fuels on species emission and temperature
In this study, methane is used as the reference fuel. Waste biogas is composed of Biogas 1 (%CH4=90, %CO2=10), Biogas 2 (%CH4=75, %CO2=25) and Biogas 3 (%CH4=70, %CO2=30), with a constant velocity inlet of fuel and air. In the current studies, the vane angle was assumed to be about 45° and was kept constant for all the simulation. The simulations were validated in terms of temperature and emission of pollutants NO and CO2.
The temperature distribution along the central axis of combustor is shown in Fig. 11. As seen in the figure, due to more fuel burned under the increase percentage of CO2, the outlet temperature decrease as the CO2 increases. In the region from the fuel injector to z = 0.1m, the temperature at the central axis of combustor has little change for all fuels. However, in the region from 0.1 m to combustor outlet, the temperature decrease as the percentage of CO2 increases. It can also be seen from Fig. 11 due to the air from the secondary holes takes more heat to reach the equilibrium temperature and the combustion process the mixing of dilution air and fuel gas is useful to improve the uniformity of combustor outlet temperature distribution.
Figure 11 demonstrates the temperature for the can-type combustor with different fuel properties and axial distance. The temperature increases gradually due to the chemical reaction inside the main combustor. It is clear that after the location of primary chamber at z = 0.25m, the temperature diminishes due to the cooling effect of air from the secondary holes. Thus, it is distinct to show that for the biogas 3, achieves better temperature in comparison with other fuel. The peak gas temperature is located in the secondary zone (z = 0.25m) for methane and biogas 1.
Then the peak gas temperature is located in the primary zone for Biogas 2 and biogas 3 (z = 0.1m). However, due to the dilution of burned mixture gas with the air, the gas mixture temperature is lower in primary zone. Adding about 10% of CO2 to methane lowers the adiabatic temperature of
combustion by about 10K, and increasing the ratio of CO2 to 30% by about 45K. The highest temperature in the combustion chamber was recorded for the burning of a mixture of methane. Increasing the amount of carbon dioxide in the fuel leads to lowering of the maximum combustion temperature. Figure 12 demonstrates the NO mass fraction for the can-type combustor with different fuels at axial distance. The highest values of distribution of the mass fraction of NO in the combustor chamber were measured for fuels with the highest combustion temperature.
NO concentrations, however, are highest in the slow-moving, reverse-flowing fluid near the combustor centerline. The fluid here has had sufficient time to allow N2 to react with O2 and form NO. An analysis of CO2 distribution in the combustion chamber in the axis the combustor was carried for methane pure and mixture of methane and CO2 (Fig. 13). The proper selection of a swirler is required to reduce the emission which can be concluded from the emission of NO and CO2. The air at the secondary inlet is introduced to reduce the NO emission and also to mitigate CO2 emission from natural gas. From the simulation work conducted for the can-type combustor for gas turbine, due to small dimensions of the combustors, heat flux is found to be high.
In combustors temperature gradients are higher as the characteristic length is decreased thus heat transfer by convection in the walls and in the combustion chamber and by conduction through the gas to the surrounding surfaces is significant [8]. Effects on various percentage of CO2 dilution in the fuel (CH4) on the maximum temperature of combustion can be seen in Fig.11. The fuel is a miwture of different percentage of CO2 with pure CH4, such as %10%, 25% and 30%. Such, the percentage of 47,7% is a maximum ratio of CO2 in respect with CH4 which mixture can ignite and forms a flame [6].
Contours of the temperature in midaxil vertical plan have been plotted in Figure 14. However, due to the dilution of burned mixture gas with the air, the gas mixture temperature is lower in primary zone. It can be seen from Figure 14, the high temperature zone becomes bigger as the % CO2 increases. It is because more fuel is burned in the combustor under the high % CO2. Adding about 10% of CO2 to methane lowers the adiabatic temperature of combustion by about 20K, and increasing the ratio of CO2 to 40% by about 45K.
Increasing the amount of carbon dioxide in the fuel leads to lowering of the maximum combustion temperature. Maximum temperature (2262 k) occurs for the mixture of 10%CO2 and 90% CH4, and while the mixing ratio of CO2 increases, the maximum temperature of flame reduces. Noticeable results is shape of flame is found to be almost the same for different fuel mixtures but when mixing ratio of CO2 increases primary combustion zone of the flame becomes larger and therefore it makes the length of flame slightly longer.
-0,05 0,00 0,05 0,10 0,15 0,20 0,25 0,30 0,35 0,40 1400 1600 1800 2000 T em per at ur e [ T ] Z [m] Methane Biogas 1 Biogas 2 Biogas 3
Fig. 11 Distribution of temperature along the center line of combustor
-0,05 0,00 0,05 0,10 0,15 0,20 0,25 0,30 0,35 0,40 0,0 2,0x10⁻⁶ 4,0x10⁻⁶ 6,0x10⁻⁶ 8,0x10⁻⁶ 1,0x10⁻⁵ 1,2x10⁻⁵ 1,4x10⁻⁵ N O M as s f rac tion Z [m] Methane Biogas 1 Biogas 2 Biogas 3
Fig. 12 Distribution of NO mass fraction along the center line of combustor. -0,05 0,00 0,05 0,10 0,15 0,20 0,25 0,30 0,35 0,40 0,10 0,12 0,14 0,16 0,18 CO 2 M as s F rac tion Z [m] Methane Biogas 1 Biogas 2 Biogas 3
Fig. 13 Distribution of CO2 mass fraction along the center line of combustor
Fig. 14 Temperature contours for different mixtures (unit K), distribution in center plan
Fig. 15 NO Mass fraction distribution
Contours of the NO mass fractions in midaxil vertical plan have been plotted in Figure 15. Profiles distribution of nitric oxide, they are formed in the combustion chamber in the case of the analyzed fuels. NO concentrations, however, are highest in the slow-moving, reverse-flowing fluid near the combustor centerline. The fluid here has had sufficient time to allow N2 to react with O2 and form NO. Pollution emission level from a combustor depends upon the interaction between the physical and chemical process and is strongly temperature dependent. Dominant component of the pollutant is nitrogen monoxide (NO) and evaluation of NO as pollutant is based on thermal model. In thermal model, temperature controlled oxidation of N2 leads to formation of NO whose emission level changes with axial distance. As temperature increases in the axial direction, oxidation of N2 increases leading to increase in NO.
In this model no slip condition is applied and in Fig.16 it is obvious that speed of fluid near the wall is zero. Speed profiles almost have the same shapes but as the mixing ratio of CO2 increases, the speed reduces and the profile of it becomes longer. -0,05 0,00 0,05 0,10 0,15 0,20 0,25 0,30 0,35 0,40 -10 -8 -6 -4 -2 0 2 4 6 8 10 V e lo ci ty [m /s ] Z [m] Methane Biogas 1 Biogas 2 Biogas 3
Fig. 16 Velocity profiles for different mixtures (init m/s) Figure 17 presents a set of measurements of toxic compounds or mixtures of natural gas (100% CH4) and biogas 1, 2 and 3 burnt in strong swirl flows. The values measured for NO correspond to those taken 30mm from the rectangular shape outlet of the combustor which shows that the whole of NO emissions is produced no higher than the flame height indicated and that in the flame no reburning of nitric oxides takes place. The emission of CO measured is much smaller, which points to the process of their afterburning in hot exhaust gases in the upper parts of the flame.
Figure 18, decreasing dilution in the combustion chamber (comparison between Fig. 18a, Fig. 18b and Fig. 18c) reduces the flame width and maximum temperature. The effect of first air inlet is more significant in higher amount of CO2 dilution. Temperature profiles with dilution in secondary inlet air zone has similar contour (Fig. 19a, Fig. 19b and Fig 19c). It is due to low mass flow rate in secondary zone.
Fig. 17 Emission of NO, NOx and CO vs. CO2 content in Combustion mixture
Fig. 18 Temperature profile in combustion chamber with CO2 dilution in first air inlet zone
Fig. 19 Temperature profile in combustion chamber with CO2 dilution in second air inlet zone
V. CONCLUSION
In the present study, a numerical approach to investigate CO2 dilution effect in a gas turbine combustor is presented with the use of the commercial CFD software ANSYS-FLUENT. One the main parameters to be predicted in this study is temperature and the results is important in developing an efficient system especially in choosing more suitable material for gas turbine can-type combustor.
The effects CO2 of dilution on the non-premixed combustion on NO emissions was investigated. Due to previous experimental problems with stability in the actual burner when burning methane, biogas was chosen as fuel.
For modeling of the gas turbine can-type combustor, a 3D un-structured grid consisting of about 106651cells were created in GAMBIT. The grid was imported into ANSYS-FLUENT where simulations of four different premixed mixture. For the modeling of turbulence the RNG k-ε Model was employed, while the Eddy Dissipation Model was used for modeling combustion.
Several wealthy observations and conclusions are obtained: • The results from the simulations proved satisfactory
when comparing with previous work (Fuel= 100% Methane) done on the same combustor.
• The conclusion regarding the analysis of the process of combustion of mixtures of natural gas with CO2. • The results of this investigation have also clearly
demonstrated that it is possible to use such fuels in combustion systems with swirl burners.
• Carbon dioxide contain in the fuel leads to the lowering of the temperature of the flame, the effect of which is a reduction in emissions of NO and CO.
• Numerical investigation on Can-type combustion chamber shows that biogas 3 (70% CH4 + 30 % CO2) is giving less NO emission as the temperature at the exit of combustion chamber is less as compared to gas natural, biogas 1 and biogas 2. Temperature profiles shows increment at reaction zone due to burning of air-ful mixture and decrement in temperature at the downstream of secondary inlet holes due to supply of more to dilute the combustion mixture.
• Dilution in secondary air inlet zone has no significant on flame length in the combustor but the amount of NO as pollutant is lower than other cases. The results from the parametric studies indicate that the calculation of NO emission serves to develop low emission combustor.
• Flame width in the primary dilution has bigger size rather than the dilution in secondary inlet air zone and this effect higher averaged temperature in whole combustor.
ACKNOWLEDGMENT
The authors would like to thank University of ENPO and the “SONATRACH” company (LNG group-Algeria) for the support regarding this research Project.
REFERENCES
[1] H. Pathan, K. Partel, and V. Tadvi, “Numerical investigation of the combustion of methane air mixture in gas turbine can-type combustion chamber,” International Journal of Scientific & Engineering Research, Vol. 3, No. 10, 2012, pp. 1-7.
[2] P. Koutmos and J. J. McGuirk, “Isothermal flow in a gas turbine combustor–a benchmark experimental study,” Experiments in Fluids, Vol. 7, 1989, pp. 344-354.
[3] C. Ghenai, “Combustion of syngas fuel in gas turbine can combustor,” Advances in Mechanical Engineering, Vol. 1, 2010, pp. 1-13. [4] Y. A. Eldrainy, J. Jeffrie, and M. Jaafar, “Prediction of the flow inside a
Micro Gas Turbine Combustor,” Journal of Mechanical, vol. 25, 2008, pp. 50-63.
[5] J. Park, K. T. Kim, J. S. Park, J. S. Kim, S. Kim, and T. K. Kim, A study on H2-Air counter flow flames in highly preheated air diluted with CO2, Energy & fuels, vol. 19, pp.2254-2260, 2005.
[6] C. Cohe, C. Chauveau, I. Gokalp, and D. F. Kurtuluş, CO2 addition and pressure effects on laminar and turbulent lean premixed CH4 air flames, Proceedings of the Combustion Institute, vol. 32, pp. 1803-1810, 2009. [7] S. H. Kim and J. A. Edmonds, Potential for advanced carbon capture
and sequestration technologies in a climate constrained world: Pacific Northwest National Laboratory, 2000.
[8] S. E. Hosseini and Mazlan A. Wahid, Necessity of biodiesel utilization as a source of renewable energy in Malaysia, Renewable and Sustainable Energy Reviews, vol. 16, pp. 5732-5740, 2012.
[9] ANSYS Gambit 2.4, http://www.ansys.com.
[10] ANSYS FLUENT v. 12. , Theory Guide: Release 12.0, Last modified ,
April (2009).http://www.ansys.com.
[11] Franz D. (2008), An Introduction to the Theory of Fluid Flows, Fluid Mechanics, Springer.
[12] B.F. Magnussen, On the Structure of Turbulence and a Generalized Eddy Dissipation Concept for Chemical Reaction in Turbulent Flow. Nineteenth AIAA Meeting, St. Louis, (1981).
[13] Patankar S. V., "Numerical heat transfer and fluid flow", McGraw-Hill, New York, USA, 1983.
[14] Westbrook, C. K., Dryer, F. L., Simplified Reaction Mechanisms for the Oxidation of Hydrocarbon Fuels in Flames, Combustion Sciences and Technologies, 27(1981), 1-2, pp. 31-43.
[15] Y. B. Zeldovich, “The oxidation of nitrogen in combustion explosions,” Acta Physicochim. URSS 21, 577-1946.
Dr. Guessab Ahmed was born in Algeria, Planteurs City, Oran, in 1974. He received his Bachelor degree in mathematics from Ibn Badiss School, Oran. Engineer degree in Mechanical Engineering from Oran University Algeria (USTOMB) in 2002, and he has Magister Degrees, in energetic from mechanical institute Oran University (USTOMB) in 2004. He was a teacher of some disciplines in National Polytechnic School from 2005 to present day. He focuses his research interests on the turbulent flow, models of turbulent combustion and combustion CFD simulation.
Dr. Aris Abdelkader is an Assistant Professor of Mechanical Engineering at the National Polytechnic School of Oran, Algeria. He received his Ph.D in Mechanical Engineering from Oran University, USTO.MB (Algeria) in 2006. His researches focus on numerical and experimental combustion phenomenon (internal combustion engine, burners and furnaces), heat transfer and renewable energy. He is responsible for the team's energy specialty in engineering school (ENP.Oran)
Dr. Tawfik Benabdallah is a lecturer and head of Industrial Products & Systems Innovation Laboratory (IPSIL) and Involved in Trans Euro Mediterranean Projects and in many international Review committees. Dr. Cheikh Mansour is an Assistant Professor of Mechanical Engineering at the USTOMB, Algeria.
![Fig. 12 Distribution of NO mass fraction along the center line of combustor. -0,05 0,00 0,05 0,10 0,15 0,20 0,25 0,30 0,35 0,400,100,120,140,160,18CO2 Mass Fraction Z [m] Methane Biogas 1 Biogas 2 Biogas 3](https://thumb-eu.123doks.com/thumbv2/123doknet/2288945.23102/7.918.473.843.422.689/distribution-fraction-combustor-fraction-methane-biogas-biogas-biogas.webp)

