1
The Impact of a Productivity Slowdown on Pension Systems
in Europe
Axel Börsch-Supan
Munich Center for the Economics of Aging (MEA) at the Max-Planck Institute for Social Law and Social Policy, Munich, Germany
Technical University of Munich, Germany
National Bureau of Economic Research, Cambridge, Mass., USA
With the support of Johannes Rausch, Munich Center for the Economics of Aging (MEA) at
the Max-Planck Institute for Social Law and Social Policy, Munich, Germany
Paper for the PIIE project on implications of the productivity slowdown
Third draft, 08 November 2017 **Not to be quoted without permission by the author**
Abstract
This paper takes the productivity slowdown during the past decades and its direct effects on wages and interest rates as given. From this somewhat pessimistic perspective, we analyze how pension sys-tems will be affected. Key questions are whether declining wage growth and capital returns in the wake of declining productivity growth will undermine the financial sustainability of pension systems and/or the adequacy of pensions as an important social program. We use a pension simulation model to compute the quantitative impacts of a stylized productivity slowdown on the level of pension-ben-efit income for retirees and the balanced-budget contribution rates for workers. These trajectories serve as indicators of the financial situation of a pension system and the adequacy of pension benefits. Our main conclusion is that policy action is not required for those systems that are self-stabilizing. In the cases in which this is not the case, population aging is still slower than productivity increase even in the case of the assumed productivity slowdown, hence absolute pension income levels will still increase, albeit much slower than retirees have been used to. If this appears politically unacceptable, policy actions should be targeted to increase the quantity of labor and capital in order to offset the lower than previously expected value of labor and capital which has been precipitated by the produc-tivity slowdown. We discuss working longer, working more, educating better, allowing more migration and saving more.
2
1. Introduction
Pensions are an important social program. We use the term “pensions” in the European meaning, including public pensions (“Social Security” in US-American terms) as well as occu-pational pensions and individual saving plans for old age. Pensions account for a large and increasing part of GDP and are the source of income for a large and increasing part of the population.1 Pensions are also a political hot spot often called the “third rail” in reference to
its potentially electrocuting impact during elections (Safire 2007; Lynch and Myrskyl 2009). Pension systems have to maintain a delicate balance between the adequacy of their pension benefits and their financial sustainability. In the pay-as-you-go pension systems present in almost all advanced economies, this balance reflects the intergenerational distribution be-tween old and young. Generous pension benefits are good for the older generation but have to be financed from taxes and contributions by the young. If population aging reduces the number of younger workers relative to the increasing number of older pension recipients, pay-as-you-go systems may become financially unsustainable.2
This delicate balance is easier to handle if the underlying economy is growing. To take an example, Germany’s long-term annual labor productivity growth has been around 1.5% in real terms (Buchheim 1997). Population aging, in turn, reduces the number of contributing work-ers divided by the number of pension beneficiaries by about 0.5% p.a. Hence, even if pension benefits are cut by 0.5% p.a. to keep the pension system’s financial balance unchanged, the pay-as-you-go system can still afford a benefit increase of 1.0% p.a. in real terms.
A slowdown of productivity growth, however, may endanger this balance. This is the topic of this paper. The paper is part of a larger project on the consequences of a productivity slow-down and uses the same assumptions on productivity growth as the other papers of the pro-ject. We take the projected productivity slowdown and its direct effects on wages and interest rates as given. From this somewhat pessimistic perspective, we analyze how pension systems will be affected. Key questions are whether declining wage growth and capital returns in the wake of declining productivity growth will undermine the financial sustainability of pension systems and/or the adequacy of pensions as an important social program.
The answers very much depend on the type of pension system and whether one is concerned about the relative or the absolute level of pension benefits – i.e., relative to past and present wages and absolute with respect to some politically defined poverty line. Section 2 therefore describes six prototypical pension systems. Most real-world pension systems can be inter-preted as convex combinations of these stylized pension systems.
1 Public and private spending on pensions amounts from 10.8% of GDP in the UK to 17.0% of GDP in Italy.
France spends 14.1%, Germany 12.1% and the US 10.7% (OECD 2015).
2 The dependency ratio increases most strongly in Italy (36.5 to 68.3 from 2015 to 2050) and Germany (35.5 to
65.1). Increases are much more moderate in the UK and France (30.8 and 32.8 in 2015 to 46.4 and 49.0 in 2050, resp.) and even less in the US (24.7 to 39.5) (OECD 2015).
3
The paper then uses a simulation model (“MEA-PENSIM”) to compute the quantitative im-pacts of the stylized productivity slowdown on the level of pension-benefit income for retirees and the balanced-budget contribution rates for workers. These trajectories serve as indicators of the financial situation of a pension system and the adequacy of pension benefits. Section 3 describes the model’s mechanics and the underlying assumptions.
Section 4 is devoted to the simulation results. In order to put things in perspective, we com-pare the impact of the stylized productivity slowdown with the impact of population aging. All calculations in this section are mechanical exercises, i.e. behavior (labor demand & supply, saving rates, etc.) is assumed to remain constant. MEA-PENSIM produces aggregate results for each cohort of workers and retirees. An important discussion is how a productivity slow-down affects the intergenerational distributional between workers and retirees.
Section 5 is concerned with policy actions. While we do not cover policy measures that miti-gate the causes of the productivity decline, we will analyze five types of adaptation based on increasing the quantity of labor and capital in order to offset the lower than previously ex-pected value of labor and capital that has been precipitated by the productivity slowdown. Section 6 concludes.
2. Pension systems
The effects of a productivity slowdown on pension-benefit levels and contribution rates de-pend strongly on the type of the pension system. It is thus important to clearly define which pension system we are talking about. We distinguish six prototypical pension systems (Sys-tems 1-6), characterized by three fundamental dimensions. This is depicted in Figure 1. In addition, we add two real-world scenarios (Systems 7 and 8).
4
The first fundamental difference is between pay-as-you-go (PAYG) and fully funded (FF) sys-tems.3 PAYG systems carry this name because benefits are paid to older pension beneficiaries
as contributions from the younger come in. The sum of benefits paid to current retirees is equal to the sum of contributions received from current workers. There is no capital stock. Hence, the younger generation pays the benefits for the older generation, hoping that this implicit contract will also hold for them. The young generation’s members not only hope that they will be financed by their kids as they have financed their parents, they also hope for a real return on their notional investment. The rate of return from a PAYG system is generated by population and productivity growth. If the next generation has more members, the old-age burden is spread on more shoulders; if the next generation is more productive, the pie to be redistributed to the older generation gets larger. More formally, the rate of return from a PAYG system is n+g where n denotes the growth rate of the labor force and g the annual increase in labor productivity. There is thus a direct channel to a productivity slowdown. As opposed to PAYG systems, fully funded (FF) systems have a capital stock. One generation first accumulates funds as part of this capital stock. Later, this very same generation receives benefits from the accumulated stock. Hence, the rate of return of a FF system is simply the market interest rate in real terms, r. All effects of a productivity slowdown thus work indirectly through the slowdown’s effect on the interest rate.
The fundamental difference between PAYG and FF systems lies in the intergenerational con-text. The PAYG system links the older and the younger generation directly since the younger generation pays with their taxes and contributions the pension benefits of the older genera-tion. In a FF system, the two generations are strictly separated since one generation pays into a fund and takes those very same payments later to finance their pensions. The two genera-tions are only linked by macroeconomic feedbacks via the interest rate. This will be discussed further below.
A second fundamental difference is how benefits at old age are linked to contributions at young age. In a prototypical earnings-related (“Bismarckian”) system, benefits are propor-tional to contributions which are in turn proporpropor-tional to earnings. The other extreme are “Beveridgian” pension systems which provide flat benefits which are independent of earnings and contributions. Most real-world pension systems are some mixture of these two extremes. Many systems provide a minimum or base pension (the Beveridgian part of the pension sys-tem) in addition to an earnings-related scheme (the Bismarckian part of the pension syssys-tem). In Germany, e.g., the quintessential Bismarckian system has been augmented by a flat social assistence for the very poor in 2001 (“Grundsicherung im Alter”). The US Social Security sys-tem, e.g., provides benefits that are linked to earnings but in a non-linear fashion in which workers with low earnings receive a higher replacement rate than workers with higher earn-ings. In principle, FF systems could provide flat benefits. However, all FF systems in the real
3 Börsch-Supan, Härtl and Leite (2016) provide a formal survey of pensions systems in times of population
5
world relate benefits in old age to the contributions when young. The intragenerational dis-tribution of a productivity slowdown’s effects depends heavily on the link between contribu-tions and benefits.
Third and finally, both PAYG and FF systems can be of the defined benefit (DB) or the defined contribution (DC) type. In our prototypical version, a DB system promises an earnings-related replacement rate (in a Bismarckian system) or a flat benefit (in a Beveridgian system) at young age independent of economic and demographic circumstances which develop in the life course. Potential risks – lower than expected rates of return in the capital market for FF sys-tems, larger than expected population aging in a PAYG system – have to be compensated by the sponsors of the system while the retirees are protected. The opposite holds for a DC sys-tem. In a PAYG-DB system, the government as sponsor promises a replacement rate (if Bis-marckian) or a flat benefit (if Beveridgian) and has to finance this with higher contributions imposed on the young if economic or demographic circumstances turn out worse than ex-pected – e.g. due to a productivity slowdown. In a FF system, the sponsor (e.g. a company in an occupational pension system) has to make up for a lower than expected return on the capital market – e.g. lower interest rates due to a productivity slowdown. In contrast, a DC system keeps the contribution rate to the system constant, independent of economic and demographic circumstances. If economic or demographic conditions turn out worse than ex-pected, pension benefits for the older generation will be lower than expected. Economic and demographic risks are thus entirely born by the retirees. Traditionally, PAYG pension systems have been of the DB type, e.g., the US Social Security system. The Swedish PAYG system had broken this tradition by introducing a “notional defined contribution system” (NDC) in which benefits are linked to economic and demographic circumstances.4 In the Anglo-Saxon
coun-tries, fully funded occupational pensions have experienced a secular shift from DB to DC. However, DB and DC are extreme cases and any degree of risk sharing is possible. A real world example of such a hybrid system is the current German PAYG system which carries elements of DB in its pension formula but has introduced a linkage to demography through its so-called sustainability factor (see System 8).5 The intergenerational distribution of a productivity
slow-down’s effects depends heavily on DB versus DC.
Real-world pension systems are much more complex. They often add layers (“pillars”) of sub-systems and mix the three fundamental dimensions by re-distributing between young and old and between rich and poor. Sometimes, government subsidies financed by general taxes or debt are used to support the pension system. This makes real-world pension systems often intransparent. One aim of this paper is to delineate the effects of a productivity slowdown in a transparent fashion with the help of these stylized/prototypical pension systems. Actual effects for real-world pension systems can then be computed as the weighted sum of the effects on each subsystem.
4 See Palmer (2002). Italy adopted a similar system, see Franco and Sartor (2005). 5 See Börsch-Supan and Wilke (2005).
6
To summarize, we will consider 6 prototypical and 2 real world examples of pension systems: • System 1: Prototypical earnings-related PAYG-DB system with a constant net
replace-ment rate. Population aging and/or productivity slowdown will unilaterally increase contribution rate. Similar to US Social Security system and many European and Japa-nese public pension systems.
• System 2: Prototypical earnings-related PAYG-DC system with a constant contribution
rate. Population aging and/or productivity slowdown will unilaterally decrease re-placement rate. Similar to Swedish pension system.
• System 3: Flat pension (in 2015: 1000 Euro per month) indexed to the average gross
wage. Similar to Swiss pension system. This is akin to a DB system since the replace-ment rate of this system is independent from economic and demographic develop-ments. The absolute level of benefits, however, is not protected in such a system. • System 4: Flat pension (in 2015: 1000 Euro per month) indexed to inflation. Similar to
basic pension in UK pension system. This is akin to a DC system is the sense that the replacement rate of the system depends on economic and demographic develop-ments that change the real wage.
• System 5: Fully funded DB system with a constant net replacement rate. Population
aging and/or productivity slowdown will unilaterally increase contribution rate. Simi-lar to occupational DB pensions.
• System 6: Fully funded DC system with a constant contribution rate. Population aging and/or productivity slowdown will unilaterally decrease replacement rate. Similar to individual retirement accounts.
• System 7: Discusses additional spillover effects if the pension system’s budget and the government budget are interlinked.
• System 8: The actual German pension system: earnings-related mixed DB/DC system. Population aging and/or productivity slowdown results in equi-proportional adapta-tions of contribution and replacement rates through a “sustainability factor”.
3. The model
A productivity slowdown poses two central threats to a pension system which we will com-pare to the well-known threats to pension systems exerted by population aging. First, a pen-sion system may become financially unsustainable if economic or demographic circumstances push the contribution rate up beyond a certain threshold at which the negative incentive ef-fects on labor supply outweigh the revenue effect of increased contributions. The second threat is lack of adequacy. This occurs if economic or demographic circumstances drive ben-efits down below a certain normative level, e.g., the poverty line or a certain percentage of median income.
7
We use a simulation model to compute two key trajectories of pension systems which repre-sent how these two threats are handled: the replacement rate (i.e., average pension benefits to retirees as percentage of average wages) and the contribution rate (i.e., average taxes and contributions paid by workers as percentage of average wages). Whether the replacement rate is a good indicator for pension adequacy is debatable and subject to the long-standing controversy about absolute or relative poverty. Since pension issues are very long-term, we argue that a relative measure is more appropriate. This is based on the historical observation that social standards have adapted to a society’s development.
The drivers of these trajectories are the economic development, especially the development of labor productivity, and demography, especially population aging. We assume that higher/lower labor productivity is translated one-to-one into higher/lower wages. Finally, we assume that inflation is 1.5% in 2020 and declines in line with labor productivity. In the fol-lowing Section 4, we do not consider any other macroeconomic feedback effects, such as the indirect effects of population aging on wages and interest rates. We will discuss such feedback effects in Section 5 based on an overlapping generations framework. Based on these basic assumptions, we model three scenarios:
• Baseline: German population forecast with strong population aging generated by ba-byboom-babybust transition, constant low fertility and continuing increase of life-ex-pectancy. Constant productivity growth at 1.5% p.a. in real terms. 1.5% inflation. • Productivity slowdown: Productivity growth per se is not a parameter for pension
systems – their performance depends on wage growth. In order to be synchronized with the other papers in this project, we assume that wage growth follows productiv-ity growth which in turn follows the common assumptions in this project. Hence, this scenario assumes that real wage growth of 1.5% p.a. in 2020 will linearly decrease to 0.9% in 2030 and then remain at this level. Inflation is 1.5% in 2020 and will then de-cline proportionally to real wages. Nominal wage growth thus dede-clines from 3% p.a. in 2020 to 1.8% in the long-run.6
• Constant life expectancy: In order to compare the magnitude of the effects of the
productivity slowdown with another secular trend, we compute a third scenario which assumes no further increases of life expectancy. This may be interpreted as a slow-down of medical/societal progress in increasing life expectancy. Otherwise same as baseline. Note the irony: given a fixed retirement age, this will reduce population aging and therefore stabilize pension systems.
Our projections use the pension simulation model “MEA-PENSIM”. It was originally designed to map the German Pension System in all relevant parameters in a way that permits imple-menting various reform suggestions (Wilke, 2004; Holthausen et al., 2012; Rausch, 2016). MEA-PENSIM has been extended for this project to also model the stylized pension systems
6 German labor productivity growth is currently (2016) in the order of 0.9% p.a., so the baseline scenario of
1.5% assumes a fairly vigorous recovery. The downside scenario thus effectively assumes that labor productiv-ity growth will not recover.
8
depicted in Figure 1. We stick, however, with the German demography, representing a par-ticularly strongly aging European economy.7
The projections are based on detailed calculations of receipt’s and payment’s accounts. The calculation of those accounts as well as the projection of the contribution rate and pension level requires assumptions about the development of the population, labor market and wages. As a consequence, MEA-PENSIM possesses own modules for the generation of demo-graphic and labor market projections.
Demography is described by the initial size of each cohort and the survival of that cohort. Let Nt,j denote the number of individuals of age j at time t. They were either born in year c =
t-j and are the survivors of the original birth cohort Nc,0 or have migrated at age j in time t.
(1) Nt,j = σt,j ⋅ Nc,0 + Mt,j.
σt,j denotes the unconditional probability to survive until age j which will be in year t. The
original cohort size for cohort c depends on the fertility of women aged k at time c = t-j:
(2) Nc,0 =
∑
∞ =0
k
fc,k ⋅ Nc,k .8
Population aging has therefore three demographic components: past and future increases of longevity, expressed by σt,j; and fertility below replacement in many countries expressed
by past, current and future low levels of ft,k. Population aging is only partially offset by the
stream of migrants Mt,j.
We treat all three demographic forces as exogenous. The starting point of the projection is the German population in 2015. We use the same assumptions as the high-immigration ver-sion of the official population projection (13th coordinated population forecast of the Ger-man Federal Statistical Office, variant “continuity under stronger immigration”). This projec-tion includes until 2060:
• a constant fertility rate of 1.4,
• a constant net influx of 200 000 migrants, starting in 2021 (between 2015 and 2021 the net immigration steadily decreased from 500 000 to this value), and
• an increasing life expectancy at birth of 84.8 years for men and 88.2 years for women in the baseline and productivity slowdown scenarios, otherwise constant.
7 Germany and Italy have the oldest populations in Europe as measured by the level of the old-age dependency
ratio. More important for the subsequent analysis, however, is the change of the old-age dependency ratio, given today’s level. This change is similar for most European countries except France, Scandinavia and the UK, where the aging process is considerably slower.
8 We use the convenience of an infinite summation to avoid the assumption of a fixed time of death. The
nota-tion does not imply households with infinite lifespans. Since σt,j and fc,k become very small for j>100 and k>50
9
Labor supply is determined by multiplying population numbers with age and gender-specific labor force participation rates lt,j:
(3) NWt = ∑70𝑗𝑗=1𝑙𝑙𝑡𝑡,𝑗𝑗𝑁𝑁𝑡𝑡,𝑗𝑗.
Labor force participation rates of the simulation’s base year 2015 are taken from the German Mikrozensus which provides labor force participation rates in the necessary differentiation. Our projections of the future development of the labor market are oriented at the short-term assumptions of the medium variant of the Pension Report 2015 (Rentenversicherungsbericht, German Federal Ministry of Labor and Social Affairs, 2015). In addition, we assume that the over 62 year old individuals postpone their pension claiming analogous to the increase in the statutory eligibility age by two years. This is conducted by adjusting the labor force participa-tion rate in the respective cohorts.
The number of pensioners is computed indirectly. MEA-PENSIM considers a retirement win-dow from 51 to 70, i.e., the first workers retire at age 51 while the last individuals claim their pension with 70. We assume that labor market exit age and pension claiming age are identical. MEA-PENSIM then computes the number of pensioners at time t, denoted by NPt , as the
decrease in the number of workers from age 50 onwards, correcting for mortality. In addition, we assume that non-mandatory insured individuals (among them self-employed, civil serv-ants, homemakers) claim their public pension at the statutory eligibility age.
MEA-PENSIM models a PAYG pension system by a set of three key equations. On the macro level, the first key equation is the pay-as-you-go identity of revenues and expenditures (4) τt ⋅ wt ⋅ NWt = pt ⋅ NPt ,
assuming that the pensions budget is balanced in every year.9
The second key equation on the macro level is the determination of either the replacement rate in a DB system or the contribution rate in a DC system. If the PAYG system is of the DB type, a cohort of retirees is promised a pension benefit pt which is typically defined by a
re-placement rate q0, pt = q0·wt.10 The contribution rate to the system must then be adjusted up
or down to keep the PAYG-DB system balanced, such that current workers cover the demo-graphic risk for the benefit of the retirees:
(5) τt = q0 ⋅ NPt / NWt .
9 Many PAYG systems have a reserve and/or other multi-year balancing mechanisms (e.g. Settergreen (2001)
for Sweden). Other PAYG systems have budgets which are effectively part of the general government’s budget and may increase or decrease the general government’s debt (e.g. Kotlikoff (2002) for the US).
10 Alternatively, the replacement rate relates to the net wage wt⋅(1-τt). Defining benefits as a percentage of
earnings is typical for Bismarckian pension systems such as those in Germany and the US. DB may also provide a fixed pension benefit, real or nominal, independent of earnings, which is typical for Beveridgian pension sys-tems such as in the UK or the Netherlands.
10
If the PAYG system is of the DC type, the pension system fixes the contribution rate τ0 for a
cohort of workers. Their replacement rate then follows the path (6) qt = τ0 ⋅ NWt / NPt
and reacts passively on developments in demography and employment.
Pure DB and pure DC are extreme points in the intergenerational risk distribution. The two pension benefit determination rules can be combined as
(7) pt/pt-1 = wt/wt-1 ⋅ (DRt-1/DRt) α ,
where DRt = NPt / NWt is the dependency ratio and the weight 0 ≤ α ≤ 1 represents all
compromises between a pure DB and a pure DC system. Such a hybrid DB/DC-PAYG pension system is modeled as System 8 and corresponds to the actual German PAYG system. The term
(DRt-1/DRt)is called “sustainability factor”. The system’s internal rate of return is:
(8) irr = g + α⋅n .
The paramter α can be set as a political compromise between current voters’ preferences and financial sustainability. It determines the intergenerational distribution of the demographic risk generated by population aging. Setting α=0 stabilizes the replacement rate of pension benefits to the older generation while α=1 stabilizes the contribution rate of the younger generation. In MEA-PENSIM, it is set to 0.25 which is the value according to current German law.
On the micro level, the key equation of MEA-PENSIM defines pension benefits 𝑝𝑝𝑖𝑖,𝑅𝑅 for an
in-dividual i claiming benefits at age R by three multiplicative components:
(9) 𝑝𝑝𝑖𝑖,𝑅𝑅 = 𝑞𝑞� 𝑠𝑠𝑖𝑖 ω𝑅𝑅 .
𝑞𝑞� is the basic replacement rate for an average worker retiring at the statutory retirement age. It is either q0 or qt depending on the type of pension system, DB or DC. 𝑠𝑠𝑖𝑖 is an individual
component linking the pension benefit to this individual’s earnings. ω𝑅𝑅 is an adjustment factor which links pension benefits to the actual claiming age R of individual i.
For pension systems with flat benefits, we set si = 1. We model the relation between earnings
and benefits in an earnings-related pension system in the form of earnings points. In each working year, earnings points reflect the labor income position of a worker at age i relative to the average earnings 𝑤𝑤ℎ. Earnings points are accumulated during the entire work life: (10) 𝑠𝑠𝑖𝑖 = ∑𝑅𝑅−1𝑖𝑖=0 𝑤𝑤𝑤𝑤ℎ𝑖𝑖ℎ𝑖𝑖/R .
11
Life-time earnings points depend on the claiming age, the hours of work supplied (intensive and extensive margin) and their valuation (hourly wage).
Finally, we model the adjustments of pension benefits to the claiming age in a linear fashion where the steepness of the adjustment is driven by a single adjustment rate 𝜔𝜔. If the house-hold claims its pension at the statutory eligibility age 𝑅𝑅, there is no deduction or premium, ω𝑅𝑅=1. For one year of earlier retirement, benefits are reduced by 𝜔𝜔 percent while benefits are increased by 𝜔𝜔 percent for one year of later retirement:11
(11) ω𝑅𝑅 = 1 + �𝑅𝑅 − 𝑅𝑅�𝜔𝜔.
Many countries feature adjustment factors 𝜔𝜔 that are lower than actuarially neutral.12
We model a fully funded (FF) pension system following its fundamental assumptions: a gen-eration pays into a fund during its working life, receives interest on the accumulated capital which is then used to finance the consumption of the same generation during retirement. In its most abstract two-period form, workers receive wage income w in period 1 from which they pay a percentage τ into the pension fund. Pension income p is then
(12) p = (1+r) ⋅ τ ⋅ w,
where r is defined in units that are commensurable with the period length. At this level of abstraction, a funded system is equivalent to voluntary private saving and the internal rate of return is the interest rate on the capital market, r. In a FF-DC system, r is the realized capi-tal market ex post; in a FF-DB system, r is the ex ante rate of return which has been guaran-teed by the sponsor of the FF pension system.
4. Results: How large is the impact?
We display our results as three trajectories over time. They represent the three scenarios described at the outset of the preceding section. The trajectories show either the contribution rate (for DB systems) or the replacement rate (for DC systems). Only for hybrid DB/DC-PAYG pension systems will we show both trajectories. The main driver of the trajectories is popula-tion aging. Populapopula-tion aging increases the contribupopula-tion rates of DB systems and reduces the replacement rates of DC systems. The difference between the baseline scenario and the productivity-slowdown scenario shows the effect of declining real wage growth on the con-tribution (or the replacement rate, resp.) that is precipitated by the productivity slowdown.
11Some countries have two adjustment rates: ω
ER for retirement before the statutory “normal retirement age” and ωLR
for retirement thereafter. Adjustment factors are only one way to link pension benefits to the claiming age. It fits well with earnings point, notional defined contribution and similar pension systems. Other mechanisms include age-varying benefit accrual rates.
12 The actuarial neutral adjustment rate at age 65 is about 6.3% for the average of France, Germany and Italy underlying
12
The magnitude of this difference may be compared with the difference between the baseline scenario and the constant-life-expectancy scenario.
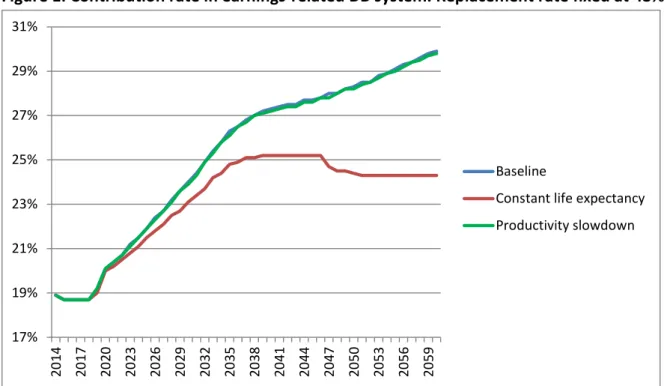
System 1 (PAYG-earnings related-DB): In a prototypical Bismarckian PAYG-DB pension
sys-tem, the replacement rate is set by the political process independently of demography and productivity. Hence, a productivity slowdown pension income decreases pension benefits in absolute terms but keeps them constant relative to wages. As long as the system is fully wage-indexed, financial sustainability is not affected. Furthermore, if adequacy is defined relative to wages (e.g., by a relative poverty line), it is not affected either. Hence, public policy action would be inapproriate.
Figure 1: Contribution rate in earnings-related DB system. Replacement rate fixed at 48%.
Figure 1 shows this line of thinking using the PENSIM model applied to the German popula-tion, representing the aging Europe.13 Population aging puts the pension system under
pres-sure for two reasons: low fertility and increasing life expectancy. Low fertility has two com-ponents: the historical babyboom-babybust transition which produced a sudden decline from a relatively high to a much lower fertility rate mainly in the 1970s, and the continuing low fertility since then which causes one generation to be about a third smaller than its predeces-sor generation.14 Since the replacement rate is constant by assumption, the contribution rate
is steeply increasing until about 2035 when the babyboom generation will be deceasing. After about 2035, the change in the old-age dependency ratio is essentially driven by the steady increase of life expectancy while the pressure from the “age boom” will be over. Hence, we
13 See the qualifications in Section 3.
14 Assuming that a generation encompasses about 30 birth cohorts.
17% 19% 21% 23% 25% 27% 29% 31% 20 14 20 17 20 20 20 23 20 26 20 29 20 32 20 35 20 38 20 41 20 44 20 47 20 50 20 53 20 56 20 59 Baseline
Constant life expectancy Productivity slowdown
13
observe a flattening of the increase in the base scenario, and – by assumption – a stabilization of the contribution rate in the “Constant life expectancy” scenario.
Note that the contribution rate is virtually identical in the two productivity scenarios (“Base-line” and “Productivity slowdown”). Since the replacement rate is constant by assumption in a PAYG-DB pension system, the budget balance of the PAYG-DB system in terms of the wage
bill is unaffected by the productivity slowdown. In absolute terms, the pension system’s
budget shrinks in proportion to the wage bill.
This argument assumes that the productivity slowdown has no effects on employment; hence the wage bill declines in proportion to the wage level. There may be more subtle effects if wages do not decline with productivity due to staggered wage contracts or similar frictions and employers react with lower labor demand which decrease the tax and contribution base for the pension system.
As already pointed out, since strictly earnings-related PAYG-DB pension benefits are fully wage-indexed, neither financial sustainability nor adequacy defined relative to wages is af-fected, and policy action would be inapproriate. This argument follows an underlying philos-ophy of relative poverty.
This is not the case if adequacy (and thus also old-age poverty) is defined in absolute terms. There are two opposite trends. Even under the pessimistic productivity slowdown scenario, labor productivity is still growing and hence wages and pension benefits, albeit at a slower than historical rate. This is overlaid, however, by the pressures of population aging which will increase contributions and thus decrease net wages to which pension benefits are indexed. Which of these forces is dominant depends on the speed of productivity decline versus the speed of population aging.
Using again numbers for Germany, the dependency ratio will increase by about 0.5% p.a.. This corresponds to an equally sized loss in workers per capita and a corresponding increase in contributions to the pension system and declining real wages net of contributions. On the other hand, productivity adds new resources at the rate of 1.5% or 0.9%. In the baseline sce-nario, real wages grow by 1.5% p.a., so absolute pension benefits could still increase by 1.0% p.a. without creating financial sustainability problems. This degree of political freedom is sub-stantially reduced in the productivity-slowdown scenario in which real wages grow by only 0.9% p.a., but there remains a positive balance of 0.4% p.a..
Nevertheless, the magnitude of the simulated productivity slowdown and its implied decline in real wages would still guarantee increasing pension payments even in a strongly aging economy such as Germany since population aging is a slow process that takes fewer resources away than new resources are created by increasing productivity. The balance can be used to increase benefits, reduce contributions or a mixture of both.
14
There are many real-world complications in addition to this fundamental argument. We men-tion three. First, some countries also have laws which limit the decrease in nominal pension payments. If inflation is low and productivity would not only slow down but even decrease, then this would trigger an increase in the replacement rate which would need to be financed by higher contributions or government subsidies which may lead to a financially unsustaina-ble situation. Second, earnings-related schemes are often not as strict as modelled here. Con-tributory earnings maybe capped from below and above for reasons of intragenerational re-distribution. Third, population aging may also increase other taxes and contributions, e.g. due to higher health care costs and/or long-term care. All this complicates matters in a detailed country-specific projection of pension benefits and finances but the fundamental argument remains.
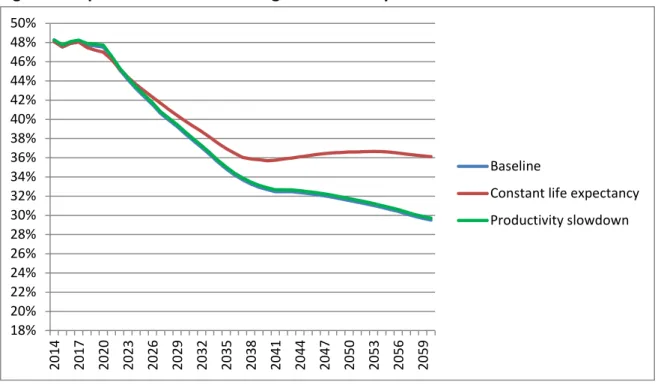
System 2 (PAYG-earnings related-DC): An earnings-related PAYG-DC pension system is the
mirror image of the earnings-related PAYG-DB pension system just discussed. In the idealized PAYG-DB system, pensioners are protected in relative terms and workers have to pay the in-creasing bill of population aging. In the PAYG-DC system, workers are protected from contri-bution increases, but pension benefits will go down both in absolute and relative terms. Ac-cordingly, Figure 2 in terms of the replacement rate is the mirror image of Figure 1 in terms of the contribution rate. Following the logic of the previous exercise, the effect of population aging is virtually identical for both productivity scenarios (“Baseline” and “Productivity slow-down”) while a stagnation of the historical increase in life expectancy has a large effect on stabilizing the replacement rate (“Constant life expectancy”).15
Figure 2: Replacement rate in earnings-related DC system. Contribution rate fixed at 19%.
15 The slight deviations visible in Figure 2 are due to the technicalities of pension benefit indexation.
18% 20% 22% 24% 26% 28% 30% 32% 34% 36% 38% 40% 42% 44% 46% 48% 50% 20 14 20 17 20 20 20 23 20 26 20 29 20 32 20 35 20 38 20 41 20 44 20 47 20 50 20 53 20 56 20 59 Baseline
Constant life expectancy Productivity slowdown
15
Again: as long as the system is fully wage-indexed, employment is fixed and there are no nom-inal minimum benefits rules, the financial sustainability of the system is not affected and pub-lic popub-licy action would be inapproriate for this reason. Moreover, the productivity slowdown
per se is no reason to be worried about adequacy since the replacement rates are identical in
the “Baseline” and “Productivity slowdown” scenarios.
Population aging, however, is a reason to worry about adequacy. It is at risk if the force of aging dominates the remaining wage increase after a productivity slowdown. As we have ar-gued earlier, this is not the case for the assumed productivity slowdown figures in combina-tion with the (strong) aging of the German populacombina-tion.
System 3 (PAYG-flat wage-indexed benefits): If pension benefits are independent from
indi-vidual earnings but indexed to wages (such as social assistance) and the system is financed by taxes on labor income, we are back to the fully indexed earlier case. The replacement rate will remain constant by definition. Figure 3 shows that the contribution rate will increase due to population aging but identically so in the two productivity scenarios.
Since both contribution rate and replacement rate are identical in the two productivity sce-narios, the budget balance of the wage-indexed Beveridge system in terms of the wage bill is unaffected by the productivity slowdown. In absolute terms, the pension system’s budget shrinks in proportion to the wage bill. As long as the system is fully wage-indexed, employ-ment is fixed and there are no nominal minimum benefits rules, the financial sustainability of the system is not affected. Neither is adequacy affected relative to wages. Hence, public pol-icy action would be inapproriate.
Figure 3: Contribution rate in wage-indexed flat-benefits system.
17% 19% 21% 23% 25% 27% 29% 31% 20 14 20 17 20 20 20 23 20 26 20 29 20 32 20 35 20 38 20 41 20 44 20 47 20 50 20 53 20 56 20 59 Baseline
Constant life expectancy Productivity slowdown
16
If adequacy is defined in absolute terms, public policy action would only be warranted if the force of aging dominates the remaining wage increase after a productivity slowdown. As we have argued earlier, this is not the case for the assumed productivity slowdown and demog-raphy projections.
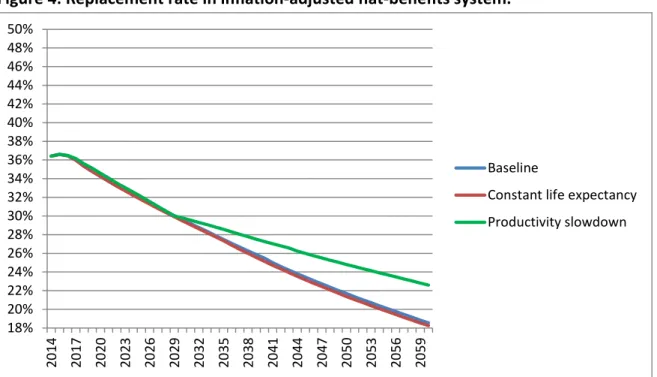
System 4 (PAYG-flat inflation-indexed benefits): So far, we have looked at pension systems
in which the productivity slowdown per se had no effect on pension systems. This is very dif-ferent if the system provides flat pension benefits which are indexed only to inflation but not to wages. In this case, the replacement rate will fall because retirees will not profit from productivity increases. Hence, relative to wage earners, pensioners are worse off. This erod-ing effect is smaller in the slowdown scenario, see Figure 4 and the difference between the “Baseline” and “Productivity slowdown” scenarios. Adequacy in relative terms is thus strengthened by the productivity slowdown. This may sound ironical but is the implication of a smaller gap between wage and pension benefit development. Productivity only affects the denominator but not the numerator of the replacement rate.
Since the pension benefit amount is fixed in terms of purchasing power, demography has no effects on the replacement rate. Hence, the “Baseline” and “Constant life expectancy” sce-narios show identical trajectories.
Figure 4: Replacement rate in inflation-adjusted flat-benefits system.
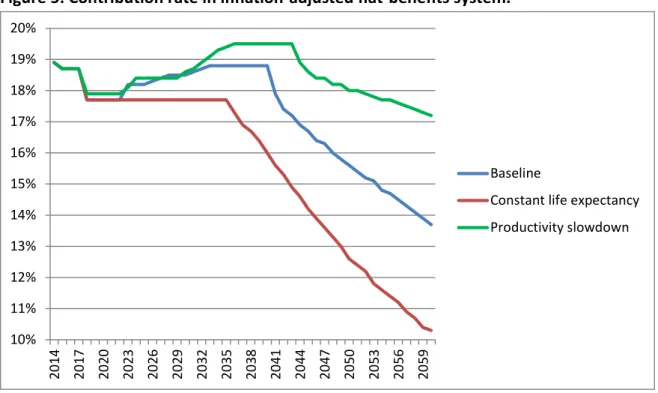
The contribution rate to this system is first increasing and then declining due to the erosion effect of the pension benefits. This Up and Down happens because the erosion effect is stronger than the effects of population aging. Relative to the base case, the contribution rate is higher in the productivity slowdown scenario since the benefits increase relative to wages,
18% 20% 22% 24% 26% 28% 30% 32% 34% 36% 38% 40% 42% 44% 46% 48% 50% 20 14 20 17 20 20 20 23 20 26 20 29 20 32 20 35 20 38 20 41 20 44 20 47 20 50 20 53 20 56 20 59 Baseline
Constant life expectancy Productivity slowdown
17
see Figure 5. If productivity would not only slow down but even decline, this may precipitate a financially unsustainable situation relative to the baseline scenario.
Slower population aging, in turn, reduces the contribution rate necessary to balance the pen-sion system’s budget relative to the base case. The two changes relative to the base case hap-pen to be of roughly the same magnitude but work in the opposite directions. This is a coin-cidence given the assumed parameters.
Figure 5: Contribution rate in inflation-adjusted flat-benefits system.
System 5 (Fully funded-DB): Fully funded pension systems suffer from lower interest rates
due to the productivity decline. Whether this suffering is larger or smaller than for PAYG sys-tems depends on the reaction of interest rates to productivity growth. If we assume that higher/lower labor productivity is translated one-to-one into higher/lower interest rates, then the relative effects (i.e., comparing the “Productivity slowdown” scenario with the “Baseline” scenario) are numerically equal to the PAYG case.
If the fully funded system is of the defined benefit type, retirees are shielded from benefit declines in spite of declining capital returns. The sponsors of the system, however, have to increase their contributions. Hence, the financial sustainability of the system may be endan-gered.
If the sponsors are enterprises, this will cut in their profits. In turn, this may trigger output price increases and/or reduce gross wages during a wage bargaining process. The final inci-dence for workers and retirees depends on many parameters such as the price elasticity of demand and the bargaining powers of employers and workers.
10% 11% 12% 13% 14% 15% 16% 17% 18% 19% 20% 20 14 20 17 20 20 20 23 20 26 20 29 20 32 20 35 20 38 20 41 20 44 20 47 20 50 20 53 20 56 20 59 Baseline
Constant life expectancy Productivity slowdown
18
If the FF system is based on mutual funds, the lower return due to the productivity decline has to be compensated by higher contributions of the active population in order to maintain the actuarial balance. In this respect, the FF-DB system becomes akin to a PAYG-DB system. The main lesson here is that – as long as the DB promises are kept – FF-DB systems are similar as PAYG-DB systems in the sense that they cannot escape major macroeconomic disturb-ances.
On first sight, FF systems are independent from demographic aging since each generation pays into a fund and then receives benefits from that fund. Demography, however, does in-fluence the interest rate negatively. This effect is sometimes referred to as “asset meltdown” effect which is however a massively exaggerated choice of words, see Poterba (2004) and below. In a FF-DB system, this adds to the above-mentioned pressures.
System 6 (Fully funded-DC): If the fully funded system is of the defined contribution type,
retirees will receive lower pension incomes but the financial sustainability of the system is unaffected. This is of course the reason for the recent change in occupational pensions from DB to DC pensions. Pension adequacy in a relative sense is not endangered as long as produc-tivity is slowing down but not declining due to the combined effects of the producproduc-tivity slow-down and the “asset meltslow-down” effect. Börsch-Supan et al. (2006) estimate that the latter effect is equivalent to a loss of 1 percentage point; hence this case is more favorable also in terms of absolute adequacy than the PAYG-DC case.
System 7 (PAYG system with government subsidies): So far, we have assumed that pension
systems have an independent budget strictly separated from the government budget. In many countries, including the US, this is not the case. If the budget of the PAYG pension sys-tem is not independent from, or even part of, the government budget which is paid by taxes that are not a fixed percentage of wages, there are various spillover effects due to the mis-match between the (implicit) indexation mechanisms of revenues and the (implicit) indexa-tion mechanisms of expenditures (e.g., rate of inflaindexa-tion, rate of wage growth, interest rate). These spillover mechanisms can be negative via declining tax income from earnings or posi-tive via declining debt service costs due to lower interest rates. An analysis of such a case needs to be tailored to the specific public finance system of a country and all its details.
System 8 (German hybrid PAYG system): Most European countries have mixed and hybrid
systems. “Mixed” systems consist of several parallel “pillars” (e.g. PAYG public, DB occupa-tional, DC private). “Hybrid” systems emerge when the system combines DC and DB elements according to equation 7 in Section 3. Examples are the Swedish and Italian NDC systems and the German “sustainability” system. The impact on pension income and financial sustainabil-ity can then be derived as a combination of the above prototypical systems.
19
We show as example the German public PAYG pillar which represents a hybrid between a DB and a DC system. The results are therefore a combination of what we already learned by stud-ying Systems 1 and 2. They are displayed in Figures 6 and 7.
Figure 6: Contribution rate in earnings-related hybrid system.
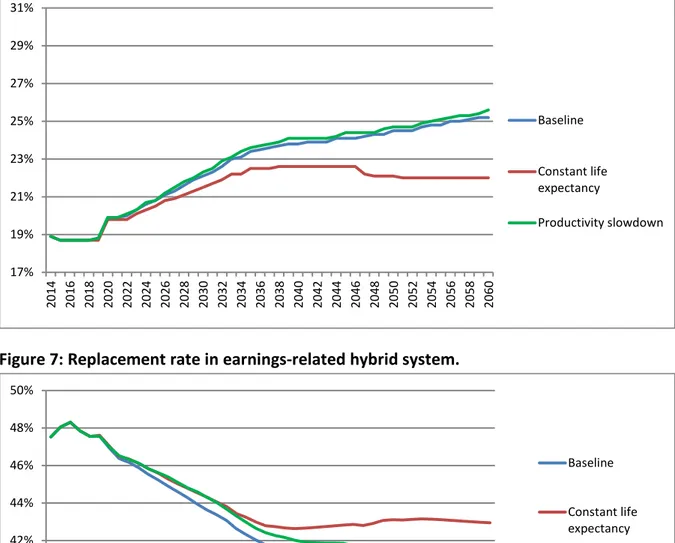
Figure 7: Replacement rate in earnings-related hybrid system.
Since the budget balance of the PAYG system in terms of the wage bill is unaffected by the productivity slowdown, both contribution rate and replacement rate are (almost) identical for the “Baseline” and the “Productivity slowdown” scenarios. Relative adequacy is not af-fected.
In absolute terms, the pension system’s budget shrinks in proportion to the wage bill and as long as the system is fully wage-indexed, employment is fixed and there are no nominal min-imum benefits rules, the financial sustainability of the system is not affected.
17% 19% 21% 23% 25% 27% 29% 31% 20 14 20 16 20 18 20 20 20 22 20 24 20 26 20 28 20 30 20 32 20 34 20 36 20 38 20 40 20 42 20 44 20 46 20 48 20 50 20 52 20 54 20 56 20 58 20 60 Baseline Constant life expectancy Productivity slowdown 36% 38% 40% 42% 44% 46% 48% 50% 20 15 20 17 20 19 20 21 20 23 20 25 20 27 20 29 20 31 20 33 20 35 20 37 20 39 20 41 20 43 20 45 20 47 20 49 20 51 20 53 20 55 20 57 20 59 Baseline Constant life expectancy Productivity slowdown
20
The same argument as given for Systems 1 and 2 holds for adequacy in absolute terms (“ab-solute poverty concept”). Even the slowed down productivity growth dominates the decline in resources due to population aging. Public policy action is thus inapproriate.
5. Adaptation
The second part of the paper is concerned with public policy actions. As the preceding discus-sion of the eight systems has shown, we do not think that public policy action is required for those systems that are self-stabilizing. And even in those cases in which this is not the case, population aging is still slower than productivity increase even in the case of the assumed productivity slowdown, hence absolute pension income levels will still increase, albeit much slower than retirees have been used to.
If this slower increase appears politically unacceptable, public policy actions should be tar-geted to increase the quantity of labor and capital in order to offset the lower than previously expected value of labor (due to lower productivity) and capital (due to lower interest rates) which has been precipitated by the productivity slowdown. We analyze five types of adapta-tion: working longer, working more, allowing more migration, saving more, and educating better.
We first use a very simple back-on-the-envelope calculation to assess the orders of magnitude necessary to increase quantity in order to compensate for the loss in value. A reduction of labor productivity from 1.5% p.a. to 0.9% p.a. corresponds to a loss of about 20% in productive capacity between 2020 and 2050. Quantity therefore has to increase by about 20% in this time frame in order to compensate for that loss. This is a large number which may have neg-ative feedback effects on wages and/or the interest rate. We therefore also briefly discuss how large these feedback effects are, based on results from published macroeconomic stud-ies which use overlapping generation models that are calibrated to European data and simu-late the key parameters of pension systems in aging populations.16
Working longer. Shifting the average exit age from the labor force increases the work force which contributes to the pension system. If the claiming age is shifted at the same time, the system gains from a double bonus: more contributors to, and fewer beneficiaries from, the pension systems. Using the above figures and assuming that exit and claiming age are in synch, the length of a working life has to increase from roughly 40 years in 2020 to about 48 years in 2050. Assuming the same start of the working life and a current “retirement age” at 62, we would need a “retirement age” at 70 in 2050. Given the current political preferences, this is not a trivial policy action.17
We put “retirement age” in quotes since labor force exit age and pension claiming age tend to be increasingly different. So called flexibility reforms try to disentangle these two dates
16 The basic methodology was introduced by Auerbach and Kotlikoff (1987). 17 To say the least. See Boeri et al. (2001 and 2002) and Galasso (2007).
21
even further. If people work longer but keep claiming their pensions early, not much is gained; in particular if people working past their claiming age do not contribute to the pension sys-tem. As Börsch-Supan et al. (2017a and b) show, the effect may even be negative since theory and evidence suggest that more hours are lost before the typical retirement age when partial retirement is introduced than gained after the typical retirement age when the adjustment of benefits to the chosen claiming age are less than actuarial.18 In these systems, “soft”
flexi-bility reforms are thus no alternatives to a “tough” policy of increasing the claiming age. Increasing the claiming age may not work as well as intended. One also has to be sure that there will be no misuse of disability pensions and special pre-retirement arrangements as es-cape routes for those workers which are not qualified for these pathways to retirement. Be-fore the 1992-2005 pension reform sequence in Germany, the rule of thumb was that a 1-year increase in the statutory claiming age increased the average claiming age only by 4 months due to such slippage in the system. After many pathways have been closed in reaction to the 1992-2005 pension reforms, this slippage is probably considerably smaller as the recent increase in the claiming age appears to show.19
If the pension system is fully actuarial – which none of the European systems actually is, and the US system only between age 60 and 65 – then by definition a change in the claiming age does not change the financial balance of the system.
The macroeconomic feedback effects of this gradual increase in the labor force on wages are small. This has been shown by Börsch-Supan et al. (2014).
Increasing the average exit age and thus labor force participation at older ages may be of little effect if labor productivity declines with age as is commonly assumed. The evidence, however, is inconclusive. The more sophisticated econometric analyses are used to measure the age-productivity profile and purge them from selection effects, the flatter the age-age-productivity profile turns out (Göbel and Zwick 2009; Börsch-Supan and Weiss 2016).
Working more. If the younger generation works more (higher labor force participation; more weekly hours), the revenues of the pension system increase. Concentrating on weekly hours, the above back-on-the-envelope calculation suggests that one needs to extend a 40-hours week to 48 hours in order to increase the labor volume by that amount that is necessary to offset the negative impacts of a productivity slowdown. Again, this is a large increase, in par-ticular for France and some Mediterranean countries.
Fostering well-trained migration. We apply again the above back-on-the-envelope calcula-tion. France has a work force of 30 mio, Germany of 43 mio and Italy of 26 mio. Increasing this work force by 0.6% p.a. to offset the productivity decline of the same magnitude suggests
18 Börsch-Supan et al. (2017a and b) provide both theory and international evidence. Graf et al. (2011) provide
supporting detailed evidence for the flexibility reform in Austria.
22
that France needs to attract 180.000, Germany 260.000 and Italy 160.000 well-trained mi-grants annually from 2020 to 2050. During the unusual year of 2015, France received 190.000, Germany 950.000 and Italy 200.000 migrants. Only a small fraction was well-trained, how-ever, and the year 2015 was a political shock for Europe. We thus speculate that this is an entirely unrealistic option.
Saving more. Saving more in a PAYG system is tantamount to building up a new pillar that compensates for the loss in real wages and related pension benefits. This strategy was one of the backbones in many pension reforms between 1190 and 2010 in Europe, e.g. the manda-tory “premium pension” in Sweden, the voluntary “Riester pensions” in Germany and the re-cent nudging approaches in the UK. A saving rate of 4% of earnings during the entire working life offsets the loss in pension benefits displayed in Figure 7 for the German hybrid system, based on a modest (but currently hard to achieve) real rate of return of 1.5%. The above back-on-the-envelope calculation suggests increasing this saving rate to about 5% in order to com-pensate for an even lower rate of return due to the productivity slowdown.
Whether this is a realistic option in a voluntary system is unclear and very much depends on the underlying assumptions about saving behavior. These assumptions are quite controversial (e.g. neoclassical vs. procrastination; interest elastic vs. target oriented). The current partici-pation rate for Riester pensions in Germany is slightly less than 50% and stagnant. Alternative investments such as occupational and unsubsidized private pensions cove an additional quar-ter of the German population. Full coverage has not been achieved; it appears to go down rather than up. It is of course much easier to fulfill this aim in a mandatory system such as in Sweden or a nudging system such as in the UK.
Higher saving has several feedback effects. In contrast to labor supply, we do not think that they can be ignored. Higher forced saving (in mandatory funded systems, both public and private) may crowd out other saving. The literature provides contradictory results20. A
transi-tion to more funding and less PAYG depresses interest rates even further. Börsch-Supan et al. (2006) use a OLG macro model to estimate this effect. If funds are invested globally, this effect is negligible. It can become significant, however, if home bias incentivizes people to invest dominantly in the own country. The effects also depend on whether the additional savings are invested in government bonds (larger) or productive capital (smaller).
Educating better. Better education has obvious direct and indirect effects. It directly mitigates the productivity decline and improves the budget of the pension system through higher earn-ings. However, we know very little about elasticity of changes in the education system with respect to labor productivity and even less about cost effectiveness.
23
This discussion shows clearly that one needs a policy mix. No single policy appears sufficiently strong to keep pension benefits and contribution rates at the same time at the pre-slowdown level.
6. Conclusions
The first key lesson for pension systems is that a productivity slowdown lowers the tide for all the boats. If pension benefits are consistently indexed to wages, neither financial stability nor relative adequacy is endangered, but the entire system shrinks in proportion to the wage bill. Depending on DB versus DC, the decline in absolute terms will make the older or the younger generation worse off than the preceding generation relative to the baseline at historical productivity growth rates.
This does not mean that absolute pension benefits will decline. This is the second lesson. Even a slower growth of labor productivity of about 0.9% p.a. is more than the annual loss in re-sources due to population aging (about 0.5% p.a.). While under historical growth rates of la-bor productivity (some 1.5% p.a.) this left a full percentage point for annual benefits in-creases, it is now substantially less at only 0.4% -- but still positive.
If this is politically unacceptable, one has to increase labor or capital volume. We have shown that no single policy action is sufficient to carry the entire burden of keeping pension benefits and contribution rates at the same time at the pre-slowdown level. Rather, one needs a policy mix consisting of working longer, working more, allowing more migration, saving more, and educating better.
24
7. References
Auerbach, A. J., & Kotlikoff, L. J. (1987). Dynamic Fiscal Policy. New York, USA: Cambridge University Press.
Boeri, T., Börsch-Supan, A., Tabellini, G. (2001). “Would you like to shrink the welfare state? The opinions of European citizens”. Economic Policy 32, 9-50.
Boeri, T., Börsch-Supan, A., Tabellini, G. (2002). “Would You Like to Reform the Pension System? The Opinions of European Citizens”. American Economic Review 92, 396-401.
Börsch-Supan, A., Schnabel, R., Kohnz, S., Mastrobuoni, G. (2004). “Micro-modeling of retirement decisions in Germany”. In: Gruber, J., Wise, D. (Eds), Social Security Programs and Retirement Around the World: Micro-Estimation. The University of Chicago Press, Chicago.
Börsch-Supan, A., Wilke, C.B. (2005). “The German Public Pension System: How it will become an NDC System Look-Alike”. In: Holzmann, R., Palmer, E. (Eds.), Pension Reform – Issues and Prospects for Non-Financial Defined Contribution (NDC) Schemes, The World Bank, Washington D.C.
Börsch-Supan, A., Ludwig, A., Winter, J. (2006). “Aging, pension reform, and capital flows: A multi-country simulation model”. Economica, 73, 625-658.
Börsch-Supan, A., Härtl, K., Ludwig, A. (2014). “Aging in Europe: Reforms, International Diversification, and Behavioral Reactions”. American Economic Review P&P 104, 224-229.
Börsch-Supan, A., Bucher-Koenen, T., Coppola, M., Lamla, B. (2015). “Savings in times of demographic change: Lessons from the German experience”. Journal of Economic Surveys 29, 807-829.
Börsch-Supan, A., Weiss, M. (2016). “Productivity and age: Evidence from work teams at the assembly line”. The Journal of the Economics of Ageing 7, 30-42.
Börsch-Supan, A., Härtl, K., & Leite, D. N. (2016). Social security and public insurance.
Handbook of the Economics of Population Aging, 1B, 781-863.
Börsch-Supan, A., Bucher-Koenen, T., Kutlu-Koc, V., & Goll, N. (2017a). Dangerous Flexibility-Retirement Reforms Reconsidered. MEA Discussion Paper 03-2017, MEA - Max Planck Institute for Social Law and Social Policy, forthcoming in Economic Policy. Börsch-Supan, A., K. Härtl, D. N. Leite (2017b). Earnings test, non-actuarial adjustments and
flexible retirement. MEA Discussion Paper 05-2017, MEA - Max Planck Institute for Social Law and Social Policy.
25
Corneo, G., Keese, M., Schröder, K. (2009). “The Riester Scheme and Private Savings: An Empirical Analysis Based on the German SOEP”. Schmollers Jahrbuch 129, 321-332.
Franco, D., Sartor, N. (2005). “Notional Defined Contribution in Italy: Unsatisfactory Present, Uncertain Future”. In: Holzmann, R., Palmer, E. (Eds.), Pension Reform – Issues and Prospects for Non-Financial Defined Contribution (NDC) Schemes. The World Bank, Washington D.C.
Galasso, V. (2007). The Political Future of Social Security in Aging Societies. MIT Press, Cambridge.
Göbel, C., Zwick, T. (2009). “Age and Productivity – Evidence from Linked Employer Employee Data”. De Economist 160, 35-57.
Graf, N., Hofer, H., Winter-Ebmer, R. (2011). “Labor supply effects of a subsidized old-age part-time scheme in Austria”. Zeitschrift für ArbeitsmarktForschung 44, 217-229. Holthausen, Annette; Rausch, Johannes; Wilke, Christina Benita (2012): MEA-PENSIM 2.0:
Weiterentwicklung eines Rentensimulationsmodells, Konzeption und ausgewählte Anwendungen , MEA Discussion Paper 03-2012
Lynch, J., and M. Myrskyl (2009). “Always the third rail? Pension income and policy preferences in European democracies”, Comparative Political Studies 42, 1068-1097.
OECD (2015a). Pensions at a Glance, OECD, Paris.
Palmer, E. (2002). “Swedish Pension Reform, How Did It Evolve, and What Does It Mechan for the Future?”. In: Feldstein, M., Siebert, H. (Eds.), Social Security Pension Reform in Europe. The University of Chicago Press, Chicago, London.
Poterba, J. M. (2004). “Impact Of Population Aging On Financial Markets In Developed Countries”. FRB Kansas City - Economic Review 89, 43-53.
Rausch, Johannes; Gasche, Martin (2016): "Beitragsentwicklung in der Gesetzlichen Krankenversicherung und der Sozialen Pflegeversicherung – Projektionen und Determinanten". In: Zeitschrift für Wirtschaftspolitik, 65 (2016) (3), pp. 195-238. Safire, W. (2007). The Third Rail. The New York Times Magazine, New York.
Queisser, M., & Whitehouse, E. (2006). Neutral or fair? Actuarial concepts and pension sys-tem design’. OECD Social, Employment and Migration Working Papers, No. 40, Paris. Wilke, Christina Benita (2004): "Ein Simulationsmodell des Rentenversicherungssystems: