HAL Id: hal-01424652
https://hal.archives-ouvertes.fr/hal-01424652
Submitted on 2 Jan 2017
HAL is a multi-disciplinary open access
archive for the deposit and dissemination of
sci-entific research documents, whether they are
pub-lished or not. The documents may come from
teaching and research institutions in France or
abroad, or from public or private research centers.
L’archive ouverte pluridisciplinaire HAL, est
destinée au dépôt et à la diffusion de documents
scientifiques de niveau recherche, publiés ou non,
émanant des établissements d’enseignement et de
recherche français ou étrangers, des laboratoires
publics ou privés.
A highly adaptable probabilistic model for self-diagnosis
of GPON-FTTH access network
Serge Romaric Tembo Mouafo, Sandrine Vaton, Jean-Luc Courant, Stephane
Gosselin
To cite this version:
Serge Romaric Tembo Mouafo, Sandrine Vaton, Jean-Luc Courant, Stephane Gosselin. A highly
adaptable probabilistic model for self-diagnosis of GPON-FTTH access network. SoftCOM 2016 :
24th International Conference on Software, Telecommunications and Computer Networks, Sep 2016,
Split, Croatia. pp.1 - 5, �10.1109/SOFTCOM.2016.7772106�. �hal-01424652�
A highly adaptable probabilistic model
for self-diagnosis of GPON-FTTH access network
Serge Romaric Tembo
Orange Labs Lannion, France sergeromaric.tembomouafo @orange.com
Sandrine Vaton
T´el´ecom Bretagne Brest, France sandrine.vaton @telecom-bretagne.euJean-Luc Courant
Orange Labs Lannion, France jeanluc.courant @orange.comSt´ephane Gosselin
Orange Labs Lannion, France stephane.gosselin @orange.comAbstract—Model-based approaches for self-diagnosing of telecommunication networks develop reasonings based on formal and explicit representation of network structure and network behavior. Network behavior modeling is a central issue for these methods. In a recent work, we have proposed a model of architecture and fault propagation of the FTTH (Fiber To The Home) access networks based on GPON (Gigabit capable Passive Optical Network). This model is based on a Bayesian network which encodes expert knowledge about the transport network and the connection network of subscribers. In this paper we extend this model by designing a model of the distribution network which fits to the various engineering techniques of the GPON-FTTH network. We carried out self-diagnosis of an operating GPON-FTTH network based on these two models. The performance of self-diagnostic of the new model is evaluated with respect to the previous model of the GPON-FTTH network.
I. INTRODUCTION
Network behavior modeling is a central issue for model-based approaches [1] [2] [3] [4] [5] [6] of self-diagnosis of telecommunication networks. Indeed, carrying out self-diagnosis of a telecommunication network with a model-based approach requires building an explicit representation of network architecture and network behavior. Network archi-tecture describes physical interconnections between network components. Network behavior, also called fault propagation, describes how faults and alarms propagate through the dis-tributed network architecture. Network structure and network behavior are then modeled [7]. The obtained model is the support of reasoning algorithms which must be designed. The model based approach is easy to deploy and is appropriate for a large scale network if information on network resources is available [16].
In [8], we have proposed a model of fault propagation in GPON-FTTH (Gigabit Passive Optical Network-Fiber To The Home) access networks. This model is based on a Bayesian network [9]. This model embeds modularity and extensibility properties which facilitate adding a new network component to the model or removing a network component from the model. Dependencies of the Bayesian network encode expert knowledge acquired from ITU-T standards [10] [11] about the transport network and the connection network of subscribers. A causal graph models the chain of dependencies between faults or root causes, intermediate faults and observed alarms.
Conditional probability distributions quantify the strength of dependencies between nodes and their parents in the graph [12]. In [8] we obtained good results of self-diagnosis of the GPON-FTTH access network carried out with this model. This model correlates malfunctions and alarms of the transport network with those of the connection network. We called this model M0, the initial model of the GPON-FTTH network.
Since our main goal is to carry out efficient self-diagnosis of the GPON-FTTH network, in this article, we extend the initial model M0 by designing the model of the Optical
Distribution Network (ODN) of the GPON-FTTH network. This ODN model is a new component easily added to the initial model thanks to modularity and extensibility properties of the initial model. The ODN model designed in this paper fits to the various engineering techniques of the GPON-FTTH network. The new model M1 obtained models the full chain
of dependencies between faults or root causes, intermediate faults and observed alarms. The correlation of malfunctions and alarms is no longer limitted to the transport network and the connection network, but also includes now the distribution network.
We start this paper by recalling in Section 2 the description and the formalism of the initial model. Section 3 deals with the designing of a highly adaptable model of the optical distribution network of the GPON-FTTH access network. We evaluate this model by carrying out self-diagnosis of an operating GPON-FTTH access network in Section 4. Section 5 concludes this work.
II. THE MODEL OF THEGPON-FTTHNETWORK
The initial model of the GPON-FTTH access network de-signed in [8] is based on a generic model [8] of telecommuni-cation networks. The generic model is based on a very simple principle. Model the behavior of a telecommunication network amounts to model the behavior of components that constitute it. Each network component is modeled by two Directed Acyclic Graphs (DAG). One DAG (Layer 2 DAG) that models local fault propagation on the considered component. Another DAG (Layer 1 DAG) that models fault propagation between this component and components which are connected to it. Distributed fault propagation occurs between linked network components. By separating local fault propagation modeling
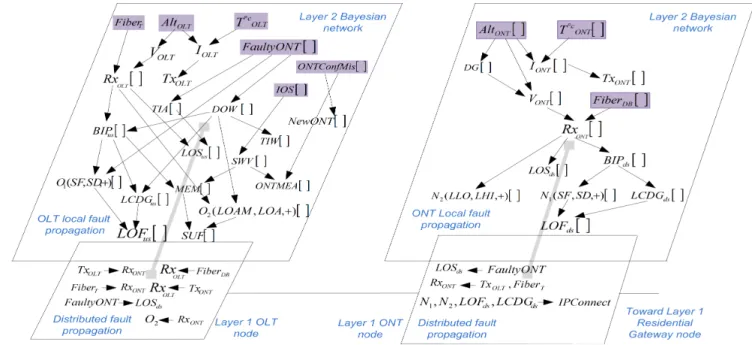
Fig. 1. The GPON-FTTH model based on the generic model
from distributed fault propagation modeling, the generic model also models network topology. The fault propagation model on a large scale telecommunication network of n components is decomposed in 2n sub DAGs interconnected [8]. This decom-position brings two useful easy self-reconfiguration properties to the model: modularity and extensibility.
Figure 1 presents the application of the generic layered model [8] for modeling of the topology and the behavior of a Passive Optical network (PON) of the GPON-FTTH access network. A PON is a point-to-multipoint link through the ODN. A PON has a tree-like topology which connects an Optical Network Terminal (OLT) with a maximum of 64 Optical Network Terminals (ONTs) in our example (see figure 2). Each ONT is connected to an RG (Residential Gateway) via an Ethernet link. Since there is no interaction between PONs, and all PONs have the same behavior, we modeled one single PON. This model can be replicated to any PON of a GPON-FTTH access network. Figure 2 shows a simple engineering of a PON.
Figure 1 is the initial model called M0. The model M0
includes the main component of the transport network called (OLT) and the main component of the connection network called ONT. Some variables called layer 2 nodes are vectors in order to respect the tree-like topology of a PON. We have three types of layer 2 nodes on figure 1: faults or root causes, intermediate faults and alarms. The root causes are highlighted on figure 1. The description of graph nodes and dependencies are given in [8]. See also ITU-T standards [10] [11].
III. OPTICALDISTRIBUTIONNETWORKMODELING
We propose in this section, a model of the ODN network of the GPON-FTTH access network. This model is a Bayesian network which models dependencies between splitters inside
ODN. The proposed model is highly adaptable since it fits to any engineering technique or configuration of a PON of the GPON-FTTH network.
The engineering of a PON is the physical topology of splitters used to distribute optical power from OLT between ONTsconnected to this PON. Note that each PON of a GPON-FTTH network may have a different engineering from those of the others PONs. Figure 2 shows the simplest engineering of a PON. We have only the first splitting level with one splitter used to distribute optical power from feeder fiber to drop fibers. In pratice, the engineering of a PON is made of many splitting levels with many interconnected splitters. This diversity of engineering techniques of the distribution network of a PON makes complex its modeling.
Fig. 2. A simple engineering of the GPON-FTTH network
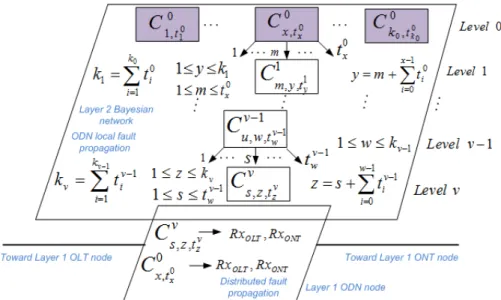
Nodes and dependencies of the dependency graph of the ODN model are automatically generated by a generic algo-rithm that we describe and formalize by the figure 3. Nodes of the causal graph are splitters and the dependencies represent optical links between them. The algorithm described and
Fig. 3. Model of the optical distribution network of a PON of the GPON-FTTH access network
formalized by the figure 3 requires two input parameters in order to build the ODN model. The first parameter is the ODN engineering, e.g. [(2, ), (2, 2), (16, 16, 16, 16)] depicted by the figure 4 is a simple example. In this example, we have three splitting levels. The first splitting level has one splitter with a rate of two. The second splitting level has two splitters both with a rate of two. The last splitting level has four splitters with a rate of sixteen each other. The second parameter is the configuration of links between the last splitting level of the ODN network and the connection network. The second parameter aims to know which drop fibers come from which splitter of the last splitting level.
As designed by the generic model in [8], the ODN model has two layers. The layer 2 is a DAG that models local fault propagation inside the ODN network. The layer 1 DAG models distributed fault propagation between the transport network and the ODN network on the one hand and between the ODN network and the connection network on the other hand.
The ODN network is made of several splitting levels. The layer 2 DAG (see figure 3) of the ODN model is also made of several splitting levels. The first splitting level noted level 0 on figure 3 has k0 splitters. Any splitter Cx,t0 0
x, i.e. the x
th
splitter, distributes optical power from one fiber to t0 x fibers
numbered from 1 to t0
x. Obviously, the first splitting level of
the ODN network of a PON of the GPON-FTTH network has only one splitter. But the ODN model proposed assumes that it will exist perhaps in the future, some configurations with more splitters. Any splitter Cp,q,tl l
q belongs to the splitting level l
with 0 < l ≤ v. We note p the fiber number which connects this splitter with the predecessor splitter in the splitting level l − 1. We note q and tl
q respectively as the splitter number in
the splitting level l and the rate of this splitter.
For example, each fiber numbered m coming from a splitter C0
x,t0
xof the first splitting level is linked to a splitter C
1 m,y,t1
y of
the second splitting level noted level 1. This optical connection
leads to a causal dependency between the two splitters. The index y ∈ {1, ..., k1} is the splitter number in the list of all
splitters of level 1. k1 is the overall number of splitters of
the splitting level level 1. k1 is determined by summing over
the rates t0
x for x ∈ {1, ..., k0}. The splitter Cu,w,tv−1v−1 w
of the penultimate splitting level level v −1, distributes optical power to tv−1w fibers. Each fiber numbered s ∈ {1, ..., tv−1w } is linked
to a splitter Cv s,z,tv
z of the last splitting level level v.
The last splitting level is the demarcation point between the ODN network and the connection network, i.e. each fiber coming from each splitter Cv
•,z,tv
z of the last splitting level is
the drop fiber of an ONT connected to the PON considered. That is why the state of these splitters impacts the upstream received power RxOLT and the downstream received power RxON T . These dependencies so-called distributed dependen-cies are part of the layer 1 DAG that models distributed fault propagation between ODN network, transport network and connection network. See figure 3.
Note that the combination of figure 1 and figure 3 forms the full model M1 of fault propagation on a PON of the
GPON-FTTH access network. The full model has three components: the transport network component, the distribution network component and the connection network component. Each component i is modeled by two DAGs. A layer 2 DAG L2Ni
and a layer 1 DAG L1Ni.
G =
3
[
i=1
L2Ni∪ L1Ni (1)
The model M1 is used to carry out self-diagnosis of the
GPON-FTTH network. Diagnosis computations are made on the large Bayesian network G defined by equation (1). Diag-nosis computations are based on the inference algorithm on the junction tree [13] of the Bayesian network G.
Fig. 4. A simple ODN engineering: [(2,), (2, 2), (16, 16, 16, 16)]
IV. SELF-DIAGNOSIS RESULTS OF AN OPERATING
GPON-FTTHNETWORK
In this section, we carry out self-diagnosis of an operating GPON-FTTH access network. In order the evaluate the ODN model, the performances of self-diagnosis based on the full model M1 and those based on the previous model M0 are
evaluated with respect to the GPON-FTTH network. Each table from table I to table V depicts a scenario and shows the beliefs of root cause nodes computed by our Python im-plementation of both models, based on observed and described evidence in the title of each table. Evidence are observations collected on the network, i.e. alarms, power levels, bit error rate, temperature, voltage, bias current and so on. Note that the figure 4 depicts the ODN configuration of PONs of forty ON T s considered for our experiments. The first ten, the second ten, the third ten and the fourth ten of ON T s are respectively connected to splitters C1,1,162 , C2,2,162 , C1,3,162 and
C2,4,162 of the last splitting level level 2.
TABLE I
PONWITH FORTYONTs. NO ALARM ON THEPON. UPSTREAM AND DOWNSTREAM RECEIVED POWERSRxOLT [1]ANDRxON T [1]OF
ON T1ARE LOW. THE RECEIVED POWER LEVELSRxOLT [i]AND
RxON T [i],WITHi 6= 1,OF NEIGHBORON T sARE NOMINAL.
.
Model Root causes States Beliefs
F iberT [OK, AT, BR] [0.99, 4.e-20, 3.e-22]
M0 F iberDB1 (1) [OK, AT, BR] [1.e-03, 0.99, 3.e-06]
F iberDBi6=1 [OK, AT, BR] [0.99, 8.e-02, 2.e-06]
F iberT [OK, AT, BR] [0.99, 4.e-20, 3.e-22]
M1 F iberDB1 (1) [OK, AT, BR] [1.e-03, 0.99, 3.e-06]
F iberDBi6=1 [OK, AT, BR] [0.99, 8.e-02, 3.e-06]
ODN [OK, ¬OK] [0.99, 1.e-08]
Table I describes a situation for which both models com-pute the good diagnosis, i.e. attenuation of the drop fiber F iberDB1 of ON T1. Note that OK, AT and BR denote
a fiber which does not attenuates, which attenuates or a
broken fiber. The state of the ODN network is good since all fibers and splitters on figure 4 are good, i.e. they correctly distribute optical power without losses. In this scenario the ODN network seems to be transparent as assumed by the model M0. Note that we say that a splitter is not good if
it distributes optical power with losses or its trunk fiber is broken or experiences attenuation.
TABLE II
PONWITH FORTYONTs. UPSTREAM AND DOWNSTREAM RECEIVED POWERSRxOLT [i]ANDRxON T [i]OFON Ti,FORi ∈ {1, ..., 10}ARE LOW, SIGNAL DEGRADEDSD[i]ALARMS ARE OBSERVED. THE RECEIVED POWER LEVELSRxOLT [j]ANDRxON T [j],FORj ∈ {11, ..., 40}OF
ON TjARE NOMINAL.
.
Model Root causes States Beliefs
F iberT [OK, AT, BR] [0.99, 4.e-20, 3.e-22]
M0 F iberDBi (1) [OK, AT, BR] [1.e-03, 0.99, 3.e-06]
F iberDBj [OK, AT, BR] [0.99, 8.e-02, 2.e-06]
C2
1,1,16 (1) [OK, ¬OK] [0.273, 0.727]
F iberT [OK, AT, BR] [0.99, 4.e-20, 3.e-22]
M1 F iberDBi (2) [OK, AT, BR] [0.24, 0.52, 0.24]
F iberDBj [OK, AT, BR] [0.91, 8.e-02, 2.e-06]
In Table II, the received power levels of all ten ON T s connected to the PON by the drop fibers coming from splitter C2
1,1,16 are low while the received power levels of others
ON T s connected to the same PON by the drop fibers coming from others splitters are nominal. The Model M0 diagnoses
that each drop fiber coming from splitter C2
1,1,16 experiences
attenuation. The model M0 ignores that low received power
levels may also due to power loss by the splitter. The model M1 understands that, the first most probable cause of low
received power levels of many ON T s connected to a splitter, is a malfunction of this splitter or attenuation of the trunk fiber of this splitter. Indeed, the model M1computes a podium
of two probable causes. The second cause is the attenuation of each drop fiber. The diagnosis result of the model M1 is
inside the ODN network. In the situation depicted by table II, a most propable faulty segment is the link between the splitter C2
1,1,16 of the last splitting level and the splitter C1,1,21 of the
penultimate splitting level.
TABLE III
PONWITH FORTYONTs. NO ALARM ON THEPON. UPSTREAM AND DOWNSTREAM RECEIVED POWERSRxOLT [i]ANDRxON T [i]OFON Ti,
FORi ∈ {1, ..., 20}ARE LOW. THE RECEIVED POWER LEVELSRxOLT [j]
ANDRxON T [j],FORj ∈ {21, ..., 40}OFON TjARE NOMINAL.
.
Model Root causes States Beliefs
F iberT [OK, AT, BR] [0.99, 4.e-20, 3.e-22]
M0 F iberDBi (1) [OK, AT, BR] [1.e-03, 0.99, 3.e-06]
F iberDBj [OK, AT, BR] [0.99, 8.e-02, 2.e-06]
C2
1,1,16 (1) [OK, ¬OK] [0.004, 0.996]
C2
2,2,16 (2) [OK, ¬OK] [0.004, 0.996]
M1 C1,1,21 (3) [OK, ¬OK] [0.010, 0.980]
F iberT [OK, AT, BR] [0.99, 4.e-20, 3.e-22]
F iberDBi (4) [OK, AT, BR] [0.24, 0.52, 0.24]
F iberDBj [OK, AT, BR] [0.91, 8.e-02, 2.e-06]
Table III describes a situation for which the model M1
isolates three probable faulty segments inside ODN network. A similar situation is described by the table IV for which the model M1 isolates two faulty segments inside ODN network.
TABLE IV
PONWITH FORTYONTs. UPSTREAM AND DOWNSTREAM RECEIVED POWERSRxOLT [i]ANDRxON T [i]OFON Ti,FOR
i ∈ {1, ..., 10, 31, ..., 40}ARE LOW, SIGNALDEGRADEDSD[i]ALARMS ARE OBSERVED. THE RECEIVED POWER LEVELSRxOLT [j]AND
RxON T [j],FORj ∈ {11, ..., 30}OFON TjARE NOMINAL.
.
Model Root causes States Beliefs
F iberT [OK, AT, BR] [0.99, 4.e-20, 3.e-22]
M0 F iberDBi (1) [OK, AT, BR] [1.e-03, 0.99, 3.e-06]
F iberDBj [OK, AT, BR] [0.99, 8.e-02, 2.e-06]
C2
1,1,16 (1) [OK, ¬OK] [0.004, 0.996]
C2
2,4,16 (2) [OK, ¬OK] [0.004, 0.996]
M1 F iberT [OK, AT, BR] [0.99, 4.e-20, 3.e-22]
F iberDBi (4) [OK, AT, BR] [0.24, 0.52, 0.24]
F iberDBj [OK, AT, BR] [0.91, 8.e-02, 2.e-06]
TABLE V
PONWITH FORTYONTs. NO ALARM ON THEPON. UPSTREAM AND DOWNSTREAM RECEIVED POWERSRxOLT [i]ANDRxON T [i]OFON Ti,
FORi ∈ {1, ..., 5, 11, ..., 15, 21, ..., 25, 31, ..., 35}ARE LOW. THE RECEIVED POWER LEVELSRxOLT [j]ANDRxON T [j],FOR
j ∈ {6, ..., 10, 16, ..., 20, 26, ..., 30, 36, ..., 40}OFON TjARE NOMINAL.
.
Model Root causes States Beliefs
F iberT [OK, AT, BR] [0.99, 4.e-20, 3.e-22]
M0 F iberDBi (1) [OK, AT, BR] [1.e-03, 0.99, 3.e-06]
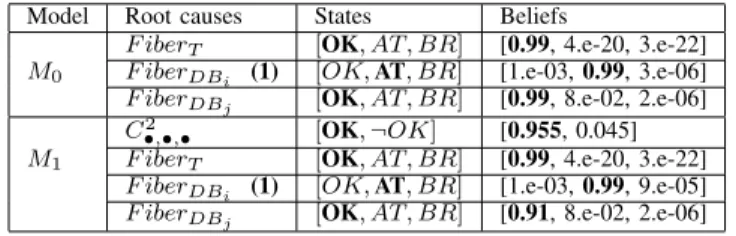
F iberDBj [OK, AT, BR] [0.99, 8.e-02, 2.e-06]
C2
•,•,• [OK, ¬OK] [0.955, 0.045]
M1 F iberT [OK, AT, BR] [0.99, 4.e-20, 3.e-22]
F iberDBi (1) [OK, AT, BR] [1.e-03, 0.99, 9.e-05]
F iberDBj [OK, AT, BR] [0.91, 8.e-02, 2.e-06]
Table V decribes a situation for which there are twenty ON T s on the PON with low received power levels. These twenty ON T s are spread over the four splitters of the last splitting level. The model M1does not diagnose any splitter as
faulty since each splitter of the last splitting level is connected to some ON T s with low received power levels and some ON T s with nominal received powers. Therefore the ODN network is not faulty in this case. It is rather the connection network which is faulty, .i.e. attenuation of drop fibers of the twenty ON T s with low received power levels.
V. CONCLUSION
We have proposed a model of the optical distribution network (ODN) of a PON of the GPON-FTTH access network. The ODN model is based on a Bayesian network and it fits to any engineering technique of a PON. The causal dependency graph of the Bayesian network is automatically build by a generic algorithm described and formalized in this article. The ODN model proposed forms with the initial model of the transport network and the connection network already designed in a last work, the full model of a PON which models the full chain of dependencies between fault, intermediate fault and observed alarms.
In order to evaluate the benefit of the ODN model, we car-ried out self-diagnosis of an operating GPON-FTTH network. The performances of self-diagnosis based on the full model of the GPON-FTTH network are evaluated with respect to those based on the initial model. There are some cases where the diagnosis was not exactly the same. Most of the time, the full model isolates a faulty link inside the ODN network.
REFERENCES
[1] B. Gruschke, “Integrated event management: Event correlation using dependency graphs,” A.S. Sethi (Ed.), Ninth International Workshop on Distributed Systems: Operations and Management, University of Delaware, Newark, DE, vol. 87, pp. 130–141, October 1998. [2] S. K¨atker, “A modeling framework for integrated distributed systems
fault management,” Proc. IFIP/IEEE International Conference on Dis-tributed Platforms, Dresden, Germany, pp. 187–198, 1995.
[3] K. Houck, S. Calo, and A. Finkel, “Towards a practical alarm correlation system,” in Proceedings of the fourth international symposium on Integrated network management, 1995, pp. 226–237.
[4] J. F. Jordaan and M. E. Paterok, “Event correlation in heterogeneous networks using the OSI management framework,” in Proceedings of the third international symposium on Integrated network management, 1993, pp. 683–695.
[5] S. K¨atker and K. Geihs, “A generic model for fault isolation in integrated management systems,” Journal of Network and Systems Management, vol. 5, no. 2, pp. 109–130, 1997.
[6] S. K¨atker and M. Paterok, “Fault isolation and event correlation for integrated fault management,” in Proceedings of the fifth international symposium on Integrated network management, 1997, pp. 583–596. [7] R. D. Gardner and D. A. Harle, “Alarm correlation and network fault
resolution using the Kohonen self-organising map,” Global Telecommu-nications Conference (GLOBECOM 1997), pp. 1398–1402, 1997. [8] S. R. Tembo, J. L. Courant, and S. Vaton, “A 3-layered
self-reconfigurable generic model for self-diagnosis of telecommunication networks,” in IEEE SAI International Conference on Intelligent Systems, INTELLISYS, London, 2015.
[9] J. Pearl, “Bayesian networks: A model of self-activated memory for evidential reasoning,” in Proceedings of the 7th Conference of the Cognitive Science Society, 1985, pp. 329–334.
[10] Telecommunication Standardization Sector of ITU, G.984.3 Recommen-dation. ITU-T, 2008.
[11] ——, G.977.1 Recommendation. ITU-T, 2003.
[12] J. Pearl, Probabilistic reasoning in intelligent systems: networks of plausible inference. Morgan Kaufmann, 1988.
[13] A. L. Madsen and F. V. Jensen, “Lazy propagation: a junction tree inference algorithm based on lazy evaluation,” Artificial Intelligence, vol. 113, pp. 203–245, 1999.
![Fig. 4. A simple ODN engineering: [(2,), (2, 2), (16, 16, 16, 16)]](https://thumb-eu.123doks.com/thumbv2/123doknet/12148311.311597/5.918.208.712.73.372/fig-a-simple-odn-engineering.webp)