HAL Id: hal-00796497
https://hal.archives-ouvertes.fr/hal-00796497
Submitted on 24 Feb 2021
HAL is a multi-disciplinary open access archive for the deposit and dissemination of sci-entific research documents, whether they are pub-lished or not. The documents may come from
L’archive ouverte pluridisciplinaire HAL, est destinée au dépôt et à la diffusion de documents scientifiques de niveau recherche, publiés ou non, émanant des établissements d’enseignement et de
Mining Spatio-Temporal Metadata for Satellite Images
Interpretation
Karim Saheb Ettabaa, Imed Riadh Farah, Mohamed Ben Ahmed, Basel
Solaiman
To cite this version:
Karim Saheb Ettabaa, Imed Riadh Farah, Mohamed Ben Ahmed, Basel Solaiman. Mining Spatio-Temporal Metadata for Satellite Images Interpretation. ICTTA 2008: IEEE International Conference on Information and Communication Technologies: From Theory to Applications ICTTA, Apr 2008, Damas, Syria. pp.1-6, �10.1109/ICTTA.2008.4530038�. �hal-00796497�
Mining Spatio-Temporal Metadata for Satellite
Images Interpretation
K. Saheb Ettabaâ(1,2), I. R. Farah (1) and M. B. Ahmed(1) (1)RIADI laboratory
School of Engineering and Computer Science Manouba, Tunisia
e-mail : [email protected]
e-mail : [email protected]
e-mail : [email protected]
B. Solaiman(2)
(2)ENST-Bretagne, laboratoire ITI Technopôle Brest Iroise CS 83818,
29238 Brest Cedex France e-mail : [email protected]
Abstract—Mining the growing data issued from the interpretation of remotely sensed images to obtain the necessary information for land cover change studies becomes more difficult and makes the data volume problem particularly acute. Mitigating this problem requires using data efficiently as metadata for mining and selecting appropriate data for change studies.
In this paper, we propose an integrate hierarchical approach based on the use of a blackboard architecture and multi-agent system and having a reasoning ability to find the best strategy to extract and create metadata about extracted objects. This architecture models relation-ship between objects and primitives extracted from images as metadata and use a transition diagram to handle temporal dependencies and perform the detection of temporal changes of objects.
We validate our approach on a set of multi-temporal Spot images, to model the evolution of detected object
Keywords-component: interpretation of remotely sensed images; hierarchical blackboard architecture; multi-agent system.
I. INTRODUCTION
Remotely sensed images have proved to be of great interest for earth resource assessment and environment monitoring. Automatic or semi-automatic analysis of these images becomes an important task in computer vision. Therefore important efforts have been made to increase the reliability of interpretation results of remotely sensed images. One of the most promising approaches is to exploit the metadata about the scene and the extracted objects in it.
The extraction of information from scene has been investigated in the domain of interpretation of digital images. Therefore the need for interpretation is obvious, as a task to automatically determine individual pixels or collection of pixels representing objects. Basic techniques for image interpretation are either pixel classification methods or structure based matching techniques. The major application in remote sensing lies in the automatic extraction of topographic features like roads, building, trees, etc. The main challenge is providing appropriate models for the objects founded in the
scene and making efficient use of data obtained through different sensors or in different time periods.
Increasing amounts of large data and information sets extracted from images require new analysis techniques. The domain of data mining investigates new paradigrns and methods adapted for scalability, flcxibility and problem abstraction for large data sets.
A scene is a dynamic canvas through which human and natural systems interact. Understanding the many factors influencing land cover change of a scene has been the focus of scientific study across multiple disciplines. Direct measurements are not sufficient to provide an understanding of the forces driving change. Linking spatial and temporal observations to empirical models provides a comprehensive approach to understand land-cover change [1]. One promising class of models designed to simulate and interpret is multi-agent system based on blackboard architecture which used as a collection of intelligent agents gathered around a hierarchical blackboard, looking for information written on it, thinking about the current state of the solution, and writing their generated conclusions on it. Each agent combines contextual information with a knowledge source to contribute toward the solution in opportunistic way. The blackboard acts as a shared memory, visible to all agents and permitting communication inter-agents instead of using point-to-point communication [1].
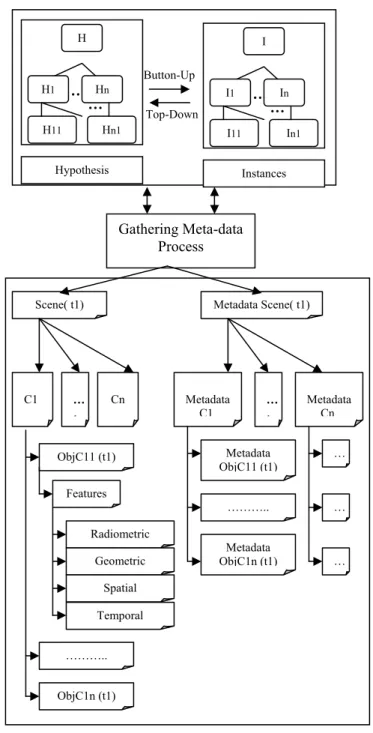
The sequence of interpretation was split up in two complementary processes, called top-down and bottom-up. In the top-down process, hypothesis, represented as hypothesis instance nodes, are generated from the possible occurrence of any expected object. Each one of the hypotheses corresponds to some concept of the conceptual network. The bottom-up process tries to validate the hypothesis in order to generate the symbolic description of the proposed scene. During the interpretation, the generic semantic network generates an associated network of instances based on the network hypothesis. Therefore, each object extract will be considered as a set of metadata.
We propose to work on a sequence of multi-temporal images, modeling the evolution of objects detected and
comparing their expected states to a model simulation. The remainder of this paper is organized as follows: in a first time, we present the blackboard architecture developer over the last decade. Then, we introduce the semantic networks. After that, we present the proposed architecture.
II. METADATA
Increasing amounts of large data and information sets require new analysis techniques. The domain of data mining investigates new paradigms and methods adapted for scalability, flexibility and problem abstraction for large data sets.
Metadata is structured information that describes, explains, locates, or otherwise makes it easier to retrieve, use, or manage an information resource. Metadata is often called data about data or information about information. The term metadata is used differently in different communities. Some use it to refer to machine understandable information, while others use it only for records that describe resources.
There are three main types of metadata:
- Descriptive metadata describes a resource for purposes such as discovery and identificndation. - Structural metadata indicates how compou objects
are put together.
- Administrative metadata provides information to help manage a resource, such as when and how it was created, file type and other technical information, and who can access it.
An important reason for creating descriptive metadata is to facilitate discovery of relevant information. In addition to resource discovery, metadata can help organize resources, facilitate interoperability and legacy resource integration, provide digital identification, and support archiving and preservation.
A. Structuring Metadata
Metadata schemes (also called schema) are sets of metadata elements designed for a specific purpose, such as describing a particular type of information resource. The definition or meaning of the elements themselves is known as the semantics of the scheme. The values given to metadata elements are the content.
Metadata schemes generally specify names of elements and their semantics. Optionally, they may specify content rules for how content must be formulated (for example, how to identify an object), representation rules for content (for example, capitalization rules), and allowable content values (for example, terms must be used from a specified controlled vocabulary).
Many current metadata schemes use SGML (Standard Generalized up Language) or XML (Extensible Mark-up Language).
XML, developed by the World Wide Web Consortium (W3C), is an extended form of HTML that allows for locally defined tag sets and the easy exchange of structured information.
SGML is a superset of both HTML and XML and allows for the richest mark-up of a document.
Useful XML tools are becoming widely available as XML plays an increasingly crucial role in the exchange of a variety of data on the Web. The attributes are grouped into eight categories:
- General, containing information about the object as a whole.
- Lifecycle, containing metadata about the objects evolution.
- ҏRelation, identifying related objects.
The Description Schemes are based on XML, and can be expressed in textual form suitable for editing, searching, filtering, and human readability; or in a binary form for storage, transmission, and streaming delivery. Since the full description of a multimedia object can be quite complex, the standard provides for a Summary Description Scheme geared to browsing and navigation.
B. Gathering Meta-data
The process of gathering metadata is flot trivial. Determination of all useful metadata can be expensive, so it is absolutely necessary to find an effective way to gather meta data.
This can be achieved by the following strategies:
- - Predefinition of a suitable order of gathering processes, by avoiding repeated calculations and by utilizing processes which supplement each other.
- - Dividing the gathering processes into automatic, semiautomatic calculations and user interactions with different levels of user support.
- - Taking account of time for meta data extraction for appropriate parameterizations of slow processes and or for avoiding long extractions.
-III. DISTRIBUTED BLACKBOARD ARCHITECTURE FOR MULTI
-TEMPORAL SCENE INTERPRETATION
The goal of our work is to propose a generic scene interpretation system. The main characteristic of such system is its reasoning ability in order to find the best strategy to extract visual information needed for this goal. To do this, it needs two kinds of knowledge which are descriptive and operational knowledge [2]. The descriptive knowledge used to describe the scene and the objects within. The operational knowledge used to describe how to combine different information to deduce new facts [3].
While the segmentation process, the system extract a large scale of information from multi-temporal images and the main difficulty is to select and process only the relevant information, to avoid problems like combinatorial explosion and very long processing time.
During the last two decades, several works concerning the interpretation of different types of scenes using the knowledge based approach have been successful. Among these works, we can cite the Sigma, Kids, Icare systems which based on an expert system, the Aerosol and Alain Boucher’s system which
based on multi-agent system [4], the Vision, MessieI and Skids system which based on blackboard architecture [5]. Unfortunately, none of them propose a generic architecture for a scene interpretation. In fact, the knowledge representation and the reasoning strategies in most of these systems are often application. This is a big drawback because that means new development have to be made for each new application [6]. But on the other hand, an important, fact emerges is the use of blackboard architecture [7] and semantic networks to model the evolution of dynamic objects.
IV. SEMANTIC NETWORK
A semantic network contains two different types of knowledge: declarative and procedural knowledge. Declarative knowledge consists of concepts and links, while procedural knowledge contains methods for determination of attributes of concepts as well as for valuation of concepts and relations. The declarative knowledge can be described by a marked and directed graph, where the nodes are attributed. Therefore, graph-theory can be applied for the control and analysis process within a semantic network [8].
Semantic networks consist of nodes and links, and are defined as directional acyclic graphs. Specifically, in our system, nodes represent the objects expected in the scene, whilst links describe the relations between the objects. In this context, the initial description of the scene contents, including nodes and links, is called conceptual semantic network. We define three different kinds of nodes: the class nodes represent classes of objects, the compound nodes represent objects detected in the scene and end nodes represent sets of attributes and characteristics for each object.
The sequence of interpretation can be split up in two complementary processes, called top-down and bottom-up. In the top-down process, hypothesis, represented as hypothesis instance nodes, are generated from the possible occurrence of any expected object. Each one of the hypotheses corresponds to some concept of the conceptual network. The bottom-up approach tries to validate the hypothesis. In this way, the interpretation process generates the symbolic description of the proposed scene [9].
A. Top-down process
The top-down process has the task to separate a region into sub-regions and to build hypothesis for the expected objects. The task is realized recursive from the upper nodes in the semantic network to the lower nodes. For this purpose any proposed agent can be integrated, which creates hypothesis for the sub-regions by means of four view points which are geometric, radiometric, spatial context and temporal. During the top-down-analysis the restrictions of the concepts are checked and hypothesis, which are not conform are deleted.
The depicted process chain is shown in figure1. The top-down step generates a hypothesis network; the bottom-up-step generates an instance network. Each semantic object specialist has its own detection strategy. In general way, a semantic object specialist starts by asking a low-level feature
extraction according to one of the semantic, object view point (geometry, radiometry and spatial context) and uses the others view points to validate the selected features. Therefore after the validation step, the scene could be described as a collection of different types of objects and each object as a collection of samples with different description and parameters as in figure2.
B. Bottom-up process
The bottom-up process has the following tasks:
x Extraction of object attributes and measurement of single objects.
Figure 1. Semantic scene description top-down and botton-up process H ….. H1 Hn H11 Hn1 … Hypothesis Button-Up Top-Down I ….. I1 In I11 In1 … Instances ObjC11 (t1) C1 Scene( t1) … . Cn Features ObjC1n (t1) ……….. Radiometric Geometric Spatial Temporal Gathering Meta-data Process Metadata Scene( t1) Metadata C1 … . Metadata Cn Metadata ObjC11 (t1) ……….. Metadata ObjC1n (t1) … … …
x Adaptation of the label images to the new obtained interpretation.
x Measurement of the new group, generated by the bottom-up-step. If the top-down-analysis reaches the leaf nodes, the analysis turns from model based interpretation to data based interpretation (bottom-up). The bottom-up process can also be extern programs, designed by the user. The top-down path can generate different hypothesis for one region. The bottom-up-step has to decide for an explicit interpretation for a region (figure 1).
V. THEPROPOSED ARCHITECTURE
This system has distributed hierarchical blackboard architecture (figure2) and based on a set of knowledge sources communicate through a multi-level data structure. The knowledge sources are structured in a three level hierarchy: Strategy, tasks and specialists [10].
Our system is composed of three modules which are the user control module, the dynamic reasoning module and the execution control module. Each level represents a different view of the goal resolution space. The hypothesis is the basic data unit of the blackboard and represents a partial solution. The agents are invoked by the control mechanism in response to a particular change on the blackboard [1].
The user control module is in charge of supervision and interaction with the operator. The blackboard structure of this module contains a symbolic description of the scene. The dynamic reasoning module is the center of intelligence of the intelligent control system. Strategies are received from the user control module. The blackboard structure of this module consists on three abstraction level hierarchies: Strategy, tasks and specialists [11], [12]. This module interacts with a knowledge base, object model base, scene metadata and a geographical information system. The object base model contains descriptions of semantic objects that have been pre-extracted from the images. Each object is defined through a set of features extracted from the image and a classification scheme that assigns semantics to regions of an image. As a result, different kinds of objects can be extracted from the same region of an image using different feature sets. The attributes of the object base model include the metadata used for extracting the objects, stored in a XML metadata file and uses keywords with a keyword type for each metadata object, in order to provide users a way to effectively find metadata of objects that verify some criteria. In order to improve the process, an XML template defining all the fields to be filled is used (figure3).
The execution control module is responsible for the execution of actions specified by the dynamic reasoning module. On each level the agent control is responsible of the management of the structure and for scheduling of the agents. Each level receives events from other levels or from other modules. On each level, a control agent identifies the event type and processes it. Types of events can be modifications of the blackboard data or signals of agent termination [13] [14]. < MetaModel-scene >
<Name scenee>...</ Name scene> ……….
<Sequence image>…< /Sequence image> <Object scene>
<Class Object1> <Object1.1>
<Name Object1.1>…</Name Object1.1> <geometric feature> ……….. </ geometric feature > <radiometric feature> ……….. </ radiometric feature > <spatial feature> ……….. </spatial feature > <temporal feature> ……….. </temporal feature > </Object1.1> <Object1.2> …………. </Object1.2> ……… <Object1.n> …………. </Object1.n> </Class Object1> <Class Object2> …………. Images Multi-spectrale Multi-temporelles User Control Module Strategies Specialist
Tasks Tasks Tasks
Specialist Specialist
Dynamic reasoning Module
Control execution module Contextual Information Base Knowledge Spatio-temporal Scene modeling User Query Base Model Gathering Meta-data Module Object Metadata Scene Metadata
</Class Object2> …….. <Class Objectp> …………. </Class Objectp> </Object scene> </ MetaModel-scene >
The evolution and change of system agents is supported by the architecture. The architecture of the multi-agent systems is able to cope with evolution of the system. New agents are able to enter the systems as knowledge source or control, whereas old agents may leave the systems [3] [15]. Agents are also adaptable to different environment. In this situation, agents are reusable in different systems and environments [6].
Applications like change detection and environmental monitoring require the analysis of images from different acquisition times. By comparing the current image with the latest interpretation derived from the preceding image, land use changes and new objects can be detected.
The temporal approach proposed employs a transition graph to describe the temporal dependencies between the classes of interest. The transition graph models the expected transition of objects in the scene.
Temporal changes can be formulated in a so called state transition graph where the nodes represent the temporal states and the edges model the state transitions. To integrate the transition graph in a semantic net the states are represented by concept nodes which are connected by a new relation: the temporal relation. As states can either be stable or transient, the corresponding state transitions differ in their transition time which can be also specified in the temporal relation. The start and end node of temporal relations may be identical forming a loop to represent that the state stays unchanged over time.
During the interpretation process [16], the state transition diagram is used by a new inference rule. Analysis starts with the first image of the given sequence marked with time t1. If a state of the state transition diagram can be instantiated completely, the temporal knowledge is used to hypothesize one or more possible successors of this state for the next image in the chronological order (time t2). The system selects all successor states that can be reached within the elapsed time
t2–t1 according to the transition times defined in the temporal
relations.
VI. VALIDATION
In order to validate our approach, we are carrying out the pre-processing of SPOT4 images. The basic system implemented by a multi-agent system was each agent associated to an operator located in the operator base and provided by the dynamic reasoning module. As an input, the satellite images (Figure4) used in our application is provided from different sensor like XS1, XS2, XS3 and XS4. Agents use unsupervised operators for classification provided by the operator base and evaluated by a Multi-agent Engine which
combine facts and rules provided from knowledge base [17] [18]. The output classified images (figure5) represent five classes (water zone, humid zone, bare soil, vegetation and dense vegetation). These classes allow the extraction of principal objects by means of radiometric, geometric and spatial features. This information was given as an input to the agent change detection in order to compute the similarity between objects and detect the change occurred in our zone of interest (figure 6). In our example, we cope with the transition occurred in the parcel zone and specially the transition from vegetation class to other classes. This transition was expanded with a state transition diagram to handle temporal dependencies to model relevant changes in the data (figure 7).
Figure 4. Spot4, XS3 images Im1 : 10/02/2001 Im2 : 03/05/2001 Im3 : 26/07/2001
Figure 5. Spot4, XS3 images classified C1: Bare Soil C4: Dense vegetation C2: Humide Zone C5 : Vegetation C3 : Water Zone
Figure 6. Parcel Transition Figure3. Scene metamodel
Im1 Im2 Im3
VII. CONCLUSION
We propose an integrated hierarchical approach based on the use of a hierarchical blackboard architecture and multi-agent system in order to increase the degree and the quality of interpretation. The proposal hierarchical architecture is motivated in order to reduce the information complexity and complex interpretation tasks which its main characteristic is its reasoning ability in order to find the best strategy to extract visual information needed for this goal. This configuration results from the auto-organization of our system and composed by agents who represent operators and having essentially a cooperative and a social attitude. This system organizes itself and stabilizes according to the reactions coming from its environment. The semantic net; employed in this architecture, models relation-ships between objects and primitives extracted from images as metadata. The system was expanded with a state transition diagram to handle temporal dependencies. The state transition diagram is used to perform the detection of temporal changes of objects.
REFERENCES
[1] K. S. Decker, J. Garvey, A. Humphrey, and R. Lesser. “A real-time control architecture for an approximate processing blackboard system”.
International Journal of Pattern Recognition and Artificial Intelligence,
7(2):265-284, 1993.
[2] P. Dalle, Y. Abchiche, “Agents de Médiation pour la Conception de Systèmes de Traitement d’images”, Colloque ALCAA (Agents Logiciels,
Coopération, Apprentissage & Activité humaine), Biarritz, France, 6-8
octobre 2000, pp. 08-20.
[3] F. Ealet, “Une architecture multi-agent pour la detection, la reconnaissance et l’identification des cibles”, Thèse de Doctorat en
Informatique, Université Joseph Fourier, France, 25 juin 2001.
[4] J. Dong, P. Alencar and D. Cowan. “A Behavioral Analysis and Verification Approach to Pattern-Based Design Composition”.
International Journal of Software and Systems Modeling, Springer-Verlag, Volume 3, Number 4, December 2004, Pages 262-272.
[5] O. Silva, A. Garcia and C. Lucena. “The Reflective Blackboard Architectural Pattern for Developing Large Scale Multi-Agent Systems”.
Proceedings of the First International Workshop on Software
Engineering for Large-Scale Multi-Agent Systems .pages 73-93, May
2002.
[6] I. R. Farah, K. Saheb Ettabaâ, I Hamdi and M. B. Ahmed “A generic
multi-Agent system for analysing spatial–temporal geographic information” PIERS 2006, Progress in Electromagnetics Research
Symposium, August 2006, Tokyo, Japan.
[7] R. Vincent, S. Moison and M. Thonat, “Learning as a means to refine a knowledge based system”, in proceeding of the Third Japanese
Knowledge Acquisition for Knowledge-based Systems Workshop,
Hatoyana, Japan, novembre 1994..
[8] H. Niemann, G. Sagerer, S. Schroder (1990a) Ernest: A semantic
network system for pattern understanding, IEEE Transaction on Pattern
Analysis and Machine Intelligence, pp. 257–269.
[9] R. Tonjes, S. Growe, J. Buckner, C. Liedtke, July1999. Knowledge-Based Interpretation of Remote Sensing Images Using Semantic Nets.
Photogrammetric Engineer-ing and Remote Sensing, 65(7), pp. 811-821.
[10] I. R. Farah, K. Saheb Ettabaâ, B. Solaiman et M. B. Ahmed “Analysing Spatial–Temporal geographic information based on blackboard architecture and multi-agent system”.. IJCSNS International Journal of Computer Science and Network Security, VOL.6 No.8A, August 2006. [11] D. Corkill. “Collaborating Software: Blackboard and Multi-Agent
Systems & the Future”. In Proceedings of the International Lisp
Conference, New York, New York, October 2003.
[12] N. Carver. A Revisionist View of Blackboard Systems. In Proceedings
of the 1997 Midwest Artificial Intelligence and Cognitive Science Society Conference, May 1997.
[13] H. Penny. “Blackboard Systems: The Blackboard Model of Problem– solving and the Evolution of Blackboard Architectures”. AI Magazine, 7 (2), 1986, pp. 38 - 53.
[14] H. Lassri, B. Maitre, T. Mondot, F. Charpillet, J. P. Haton. « Atome : a blackboard architecture with temporal and hypothetical reasoning”. Unité de recherche Inria Lorraine. Rapport de recherché, Juin 1987. [15] A. Kulkarni and S. McCaslin, “Knowledge discovery from multispectral
satellite images,” IEEE Geosci. Remote Sens. Lett., vol. 1, no. 4, pp. 246–250, Oct. 2004.
[16] C. Barnes, “Image-Driven Data Mining for Image Content Segmentation, Classification, and Attribution” Transactions on geoscience and remote sensing. Volume 45, Issue 9, Sept. 2007 Page(s):2964 - 2978
[17] K. Saheb Ettabaâ, I. R. Farah, And M. B. Ben Ahmed, “Analyse Intelligente d’une Séquence d’Images Satellitales pour le Suivi des Masses Nuageuses ». IEEE, SETIT, Sousse, Tunisie, Mars 2005. ISBN:0-7803-8663-9, IEEE Catalogue Number:04TH8771C, 2005 [18] V. Clement, G. Giraudon, S. Houzelle, F. Sandakly, “Interpretation of
remotely sensed images in a context of multisensor fusion using a multi-specialist architecture” Rapport de recherché N°1768, Unité de recherché Inria-sohia antipolis, octobre 1992.
[19] L. Zhu, A. Rao and A. Zhang. “Advanced feature extraction for keyblock-based image retrieval”. In Proceedings of International
Workshop on Multimedia Information Retrieval (MIR2000), pages 179–
183, Los Angeles, California, USA, November 4 2000.
[20] Lei Zhu, Aidong Zhang, Aibing Rao and Rohini Srihari. Keyblock: An approach for content-based image retrieval. In Proceedings of ACM
Multimedia 2000, pages 157–166, Los Angeles, California, USA, Oct 30
– Nov 3 2000
[21] R. T. Ng and J. “Han. Efficient and Effective Clustering Methods for Spatial Data Mining”. In Proceedings of the 20th VLDB Conference, pages 144–155, Santiago, Chile, 1994.
[22] J.R. Bach, C. Fuller, A. Gupta, A. Hampapur, B. Horowitz, R. Jain, and C.F. Shu. “The virage image search engine: An open framework for image management”. In Proceedings of SPIE, Storage and Retrieval for Still Image and Video Databases IV, pages 76–87, San Jose, CA, USA, February 1996.
[23] Bai, S., Salam, A., and Khosravi, E. Metadata Extraction from SVG Images Using A-tree. Proceedings of the 2005 International Conference on Data Mining (DMIN’05). Las Vegas, (June 20-23), 2005, 159-165. Figure 7. Graph transition modeling the parcel
transition Init Parcel Water Zone Humid Zone Bare Soil Dense Vegetation 15,7% 11,8% 0% 15,3% 54,7% t2 t2 t2 t2 t2 t3, 0% t3, 74. 8% t3, 0% t3, 2. 3% t3, 22. 9%