Business Process Analysis of Yield Data Flow at a
Newly Merged Pharmaceutical Company
by
Nan JIANG
Bachelor of Engineering in Aeronautical Engineering
Bachelor of Economics
Xiamen University, 2009
SUBMITTED TO THE DEPARTMENT OF MECHANICAL ENGINEERING IN
PARTIAL FULFILLMENT OF THE REQUIREMENTS FOR THE DEGREE OF
MASTER OF ENGINEERING IN MANUFACTURING
AT THE
MASSACHUSETTS INSTITUTE OF TECHNOLOGY
SEPTEMBER 2010
C 2010 Massachusetts Institute of Technology.
All rights reserved.
MASSACHUSETTS INSTITUTE OF TECHNOLOGY
NOV 0
4
2010
LIBRARIES
Signature of Author...
ADepartment 4 Mechanical Engineering
1..
Aug 17,2010
-- '' II Certified by... . ...
Stanley B. Gershwin
Senior Research Scientist, Department of Mechanical Engineering
Tsig Supervisor
Accepted by...
David E. Hardt
Ralph E. and Eloise F. Cross Professor of Mechanical Engineering
Chairman, Committee on Graduate Students
Business Process Analysis of Yield Data Flow at a
Newly Merged Pharmaceutical Company
by
Nan JIANG
Submitted to the Department of Mechanical Engineering on August 17, 2010
in Partial Fulfillment of the Requirements for the Degree of Master of
Engineering in Manufacturing
ABSTRACT
Tracking, monitoring, and documentation of the manufacturing performance are significant for pharmaceutical companies under the regulations of Food and Drug Administration (FDA). However, the current yield data are not consistent and the business procedures for yield data flow are not unified and optimized at the newly merged pharmaceutical company SJP Singapore. Therefore, a systematic analysis of the current yield data processing was performed in four facilities located at two campuses of this company.
Through this analysis, the current business procedures were visualized; the various yield concepts were clearly defined; the problems involved and their root causes were identified; the potential solutions were proposed; and a standard business process was developed taking into account the situation of each facility. As a result, the inconsistent yield data were harmonized and procedures in all four facilities were unified and standardized. This revised business process would enable each department to better fulfill its responsibilities and drive decisions on future improvements.
Keywords: business process, yield, data flow, pharmaceutical, API, postponement
Thesis Supervisor: Stanley B. Gershwin
ACKNOWLEDGEMENT
First and foremost, I would like to express my sincere gratitude to my thesis advisor, Prof. Stanley B. Gershwin for his guidance and his keen insight into the problem. His probing questions inspired me to uncover hidden opportunities in this project.
Next, I would like to appreciate Dr. Brian Anthony and Ms. Jennifer Craig for keeping track of the project progress and giving constructive advice to the thesis writing.
I would also like to thank the internship company for sponsoring this project. Special
thanks go to Mr. Paul D'Souza and Dr. Nicholas Almeida for their continuous support and encouragement throughout the period of internship. In addition, I would extend my gratitude to all the employees I have interacted with for their timely help.
TABLE OF CONTENTS
1. IN TROD U CTION ... 9
1.1. Project D escription ... 9
1.2. Com pany Background ... 10
1.2.1. Characteristics of the pharmaceutical industry: FDA restricted and capital intensive ... 10
1.2.2. Status in the industry: pharmaceutical industry market environment-more concerns on productivity... 11
1.2.3. Recent merger requires a common standard procedure... 11
1.3. Project M otivation ... 12
1.4. G oals... 14
1.5. Thesis Organization... 15
2. PROBLEM STA TEM EN T... 17
2.1. Current Problem Identification... 17
2.1.1. D ata Inconsistencies... 17
2.1.2. Invisible D ata Flow ... 18
2.1.3. D ata Processing Redundancies ... 18
2.1.4. D ata Flow Inefficiencies ... 19
2.1.5. N o Standard Procedure Exists ... ... ... 19
2.2. M ain Contributions... 20
3. TH EORETICA L BA CK GROUN D ... ... 21
3.1. D M A IC Approach ... 21
3.2. SIPOC ... 23
3.3. Business Process ... 24
3.4. D ata Flow D iagram ... 24
3.5. G ap A nalysis... 25
3.6. D CS, PI, D ata 3, SAP and JD E ... 25
4. M ETH OD O LO GY ... 26
4.2. Analyze and Improve... 29
5. PRODUCTION LINE SELECTION... 30
5.1. Product "T" at Pharm South ... 30
5.1.1. Pharmaceutical Processes Introduction... 30
5.1.2. In-line Product Introduction... 32
5.1.3. Product Selection by Process Comparison ... 33
5.2. API "Eto" at API South ... 35
5.2.1. API Processes Introduction... 35
5.2.2. In-Line Product Introduction ... 37
5.2.3. Product Selection by Process Comparison ... 37
5.3. Production Line Generalization at API W est ... 39
5.4. Product Introduction and Process Description at Pharm West... 40
6. CURRENT YIELD DATA FLOW ANALYSIS AT THE SOUTH CAMPUS ... 43
6.1. Potential Customers Identification from Tier Process... 43
6 .1.1. T ier P rocess... . 44
6.1.2. Potential Customers ... 46
6.2. Yield Definitions at Pharm South... 46
6.3. Data Flow Tracking at Pharm South ... 50
6.3.1. Data Flow Diagram... 51
6.3.2. Current Customers Analysis ... 56
6.4. Problems Identification at Pharm South... 59
6.4.1. Root Causes for Data Inconsistencies... 59
6.4.2. W orkflow Redundancies... 63
6.4 .3. Inefficiencies... . 63
6.5. Recommendations at Pharm South... 63
6.5.1. Yield Concepts Harmonization... 64
6.5.2. Yield Divergence Postponement... 64
6.6. Yield Definitions at API South... 66
6.7. Data Flow Tracking at API South ... 68
6.7.1. Data Flow Diagram... 69
6.8. Problems Identification at API South... 71
6.9. Recommendations at API South... ... 72
7. CURRENT YIELD DATA FLOW ANALYSIS AT THE WEST CAMPUS... 74
7.1. Tier Process at the West Campus ... 74
7.2. Yield Definitions at API West... 75
7.3. Data Flow Tracking at API West ... 77
7.4. Problems and Recommendations at API West ... 80
7.5. Yield Definitions and Data Flow Tracking at Pharm West... 81
7.6. Problems and Recommendations at Pharm West ... 86
8. D ISC U S S IO N ... . 87
8.1. Yield Data Flow Comparison... 87
8.2. Problems and Requirements for the New Business Process... 90
8.3. Standard Business Process... 92
9. C O N C LU SIO N ... 96
10. FU TU R E W O R K ... 98
APPENDIX - GLOSSARY... 100
LIST OF FIGURES
Figure 1: Comparison of Pharma and Hi-tech Industries [2]... 11
Figure 2: Business Process Development for Yield Data Flow Methodology ... 27
Figure 3: Pharm South Process Flow Diagram Comparison ... 34
Figure 4: API South Process Flow Diagram Comparison ... 38
Figure 5: API West Process Flow Diagram (Generalized)... 40
Figure 6: Pharm West Process Flow Diagram Comparison ... 41
Figure 7: Tier Process at the South Campus... 44
Figure 8: Data Flow Diagram Pharm South ... 52
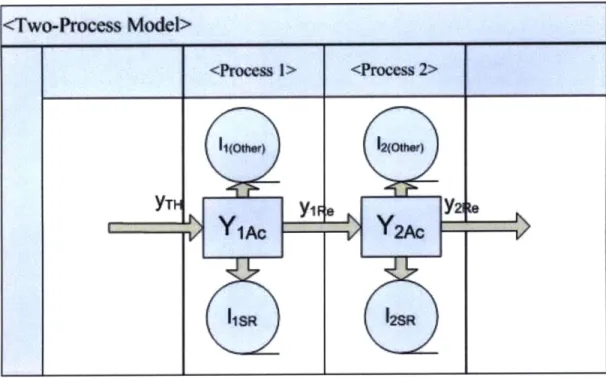
Figure 9: Tw o-Process M odel... 60
Figure 10: Data Flow Diagram API South ... 70
Figure 11: Organizational Structure at the West Campus ... 75
Figure 12: Data Flow Diagram API W est... 78
Figure 13: Data Flow Diagram Pharm W est... 83
LIST OF TABLES
Table 1: DM A IC Process in This Project ... 22
Table 2: Yield Calculation in Batch Sheets, Pharm South ... 54
Table 3: Product "Z" Yield Calculation in Batch Sheets, Pharm West ... 84
Table 4: Product "Na" Yield Calculation in Batch Sheets, Pharm West... 85
Table 5: Yield Data Flow Comparison ... 89
1.
INTRODUCTION
1.1.
Project Description
This thesis reports on yield data flow improvement at Company SJP Singapore. A systematic business process represented as a workflow chart, which defines the specific roles, responsibilities, and process standards of producing products was developed for this pharmaceutical company to continuously monitor and manage the production performance of all the in-line products measured by yield. To achieve this goal, the business process is expected to streamline the yield data flow and provide the visualization of yield status of the various products being manufactured in the company for the management team to decide on future improvements. Moreover, this process should align the data source, reduce or justify inter-department data inconsistencies and redundancies, and establish a standard data flow system.
To represent the different production nature of both pharmaceutical products and active pharmaceutical ingredient (API) products, and also to include the different data system environments at both south and west campuses, the current yield data flow at the two campuses of this company were tracked so as to identify the potential causes to the current inconsistencies in yield data. Four production lines were selected to be explored in sequence for detailed countermeasures, which were product "T", API "Eto", product "Z" and product "Na". Product "T" is a pharmaceutical product being manufactured at the south campus while API "Eto" is a chemical product being manufactured in the API facility at the south campus. Similarly, product "Z" and product "Na" are two pharmaceutical products of different types being manufactured at the west campus. These production lines were chosen because the processes involved are representative to cover more potential issues in the data flow. The products manufactured in the API facility at the west campus are generalized into a
1.2.
Company Background
Located at Singapore Tuas Biomedical Park, SJP Singapore is a subsidiary wholly owned by a global pharmaceutical company Superior & Co., headquartered in USA. Superior is research-driven, and develops and manufactures a variety of products to improve human and animal health.
1.2.1. Characteristics of the pharmaceutical industry: FDA
restricted and capital intensive
Since the pharmaceutical industry is strictly regulated by company regulatory bodies such as U.S. Food and Drug Administration (FDA), there are increasing needs of tracking, controlling and optimizing processes for companies who want to avoid FDA penalties. Furthermore, the operational efficiencies and plant performance can be greatly improved by process analytical technology and the concept of "Quality by Design". In furthering the objectives of "Quality by Design", FDA plays an instrumental role in ensuring the alignment of the many innovative applications, including the rapid corrective and preventive action (CAPA) that assures compliance of current good manufacturing practices (CGMP) maintaining process control and product quality [1].
Apart from the restrictions by FDA, it is the market characteristics of the pharmaceutical industry that drives the organizations to strive for quality excellence. Generally speaking, it takes a pharmaceutical company one billion US dollars to develop a new drug [2]. Therefore, any seemingly insignificant improvement would be of considerable value to a pharmaceutical company. Figure 1 is a graph demonstrating the feature of pharmaceutical industry as compared to Hi-Tech industry [2].
Process Maturity Yield
source - Ytemanons soc ety fo marmaeuTca EngP-reenn
* Pharma
U
Hi-techCost of Quality
Figure 1: Comparison of Pharma and Hi-tech Industries 121
1.2.2. Status in the industry: pharmaceutical industry market
environment-more concerns on productivity.
Previously, being one of the largest pharmaceutical companies in the world both in terms of revenue and market capitalization, Superior has every reason to secure its position in this steadily growing pharmaceutical market. According to IMS Health, the global pharmaceutical market will grow 5-8% annually through the next five years and the patient demand will remain robust [3]. Since it becomes more difficult to develop new blockbuster products to seize the market, and the patents of the old blockbusters are expiring, it is crucial for the companies to maximize the productivity of in-line products and the operational efficiency.
1.2.3. Recent merger requires a common standard procedure
Superior merged with another company in 2009. As a global leader, Superior is able to supply a broader range of products after the merger and has been on the track of
completing integration actions to achieve the target of $3.5 billion annual savings in 2012 [4].
The manufacturing facility at SJP Singapore is comprised of two campuses. The south campus is the former SJP Singapore before the merger and the west campus refers to the manufacturing facility of the acquired company. Both campuses in
Singapore are capable of the production of both API and pharmaceutical drugs, including the medicines in the cholesterol management, HIV treatment and respiratory areas.
However, it is also because the two campuses used to belong to two independent companies that they have entirely different organizations, management systems, work flow and databases, which make a standardized business process essential.
1.3.
Project Motivation
Driven by the regulations of FDA, most pharmaceutical companies have the incentives of employing a plethora of management systems and databases to support tracking, monitoring, and documentation of the production performance including release quantities and yield percentages. In spite of this, the assumption that the summarized historical yield data is accurate and effective may not stand given the invisible and unclear data flow chain. Comparing to the solid system of Standard Operating Procedures (SOP) that covers every single step of the manufacturing processes and the data collection methods, the further yield data processing and reporting procedures are not well defined probably due to different organizational structures in different companies, or even in different branches of the same company.
Being one of the manufacturing subsidiaries of a global leading pharmaceutical company, SJP Singapore is concerned about the productivity which contributes to its survival in the competitive market. The funding of a new drug could potentially be
saved by 1-2 % of yield improvements in the pharmaceutical industry [2]. Hence, a transparent optimized yield data flow process is of great value to the company. Like most of the other companies, the previous improvements focused more on the production itself, and apart from the continuous improvement engineers, all of the other departments have been striving to achieve better performances as well, neglecting to explore information streaming. Therefore, not only is a business process that standardizes the whole yield data flow chain filling in the gap so as to support the data accuracy, reliability and promptness, but also providing the management teams an effective tool to make judgments and decisions so as to improve the system responsiveness. Moreover, if applicable, this business process can be universalized and applied to other manufacturing environments, for instance, production lines, pharmaceutical plants, or even other industries, which proves the external and long term interests of the business process development.
In the special case of Company Superior, the business process for yield data flow performs a significant function as part of the integration actions. Since each company has their own database and management systems, the yield data flow certainly will not automatically merge to form a uniform report. Therefore, it is necessary to establish a common business process so that the new company is all aligned when it comes to the yield information. As the yield data is reviewed by a series of departments from the technicians who operate the equipment to the Integrated Process Team (IPT) Leader, it is crucial that the data they obtain deliver the same information so that all these vital experts are working toward the same direction. In addition, the yield improvement projects typically require the collaboration of multiple departments, sharing a single consolidated data platform would help facilitate the cooperation and avoid potential errors, format mismatches, and communicational problems during data transfer.
Once a systematic business process is established to streamline the yield data flow in a pharmaceutical company, the regulatory compliance can be increased at a lower cost. And a visible yield data source and summarized yield metrics report would be a
more reliable and effective signal enabling the managers and production leaders to identify potential opportunities of improvements.
1.4. Goals
To meet the needs of SJP Singapore, the business process should be able to provide the solutions to the aforementioned problems. Considering the special case of SJP Singapore, a series of requirements are summarized as follows.
First, this business process should help ensure the yield data accuracy. Since the yield data diverge mainly at two nodes in the current flow chain, the raw data source and the calculation of the yield percentage along the chain, this business process should not only unify the raw data source and avoid errors from the root, but also reduce the data inconsistencies downstream along the flow. The latter further requires root cause identification.
Secondly, this business process should improve efficiency. In this business process, the departments involved in yield calculation should be minimized so as to reduce redundant work. Apart from the number of departments, the priority of the yield data access should be well defined in the data flow. For instance, to improve the promptness of responses, the department which is most closely related to the process operating should be among the first to obtain the yield information so as to fix the problem effectively. The feedback loop should be shortened if possible. The efficiency can be measured in terms of labor hours and labor costs.
Thirdly, this business process should justify the reliability of the yield data calculated and submitted to the managers. Unlike other yield and discard projects aiming at improving a certain production line, the current status of yield data flow is not visible and not even depicted in details. As it is more difficult to quantify and evaluate the
accuracy, efficiency and effectiveness of a data flow, this business process should enable the visualization of the yield data flow and further streamline the current flow.
Furthermore, the business process should be general. Developing a business process itself is an investment to be rewarded. To maximize the value of this process, it should be applicable to most of the in-line products in the company.
Finally, the business process structure should be able to continuously support the yield data flow in future operations. Particularly, this business process should be relatively robust to external changes and minimize the effect of heuristics and other subjective factors. For instance, the collection of data should not be dependent on any experienced engineers or better performing departments; instead, it should be a standard procedure system insensitive to people or performance.
1.5.
Thesis Organization
This thesis is organized in ten chapters. Chapter 1 is the introduction of the whole project, including a brief description of the project, the background of Company SJP Singapore, the motivation for the company to launch this project, and the goals that the company expects to achieve. Chapter 2 is a more detailed problem statement. The current problems identified are stated in Section 2.1, while the contributions of this project in solving these problems are listed in Section 2.2. In Chapter 3, the relevant methodologies, and information about the data systems at SJP Singapore are provided with a theoretical background.
The business process development starts from Chapter 4, which is the methodology of how this project is performed to complete the procedure establishment. In Chapter
5, the various pharmaceutical and API processes and products are introduced and compared to justify the selection and generalization of the representative production lines to be studied in the following chapters. Subsequently, Chapter 6 and Chapter 7
provide a thorough analysis of the current business process of yield data flow at the south and west campuses, respectively. In these two chapters, the organizational structures of yield data processing at the two campuses are investigated; followed by specific definitions of the yield concepts, yield data flow tracking, customer analysis, problems and recommendations at each facility.
After the current business process and root causes of the problems are made visible
by the four yield data flow diagrams and detailed yield calculations in batch sheets, a
new business process is proposed in Chapter 8. In this chapter, the characteristics of the yield data flow in each facility are compared, followed by a gap analysis by summarizing the problems and setting requirements for the new business process. The new business process is developed based on these specific requirements.
2.
PROBLEM STATEMENT
2.1. Current Problem Identification
The current problems observed are listed in this section. These problems can be categorized into five types, which are data inconsistencies, invisible data flow, data processing redundancies, data flow inefficiencies, and lacking of standard procedure.
2.1.1. Data Inconsistencies
1) Multiple Yield Definitions
The yield data of a same batch of the same product submitted by different departments are observed to be different. The gap in between the numbers is not significantly large. However, this phenomenon persists. It is attributed to the multiple definitions being used by different departments in different facilities. However, they are not clearly defined and differentiated in the various documents, reports, and even conversations. Therefore, not only do yields diverge from the root by definition, but probably also along the data transmission path by people's perception.
2) Multiple Data Sources for Yield Calculation
There are a series of documents and data systems recording the various yield data, including the shop floor batch sheets, batch release report, Data 3 System, SAP System, Distributed Control System (DCS), and Plant Information (PI) System. However, the raw data sources are not explicit, which renders the yield data unwarranted.
2.1.2. Invisible Data Flow
Other than the raw data sources, the whole yield data flow is invisible. The structure inside the yield data flow box is not visible to the outside, with the only observable information being the input from the shop floor and the output of yield metrics. The complexity of the processing of yield data among a plethora of departments is far beyond the imagination of a linear transmission. Moreover, since each department is only responsible for a small portion in this flow, a big picture of the whole data transmission process is yet to be discovered.
2.1.3. Data Processing Redundancies
1) Multiple Department Calculations
From the observation of the various outputs of yield data, there are at least three departments calculating or exporting the yield data, including the continuous improvement (CI) engineers, process engineers, and Finance. They collect the yield information from different data sources and use it for different purpose. Nevertheless, if they eventually derive the same yield data, there should be opportunity to reduce the redundancy; on the contrary, if they eventually derive different yield data, then the inconsistency need to be analyzed and either justified or eliminated.
2) Only One Type of Yield Is Related to Problem-Solving
Even if all the departments have good reasons to calculate the different yield data and set different targets accordingly, only one type of yield can be technically improved and only the engineers are capable of this improvement. Other departments such as Finance are using them as operation metrics; setting targets cannot help solve the problems unless it is connected to the production in some manners.
2.1.4. Data Flow Inefficiencies
The yield data, as other parameters depicting the manufacturing performance, is measured to capture the atypicals and drive necessary improvements. However, the current yield data flow is not problem-solving oriented, namely, clearly defined path for prompt response to yield problems is not complete and the departments in charge of data processing and problem solving are partially parallel.
2.1.5. No Standard Procedure Exists
1) Two Campuses Differences
As mentioned in the introduction, the SJP Singapore is a combination of the south campus and west campus, which were two independent companies a few months ago. They have different data systems and organizational structures, not to mention the yield data flow process. Since there is no standard procedure for yield data flow, the data among the various products of the same type may not be compared effectively.
2) Two Facilities Differences
Even before a further analysis, the yield data flow has already been noticed to be different due to the different manufacturing natures. Most of the API processes are coupled, which is not the case for the pharmaceutical processes. A close-coupled process means the materials can flow inside the pipelines and containers without exposing to human factors. This kind of process can be fully controlled by
DCS and the data is therefore stored in P1 without manual calculation. The
pharmaceutical processes are modular designed to enable multipurpose production. Therefore, after manually transferred, the yield needs to be recorded at each stage, which is also manual calculation. These intrinsic characteristics explain why a common procedure does not exist yet.
2.2.
Main Contributions
Considering the current problems analyzed above, the following objectives are achieved by the business process developed in this work:
1) To avoid confusion and unnecessary errors, all the yield concepts being used in SJP Singapore will be defined with formulae given if there is a specific calculation of it. The current users of each yield concept will be identified and summarized.
2) The yield data will be tracked from the raw data source to the top level recipients of this information. In addition, a data flow diagram will be plotted in each facility at the two campuses of the whole company to provide a transparent look into the black box. These diagrams are prerequisite of the further analysis, problem and opportunity identification, and improvements to make in the business process.
3) After the data flow diagrams are plotted, the data inconsistencies, the workflow redundancies, and inefficiencies should all be identified. Possible solutions will be discussed and recommended.
4) Moreover, a standard business process which can be applicable to all of the four facilities in this company will be developed based on the analysis.
3.
THEORETICAL BACKGROUND
In this chapter, the basic methodologies used in this project are provided with theoretical background. Section 3.1 explains the principles of the DMAIC approach and it application in this project. Section 3.2 introduces the concept of SIPOC and clarifies its definition particularly in this thesis. Section 3.3 reviews the previous approaches to identify opportunities for business process improvements and to establish a new business process. The methods and logic for plotting a data flow diagram and the steps for performing gap analysis are briefly introduced in Section 3.4 and Section 3.5, respectively. Finally, the five different data management systems and their relations are described in Section 3.6.
3.1. DMAIC Approach
Define-Measure-Analyze-Improve-Control (DMAIC) is a problem-solving approach broadly used in business as a component of Lean Six Sigma methodology. The framework and implementation of this method were introduced explicitly and concisely by George, et al. [5]. Nunnally provided a detailed explanation of the application of DMAIC and Six Sigma in the pharmaceutical industry on controlling variation [6]. More emphasis was put on scoping in the define phase by Lynch, et al.
[7]. SJP Singapore is applying this concept in diverse projects execution following
the five basic steps:
1) Define the problem and launch the project, validate the scope and goals, collect voice of customer;
2) Measure the critical aspects of the current process, articulate the process through process mapping or value stream mapping, develop and execute a specific measurement plan, evaluate the performance of the process based on the measurement;
3) Analyze the inputs and outputs of the process, identify and investigate the root causes;
4) Improve the process based on the analysis, propose, prioritize and pilot the potential solutions;
5) Control the process after the implementation is launched, monitor and correct the deviation from targets, validate performance and document in standard operating procedures (SOP).
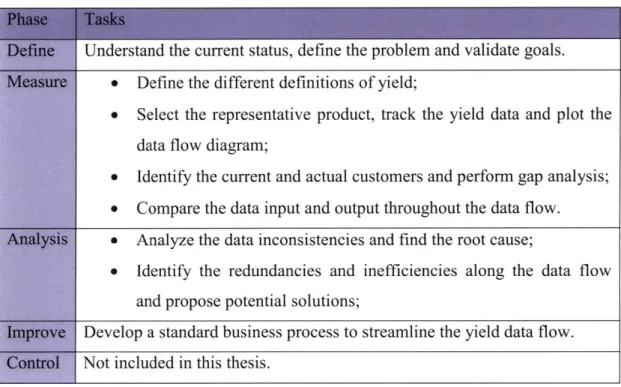
In this project, the first four phases have been completed with a business process established. The detailed steps are listed in Table 1. The implementation of this business process requires both administrative and operational arrangements which are out of the scope and beyond the time span of this project.
Table 1: DMAIC Process in This Project
Understand the current status, define the problem and validate goals.
" Define the different definitions of yield;
" Select the representative product, track the yield data and plot the
data flow diagram;
* Identify the current and actual customers and perform gap analysis;
e Compare the data input and output throughout the data flow.
* Analyze the data inconsistencies and find the root cause;
e Identify the redundancies and inefficiencies along the data flow and propose potential solutions;
Develop a standard business process to streamline the yield data flow. Not included in this thesis.
3.2.
SIPOC
Supplier-Input-Process-Output-Customer (SIPOC) is a high level diagram of a process to help define the customers of the project so as to satisfy the needs. As Basu
[8] pointed out, it can be applied during either the define phase or the measure phase
with its impact upon the entire project life cycle. This methodology consists of five elements:
1) Supplier: the provider of the input to the process;
2) Input: whatever required for the process, including labor, materials or information as in this project;
3) Process: the transformation steps of the input to output;
4) Output: the concerned product of the process, which is the reported yield data in this project;
5) Customer: the receiver of the delivered product.
The definitions of customer are different in Voice of Customer (VOC) and SIPOC. The customer in VOC is the customer of the project who is influence by it; while the customer in SIPOC refers to the customer of the process who receives the product of the process. In the context of this project, the latter customer refers to the recipient of the yield data.
The concept of this method is adopted throughout the whole project. Instead of a traditional SIPOC Diagram plotted completely at the beginning of the project, the suppliers and customers are identified during the yield data tracking. The data flow diagrams demonstrate the yield data transmission process via the current suppliers and customers. Apart from the "S", "C" and "P" contained in the same diagrams, the input and output of different formats of yield data are analyzed in the data comparison sections.
3.3. Business Process
Business Process is a term that embodies the related activities or responsibilities of producing products, which can be service, information or goods for customers. It is often represented as a workflow chart, which defines the specific roles, responsibilities, process standards, etc.
Kemsley provided a series of reasons why business process should be improved and how opportunities can be discovered [9]. It was a general introduction of the business process in all industries, but is brief and to the point. Aalst and Hee eloquently pointed out the disadvantages of traditional process structuring that not enough attention was paid to process structure within the framework of traditional systems making the business process difficult to recognize and conceived incorrectly or incompletely [10]. From the perspective of information technology, they systematically discussed about the workflow management from the organizational structure to specific business process development and re-engineering. A variety of methods explained can be applied to the pharmaceutical industry as well. For instance, the tier process introduced later in this thesis is one of the hierarchical organizational structures described in this book [10].
3.4. Data Flow Diagram
A data flow diagram is a chart to visualize the processing of data. There are
diversified sets of symbols, logic, and model organizations, which is elaborated in the paper by Li and Chen [11].
3.5.
Gap Analysis
Gap analysis is a concept describing the approach to the optimized allocation by comparing the current status and the desired status extensively used in business process development, business direction and information technology. Jeston and Nelis introduced the steps of implementing gap analysis in business process management [12] while Bolstorff and Rosenbaum described the application of gap analysis in supply chain management [13].
3.6.
DCS, P1, Data 3, SAP and JDE
Distributed Control System (DCS) is a system structure that allows the distributed controllers to control each component sub-system along the entire manufacturing system. The production processes at SJP Singapore are managed by DCS while DCS is constituted by network of sub-systems of Programmable Logic Controller (PLC). The data collected by DCS is stored in Plant Information (PI) System and ready for export [14].
Data 3 is used for material management at the south campus of SJP Singapore. All the production and transfer quantities are recorded in this system. Different from DCS, the data and material status in Data 3 is input manually. Moreover, the yield percentages are not documented in Data 3 as the quantities. At the west campus, SAP is the counterpart business management system of Data 3.
JDE is used as financial management software at the south campus to calculate yield
4.
METHODOLOGY
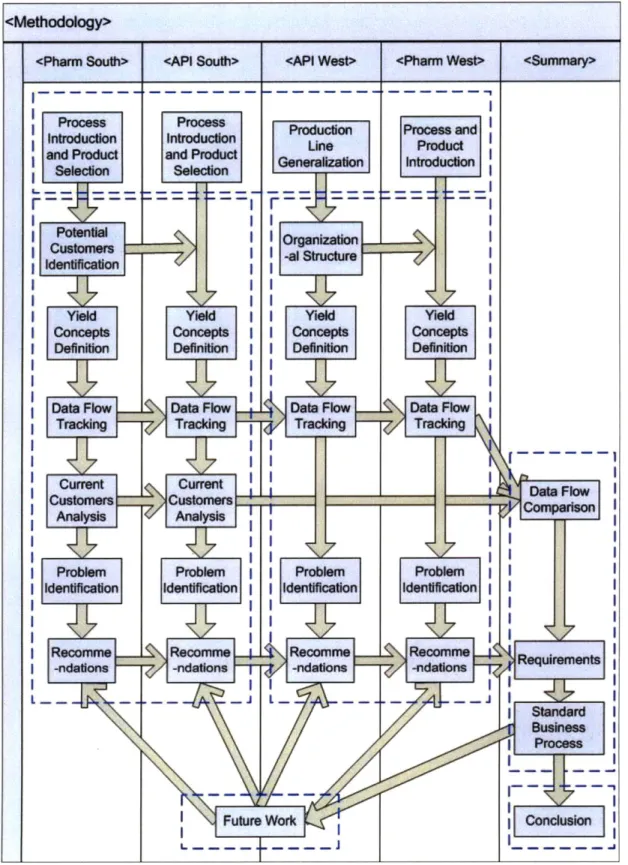
The methodology of DMAIC approach is adapted to the discovery nature of the business process development. The detailed steps of the investigation of the current yield data flow and the development of a standard business process is plotted in Figure 2. The dotted blocks demonstrate the distribution of contents in Chapter 5 to Chapter 10. As can be observed from the graph, the selection of representative production lines from each facility is discussed in Chapter 5, which is in the dotted block on top. The two dotted blocks below explain the detailed analysis of yield definitions and yield data flow at the two campuses respectively in Chapter 6 and Chapter 7. The upper right dotted block is the summary of the current status at the whole company by comparing the yield data flow and customers in each facility. The standard business process is established to satisfy the requirements derived from the analysis of the problems in all of the four facilities. These are the content in Chapter 8. Though this thesis is organized by different campuses, according to the definition of
DMAIC, the upper half of the study in each facility until data flow tracking belongs
to the "Define" and "Measure" phases, and the lower half and Chapter 8 all belong to the "Analyze" and "Improve" phases. The lower right is a conclusion of the whole project in Chapter 9. Finally the potential expansions of this business process and
Dat 1k
DCeMbwWI
Stadar Busnes
I Id;;
4.1.
Define and Measure
The visible problems have been defined in the problem statement; however, the root causes for these problems are to be discovered during the process of plotting diagrams of the current data flow. To collect the voice of customer (VOC) of this project, the SIPOC method is partially incorporated by identifying the suppliers and customers of the yield data. However, unlike most of the other problems, the customer identification cannot be completed before the measure phase because the actual suppliers and customers are unknown before the data is tracked through the related departments.
The measurement phase of this project is therefore beyond pure data. Since there is a variety of products being manufactured in this company at two campuses, several representative products should be selected for further analysis. Considering the strong resemblance between the manufacturing processes and data flow process of each product in the same facility at the south campus, it is a reasonable and practical strategy to choose one sample production line which is representative to include more potential problems during the yield data transmission from each facility and then generalize to all products in that facility. At the west campus, on one hand, no specific product is selected from the API facility because the API production lines can be generalized into a common one; on the other hand, the two products of the pharmaceutical facility are all studied because they involve completely different manufacturing processes thus yield calculation might be different.
After the products have been selected, to prepare for the data tracking, the tier process, which is the organizational structure at the south campus, is investigated to understand the structure of the workflow and the potential departments involved in the yield data processing. Similarly, the organizational structure of the west campus is also introduced although the tier process has not been fully established at this campus. As shown in Figure 2, the various concepts of yield are then clearly defined so that
the objects to track are clarified. The yield concepts at the west campus are defined referring to the south campus.
Subsequently, by interviewing the engineers from the potential customer departments and verifying the specific format of the yield data, the current yield data flow diagrams are plotted.
4.2.
Analyze and Improve
The current suppliers and customers, as well as the various purposes of using the yield data are identified and discussed after the data flow tracking. Moreover, by comparing the data and calculations acquired from different departments along the yield data flow chain, the root causes for data inconsistencies are investigated and discussed. During this process, the work redundancies and inefficiencies are also analyzed.
Targeting at the problems identified in each facility, potential solutions are proposed accordingly. These recommendations are also the requirements for the business process to be established to fill the gap between the current yield data flow and the desired yield data flow. Therefore, with a comparison of the current yield data flow in each facility and a summary of the requirements, a standard business process is established finally.
The potential expansion of this business process and the achievement of other opportunities would be the future work for this company.
5.
PRODUCTION LINE SELECTION
This chapter describes the selection of representative production lines to be considered in this research. The processes and products being manufactured at the south campus are introduced and compared, and a representative production line is therefore selected from each of the pharmaceutical and API facility in Section 5.1 and
5.2 respectively. In Section 5.3, a generalized production line of the API facility at the
west campus is described, followed by a supplementary introduction of pharmaceutical processes and product information obtained from the pharmaceutical facility at the west campus.
5.1.
Product "T" at Pharm South
Since there is a variety of pharmaceutical products being manufactured at the south campus, a representative production line, product "T", was selected for further analysis. To justify the selection, the pharmaceutical processes are introduced in Section 5.1.1 and the pharmaceutical products being manufactured at the south campus are introduced in Section 5.1.2. Finally, one typical product is selected by process comparison in Section 5.1.3.
5.1.1. Pharmaceutical Processes Introduction
1) Dispensing and Charging:
In this process, raw materials are pre-weighed manually in the dispensing booth and then fed into a container through a charge chute using a charge hopper.
This process is a type of wet granulation in which powder particles adhere to form larger granules by adding liquid solution. Generally speaking, granulation is carried out for better flow and compression characteristics. After the wet granulation process, the wet granules are pumped to a fluidized bed for drying and the solvent is removed.
3) Roller Compaction:
This process is also called dry granulation in which multi-particle entities agglomerate without a liquid solution being added. Specifically, at the south campus of SJP Singapore, the powder is squeezed between two cantilevered rolls to form a ribbon. Subsequently, the ribbon is broken up by passing through a series of other related equipment. Roller compaction is often used due to its simpler process and lower costs, or when the product to be granulated is sensitive to moisture.
4) Lubrication:
This step is used to prevent the granules from sticking to the equipment during tableting by adding lubricants such as Magnesium Stearate.
5) Direct Compression:
This is a type of tableting process that is simpler and cheaper than wet granulation and dry granulation. In this process, a mixture of dry powders is filled into a tablet hopper and directly compressed into tablets.
6) Milling:
Instead of increasing particle size in the granulation process, the milling process aims at reducing and homogenizing the particle size and normalizing the distribution of particle sizes as well.
7) Blending:
The purpose of this process is to mix the APIs with various excipients. It is a critical process to ensure the content uniformity of the dosage units and to reduce the variability in the manufacturing processes.
8) Tablet Compression:
In this process, the granules are placed into tablet dies and punched to form tablets. Different from the direct compression which presses the dry ingredient powders, tablet compression here refers to the compression of granules.
9) Film Coating:
This process is required to hide the unpleasant taste of the tablets, to make large tablets smoother to swallow, and to control the dissolution of drugs in the gastrointestinal tract. For instance, some medicines may be affected by the time it takes to reach the small intestine where they are absorbed.
5.1.2. In-line Product Introduction
There are three products being manufactured in the pharmaceutical facility at the south campus of SJP Singapore, denoted as product "V", product "T", and product "I".
Product "V" is a medicine containing the combination of two APIs, namely API "Eze" and API "S" [15]. According to the different ratios of the two APIs, one batch of final products can be divided into four strengths. Nevertheless, since the manufacturing processes of these four strengths are identical, this factor would not be differentiated during the analysis of yield data flow. Product "V" has been the highest-volume and most profitable product manufactured for many years and will
still be in line for approximately another four years given the patent expiration date in 2014 [16].
Product "T" is a drug for treating dyslipidemia and primary hypercholesterolaemia with a combination of two APIs, which are API "L" and API "N". These two ingredients are mixed together by the tableting process called "Bi-layer Compression". Comparing to product "V", product "T" is younger and will be in line for an even longer period of time.
Product "I" is a new product manufactured for only one year after its approval in 2007
by FDA [17]. It is a medicine containing the API "R" used for the treatment of HIV.
5.1.3. Product Selection by Process Comparison
A comparison of the processes involved in the production of each product is drawn in
Figure 3, and product "T" is selected as a typical production line for further analysis and data tracking. Not only because this production line is representative to cover more manufacturing processes thus more steps for yield calculation and to include more potential problems during the data flow, but also because product "T" is a younger product than the highest volume product "V".
Figure 3: Pharm South Process Flow Diagram Comparison
As can be observed from the three process flow diagrams in Figure 3, all the processes involved in the production of product "V" are necessary steps for product "T", denoted by blue arrows. Most of the processes involved in the production of product "I" are covered by the product "T" production as well, except for roller compaction and film coating, denoted by the green double arrow. Product "I" is currently the only product at the south campus with roller compaction involved in its manufacturing processes. As explained previously, the dry granulation is considered as a more advanced technology than the wet granulation and consequently will be the future trend for granulation. However, in spite of the quality advantages, this process
" i W 0 0 0 0 0 0 0 0 0 0 W ..0 4 . ............................
might not significantly differ from the wet granulation in terms of yield data flow. Besides, the calculation of yield at the film coating stage is similar to the blending stage in terms of the material flow, the film coating is not necessary to be taken into account. Hence tracking product "T" will represent the current procedure in the whole facility.
5.2.
API "Eto" at API South
There are mainly two API Products being manufactured at the south campus, API "Eto" and API "S". Given the characteristics of the production, the two intermediates of API "S" can be considered as independent production lines. Therefore, the selection of a typical production line should be justified. The API processes involved are described in Section 5.2.1 and the API products being manufactured at the south campus are introduced in Section 5.2.2. Finally, the processes involved in the production of each product are compared so as to select the representative API "Eto" in Section 5.2.3.
5.2.1. API Processes Introduction
1) Dissolution:
This is a process during which solid or liquid substances mix homogeneously in a solvent with the crystal lattice breaking down into individual molecules, ions, etc.
2) Informal Aging
The purpose of this process is to balance the cycle time like a buffer.
This is a method used to extract a substance from one liquid solvent to another based on relatively better solubility. The two solvents are immiscible liquids placed in one container.
4) Carbon Treatment:
This is a color reduction process that filters out the solid particles.
5) Distillation:
This is a unit process of separating substances based on different volatilities by boiling the liquid mixture.
6) Crystallization:
This process is to precipitate solid crystals from a solution.
7) Centrifugation:
It is a process to separate mixtures according to the densities by centrifugal force. Besides, it is also called as filtration.
8) Filter Drying:
This is a process with combination of filtration and drying completed in one container.
9) Drying:
This is simply to remove the moisture of the solvent, leaving the dry crystals in the container.
5.2.2. In-Line Product Introduction
In total two API products are being manufactured in the API facility at the south campus, which are API "Eto" and API "S". API "S" was mentioned in the introduction of product "V" as one of its ingredients. And API "Eto" is the ingredient of Product "A" for the treatment of chronic low back pain, acute pain, arthritis, gout, and ankylosing spondylitis.
Although there are only two products in this facility, there are four production lines involved in the manufacturing of them, of which two are for intermediates of API "S" and the other two are for final products.
5.2.3. Product Selection by Process Comparison
API "Eto" is selected for further analysis because the processes involved in its manufacturing not only represents the processes of most of the other products, but due to the semi-continuous characteristics, they also enables the application of DCS as well as the data transmission to PI system from where the yield data can be exported. Figure 4 is a comparison of the processes involved in the production of all the final products and intermediates. "EMSB" refers to API "Eto" Modified Salt Break, which is the complete manufacturing process for API "Eto", while "SC", "SP",
"SMF" are the abbreviations of API "S" "Crude", API "S" "Pure", and API "S"
"Milled Fine", respectively.
Although SMF is a final product, the process is not as typical as an API manufacturing process. It is more of a physical process because no chemical reaction takes place during this and the purpose of this step is just to reduce the particle size and blend the powders. To choose a production line that can represent more processes and to include more potential problems during the data flow, SMF is not desirable.
As can be observed from the parallel comparison, the SP process resembles the other two remaining processes, also without chemical reaction. It is a purification of the crude substances rather than an API manufacturing process. Hence SP is also a suboptimal choice.
Since the selection is simplified by the exclusion of two options, the comparison between EMSB and SC becomes rather obvious. The extraction, carbon treatment, and distillation processes evidently demonstrate that EMSB covers more possibilities for problem identification.
5.3.
Production Line Generalization at API West
The various processes involved in the manufacturing of API products at the west campus can be generalized into one production line due to the similarities, and the generalized diagram is plotted in Figure 5 as compared to the processes in the API facility at the south campus.
As can be observed from Figure 5, most of the processes at the west campus are the same as in the south campus, while the only additional process milling is a physical process that does not introduce more yield calculation problem. And since the yield data flow in this facility is not controlled by DCS, it is not differentiated by the product manufacturing process.
CIDwet
c~iD
Figure 5: API West Process Flow Diagram (Generalized)
5.4.
Product Introduction and Process Description at
Pharm West
Due to the completely different product characteristics and time limit, the biotech facility at the west campus is not considered here, thus the pharmaceutical facility
only refers to the tablet facility. There are two products being manufactured in this facility at the west campus, product "Z" and product "Na". They are different types of pharmaceutical product. Product "Z" is tablets containing only one API "E", which is the same as one of the ingredients of product "V" manufactured in the pharmaceutical facility at the south campus. Product "Na" is a prescription nasal allergy spray involving only one step of manufacturing process [18].
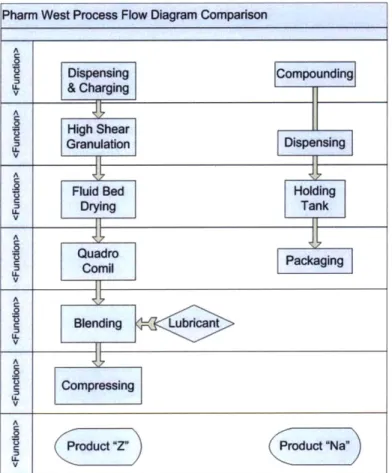
The various processes for both products are listed in Figure 6.
Figure 6: Pharm West Process Flow Diagram Comparison
As indicated by the diagram, these two products are totally not comparable. However, the processes involved in the production of Product "Z" are completely the same as the product "V" at the south campus, which are similar to the product "T". Therefore,
the analysis of the yield calculation of product "Z" will provide a comparison of the two campuses.
The only process for product "Na" requiring yield calculation is compounding, which basically means the mixture of all the ingredients in liquid. The involvement of yield calculation at this distinctive step will supplement the previous analysis toward pharmaceutical products at a relatively low cost of effort.
6.
CURRENT YIELD DATA FLOW ANALYSIS
AT THE SOUTH CAMPUS
In this chapter, the various manufacturing processes and the organizational structure of the current yield data processing at the south campus are given a detailed description. Section 6.1 introduces the tier process at the south campus and identifies the potential customers of the yield data. The various current yield concepts in the pharmaceutical facility at the south campus (pharm south) are listed and defined clearly in Section 6.2. Section 6.3 tracks the yield data of the selected product "T" through each single step and department and discusses the current customers and their responsibilities at pharm south. The problems with the yield data calculation and processing in this facility are identified in Section 6.4 while Section 6.5 proposes potential solutions to these problems. Similarly, the yield concepts in the API facility at the south campus (API south) are defined in Section 6.6. Section 6.7 tracks the yield data of the selected API "Eto" through the departments and analyzes the current customers. The problems in this facility are identified in Section 6.8 with the potential solutions provided in Section 6.9.
6.1.
Potential Customers Identification from Tier Process
Following the DMAIC Approach, the customers in this project are defined as whoever collects, calculates, proceeds, uses, or reports the yield data since all might benefit from this project by saving labor hours or adding value to the current activities. To track the data through the potential customers, the organizational structure at the
south campus is introduced in Section 6.1.1, followed by the potential customer identification in Section 6.1.2.
6.1.1. Tier Process
The tier process is both a cultural mind set and a set of standard methods to visualize the current problems, operational performance, and accountabilities, it also enables quick identification and resolution of root causes [19].
In this thesis, the tier process is considered more as a data review process than a human resources allocation. It describes the hierarchy of the information flow.
Tier Process at
the South Campus
I,
I -
-~~ I IPT Global Technical Quality operation ::ngineenng
3Leader
Operation Leader Leader LeaderOperation Process QA | Maintenance
Tier
Leads Leads Leads LeadsTechnicians Shift Contact/ Process Maintenance
Leads Engineers Staff
Figure 7: Tier Process at the South Campus
As shown in Figure 7, tier 1 is the base level of the tier process. The data is collected on a shift basis and can be considered as approximate real-time update. Currently at the south campus of SJP Singapore, this tier level consists of the technicians who operate the equipment, the shift leads who are in charge of shift operations, the contact engineers and process engineers who work directly on the manufacturing processes, and the maintenance staff who are responsible for mechanical issues. They review daily shop metrics and communicate issues and countermeasures. The data span of tier 1 is eight to twelve hours depending on the shift frequency.
Tier 2 is a level higher than tier 1 in the tier process. The data is obtained on a daily basis during normal office hours. At the south campus, tier 2 generally consists of the supervisors of the people in tier 1. As depicted in the diagram by the grey lines, technicians and shift leads report to the operation leads on the manufacturing operations; contact and process engineers report to the process leads on the process performance; maintenance staff report to the maintenance leads; and particularly, also involved in this daily level are quality assessment (QA) leads, who are in charge of a series of document review activities related to quality, such as batch sheet review, batch release, and annual product review (APR). The data span of tier 2 is twenty-four hours and the response actions are taken within the office hours roughly from
8:00 am to 4:00 pm.
Tier 3 is a level higher than tier 2 in the tier process. The data is reviewed weekly or daily as well but less frequently than tier 2. Instead of constantly being processed and monitored during the entire office hours, tier 3 data such as the trends in metrics are checked once in a day, at 10:30 am for instance. Similarly to tier 2, tier 3 consists of the supervisors of the people in tier 2. The operation leads report to the IPT Leader, who is managing the manufacturing of all the products. At the south campus, specifically, both the pharmaceutical facility and the API facility are currently under the supervision of the same IPT Leader. Accordingly, the process leads of both facilities report to the GTO Leader on the process performance and improvements; the QA leads report to the Quality Operation (QO) Leader on the quality related activities; and the maintenance leads report to the Engineering Leader on the maintenance progresses. The data span of tier 3 is one day or the past one week and the response time is usually longer than tier 2 since these leaders prioritize continuous improvement efforts and settle higher-level problems.
Except for the top level tier 5, which comprised of the monthly reviews by the plant manager, the highest tier level closely related to the data flow would be tier 4. It is undertaken by the same group of people as in tier 3; whereas, the data is tabulated and summarized into metrics both weekly and monthly depending on which department it
serves to. The response to the abnormalities found in this tier level would be investigated on a project basis.
6.1.2. Potential Customers
It can be assumed that all the departments except for the maintenance branch in the tier process are concerned about yield data, because yield percentage is an index to assess the performance of both the operation and the processes. In addition, two more departments closely related to the yield data processing are continuous improvement
(CI) engineers and Finance. CI engineers generate metrics of yield and other
parameters for the IPT Leader to charter improvements while Finance calculates the yield variance and the costs of not meeting the yield standards.
Theoretically, the capacity planning department should also be considered as a customer due to the impact of yield on production capacity. However, the yield deviation is too small in the pharmaceutical industry for the capacity planning to take into account. Hence the capacity planning can be assumed to be unaffected by the yield data flow.
6.2.
Yield Definitions at Pharm South
Yield is a parameter used to measure the performance and capacity of production in almost all industries. However, since it is defined in multiple ways even in the same pharmaceutical company between different facilities, it may cause confusion, miscommunication, and data inconsistency thus losing its effectiveness in demonstrating the real production performance. For instance, yield may refer to the absolute yield quantity in the unit of kilogram, tablet or mole; it may also refer to the fractional yield of the output to the input, or the actual output to the theoretical output. Furthermore, there are different ways of measuring it, such as release yield and