HAL Id: hal-01609114
https://hal.archives-ouvertes.fr/hal-01609114
Submitted on 24 Oct 2018
HAL is a multi-disciplinary open access
archive for the deposit and dissemination of
sci-entific research documents, whether they are
pub-lished or not. The documents may come from
teaching and research institutions in France or
abroad, or from public or private research centers.
L’archive ouverte pluridisciplinaire HAL, est
destinée au dépôt et à la diffusion de documents
scientifiques de niveau recherche, publiés ou non,
émanant des établissements d’enseignement et de
recherche français ou étrangers, des laboratoires
publics ou privés.
Catalytic transformation of carbon dioxide and methane
into syngas over ruthenium and platinum supported
hydroxyapatites
Bruna Rego de Vasconcelos, Lulu Zhao, Patrick Sharrock, Ange Nzihou, Doan
Pham Minh
To cite this version:
Bruna Rego de Vasconcelos, Lulu Zhao, Patrick Sharrock, Ange Nzihou, Doan Pham Minh.
Catalytic transformation of carbon dioxide and methane into syngas over ruthenium and
plat-inum supported hydroxyapatites.
Applied Surface Science, Elsevier, 2016, 390, pp.141-156.
Catalytic transformation of carbon dioxide and methane into syngas
over ruthenium and platinum supported hydroxyapatites
Bruna Rêgo De Vasconcelos, Lulu Zhao, Patrick Sharrock, Ange Nzihou, Doan Pham Minh
∗Université de Toulouse, Mines Albi, CNRS UMR 5302, Centre RAPSODEE, Albi, France
Keywords: Hydroxyapatite Ruthenium catalyst Platinum catalyst Methane Carbon dioxide Syngas
a b s t r a c t
This work focused on the catalytic transformation of methane (CH4) and carbon dioxide (CO2) into syngas
(mixture of CO and H2). Ruthenium- and platinum-based catalysts were prepared using hydroxyapatite
(HAP) as catalyst support. Different methods for metal deposition were used including incipient wetness impregnation (IWI), excess liquid phase impregnation (LIM), and cationic exchange (CEX). Metal particle size varied in large range from less than 1 nm to dozens nm. All catalysts were active at 400–700◦C but
only Pt catalyst prepared by IWI method (Pt/HAP IWI) was found stable. The catalytic performance of Pt/HAP IWI could be comparable with the literature data on noble metal-based catalysts, prepared on metal oxide supports. For the first time, water was experimentally quantified as a by-product of the reaction. This helped to correctly buckle the mass balance of the process.
1. Introduction
Synthesis gas, or syngas, is a gas mixture containing mainly carbon monoxide (CO) and hydrogen (H2). Commercialized firstly
in 1800s by the London Gas, Light, and Coke Company, syngas has nowadays several applications for illuminating cities, provid-ing heat and power, fuelprovid-ing vehicles through both direct use with gas engine, and conversion to liquid fuels, as well as for obtain-ing chemicals or intermediates by different chemical or biological transformation processes [1,2]. By catalytic way, syngas can be converted into other platform molecules or final products such as methanol, ethanol, aldehydes, waxes, diesel, olefins, gasoline, electricity, etc.[1,3].
Syngas can be obtained from the gasification of coal, wood, agri-cultural and forestry residues, and biomass-containing wastes[4]. Gasification process takes place at high temperature (up to about 1000◦C), using different atmospheres of vapor, carbon dioxide,
nitrogen, oxygen, or mixture of these components. Gas product of this process needs to be purified by suitable technologies as a function of its use[5].
∗ Corresponding author.
E-mail addresses:doan.phamminh@mines-albi.fr,doanhoa2000@yahoo.fr
(D. Pham Minh).
Syngas can also be obtained from the reforming of light hydro-carbons such as methane. Different oxidants can be used, in particular oxygen and carbon dioxide. Thus, catalytic partial oxi-dation of methane to syngas using molecular oxygen can be selectively carried out over highly dispersed nickel supported ceria (Ni/CeO2), according to Eq.(1) [6]. Both the conversion of methane
and the selectivity into CO reached more than 90% above 650◦C
for a mixture having the molar ratio of methane to oxygen equal to 2. Previously, Choudhary et al. showed that Co/MgO catalyzed selectively the oxidation of methane by molecular oxygen into syn-gas with 75% of methane conversion and 90–91% of CO and H2
selectivity at 700◦C[7].
CH4+ 1/2O2→ CO + 2H2!H◦298= −36 kJ mol−1 (1)
CH4+ CO2→ 2CO + 2H2!H◦298= 247 kJ mol−1 (2)
Using CO2as oxidant, methane can also be reformed into
syn-gas by catalytic way, according to Eq.(2). Nickel-based catalysts seemed to be the most appropriate for this reaction. Boukha et al. showed that an equimolar mixture of CH4 and CO2 was
quasi-totally converted at high temperature (650–800◦C) with high
selectivity into syngas over nickel supported on phosphate-based supports[8]. High performance of nickel supported on alumina and alumina-aluminum phosphate was also obtained at the tempera-ture range of 750–800◦C for this catalytic process[9]. Nickel-based
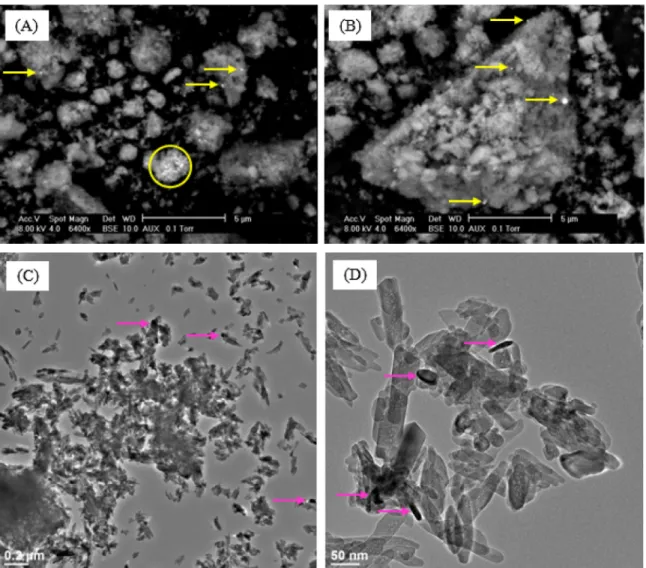
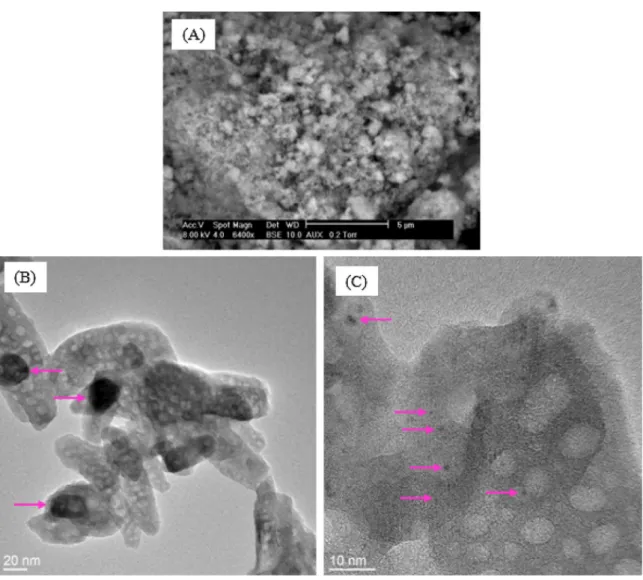
zeo-Fig. 1. SEM (A, B) and TEM (C, D, E) images of Ru/HAP IWI; yellow and pink arrows: Ru-based particles; yellow circle: Ru-based agglomerate. (For interpretation of the references to colour in this figure legend, the reader is referred to the web version of this article.)
lite, manganese oxide, silica, magnesium oxide, carbon nanotube, mixture of zirconia-silica oxides, hydrotalcite, Mo2C, etc. were
gen-erally found to be active for the conversion of CO2/CH4 mixture
at high temperatures, and with high selectivity in syngas product
[10–19]. Other active metals such as cobalt, copper, ruthenium, and rhodium were also studied in the reforming of methane by carbon dioxide, which showed high catalytic performances[20–22].
Syngas formation from catalytic conversion of a mixture of methane and carbon dioxide seems to be pertinent from point of view of the sustainable development concept. In fact, methane and carbon dioxide are the two main components of biogas and natural gas. This process offers new valorizations of biogas and natural gas including the transformation of carbon dioxide into useful prod-ucts. However, to the best of our knowledge, this catalytic process has not been developed at large industrial scale yet. This may be related to the fact that the reaction of methane with carbon diox-ide into syngas is highly endothermic (Eq.(2)). In fact, the C O bond energy in carbon dioxide molecule is 724 kJ mol−1 [23], so
the transformation of this molecule must be activated. High tem-perature, typically in the range of 650–950◦C, is needed for getting
high catalytic conversion of methane and carbon dioxide into syn-gas. This temperature range leads to high energy consumption, and also to the deactivation of catalyst. The deactivation is prin-cipally due to coke deposition from side reactions such as methane cracking, reverse water-gas-shift, as well as to the sintering of both active phase and catalyst support. For example, using TEM analysis, Tsyganok et al. highlighted coke deposition on the sur-face of a nickel-based catalyst[24]. This deposition could reach
up to 9.9 wt.%. Most of the larger nickel particles (15–35 nm) were encapsulated with graphitic layers. High energy consumption and catalytic deactivation appear as the main drawbacks of the dry reforming of methane for industrial scale-up.
This work is devoted to the synthesis of hydroxyapatite sup-ported ruthenium or platinum catalysts, and to the investigation of their catalytic performance in the transformation of methane and carbon dioxide into syngas. Ruthenium and platinum are well known as active phases in different catalytic reactions, in partic-ular for reforming processes. Hydroxyapatite is chosen as support material by its thermal stability, and also by its possible high spe-cific surface area, and its basicity properties[25]. The formation of ruthenium and platinum particles on HAP surface using different synthesis methods, and the reactivity of the prepared ruthenium and platinum catalysts are discussed. We have been also successful in the quantification of water formed during the dry reforming of methane process. To the best of our knowledge, the quantification of water has never been previously reported in the literature for this process. This allows establishing correctly the mass balance of the process since it was formed at a non-negligible amount in this reaction.
2. Materials and methods 2.1. Catalyst preparation
Hydroxyapatite powder was synthesized by the conventional precipitation method using orthophosphoric acid and calcium
Fig. 2. SEM (A, B) and TEM (C, D) images of Ru/HAP CEX; yellow and pink arrows: Ru-based particles; yellow circle: Ru-based agglomerate. (For interpretation of the references to colour in this figure legend, the reader is referred to the web version of this article.)
Table 1
Catalysts prepared in this work.
Catalyst Metal deposition Pre-treatment
Pt/HAP IWI Incipient wetness impregnation Air calcination at 400◦C
Pt/HAP LIM Liquid impregnation Drying only at 105◦C
Ru/HAP IWI Incipient wetness impregnation Air calcination at 400◦C
Ru/HAP CEX Cationic exchange Air calcination at 400◦C
hydroxide. Briefly, orthophosphoric acid (85 wt.% in water, p.a.) was progressively added to an aqueous suspension of calcium hydrox-ide. The final molar ratio of calcium to phosphorus was fixed at 1.67. The reaction mixture was kept at 80◦C for 2 h under stir-ring (500 rpm). Then, the precipitate of hydroxyapatite was filtered, rinsed with water and dried overnight at 105◦C. This powder was thereafter called HAP.
The deposition of ruthenium and platinum on HAP support was carried out by three methods using RuCl3 and K2PtCl4 as metal precursors (Aldrich, p.a. grade): Incipient wetness impreg-nation (IWI), cationic exchange (CEX), and excess liquid phase impregnation (LIM)[26]. IWI preparation was performed with both ruthenium and platinum (Table 1), because this method is simple and generally efficient for the deposition of well-dispersed metal particles for catalytic application. An aqueous solution of metal precursor was added drop-by-drop to HAP support in order to
wet perfectly the powder without excess of the liquid phase. The concentration of the metals was calculated to reach the desired metals contents in the final solids. The mixture was dried at room temperature until the complete elimination of water (checked by infra-red measurement). CEX method was used for the prepara-tion of ruthenium according to previous works, wherein ruthenium particle in the range of 3.0–5.5 nm were obtained [27,28]. HAP powder was added to a diluted aqueous solution of RuCl3 at
room temperature under stirring (500 rpm) for 4 h. Then the sus-pension was filtered using 0.45 !m filter-paper, and the solid was dried at room temperature up to the complete removal of residual water. LIM preparation was used for the deposition of platinum. This method was previously found as the most effi-cient for the dispersion of Pt on TiO2 support[26]. HAP support
was added into an aqueous solution of K2PtCl4 under stirring for
24 h at room temperature in order to insert platinum species on the surface of the support. Then, platinum precursor was reduced by formaldehyde in KOH medium. The solid was recovered by filtration and dried at room temperature up to the complete elim-ination of residual water. For IWI and CEX methods, dried solids were calcined at 400◦C under air atmosphere. For LIM method,
the dried catalyst was directly used for catalytic test, without further thermal treatment.Table 1summarized the prepared cat-alysts.
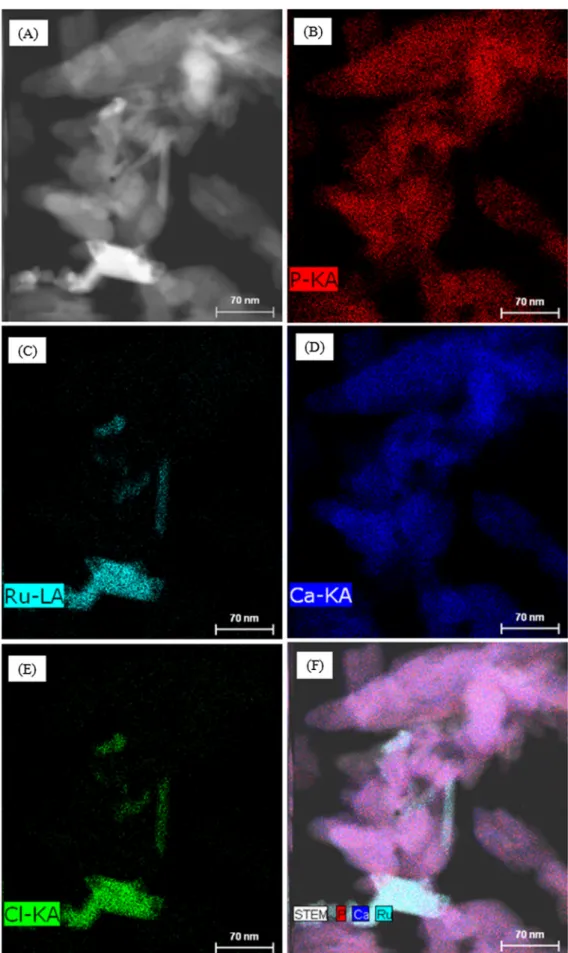
Fig. 3. Imaging of ruthenium, calcium, phosphorus, and chlorine present in Ru/HAP IWI; (A): TEM image with imaging analysis zone (green rectangle); B to E: imaging of phosphorus, ruthenium, calcium, and chlorine, respectively; (F): image treatment of phosphorus (blue), calcium (red) and ruthenium (sky-blue). (For interpretation of the references to color in this figure legend, the reader is referred to the web version of this article.).
2.2. Catalyst characterizations
Elemental analysis for the determination of metal loadings was carried out using ICP-AES method (HORIBA Jobin Yvon Ultima 2) after a mineralisation step. Specific surface area of solids was determined by BET method (Micrometrics Gemini Vacprep 061). Infra-red (FTIR) spectrum was recorded using a Shimadzu FTIR 8400S spectrometer. X-ray diffraction (XRD) was performed with a Phillips Panalytical X’pert Pro MPD diffractometer. The morpho-logical and textural surface of the solid products was observed by scanning electron microscope (SEM) using a Philips XL30 ESEM apparatus (FEI Company), and by transmission electron microscope (TEM) using a FEG JEOL JEM 2100F equipped with a HAADF detec-tor. This TEM apparatus is coupled with an EDS BRUKER which is equipped with a SDD detector (SDD of 127 eV resolution). Carbon content due to the deposition of carbonaceous species on the used catalyst was evaluated by CHNS analyzer (CE instruments, NA2100 series).
2.3. Catalytic test
The reaction of methane with carbon dioxide was carried out using either a U-sharp quartz reactor or a stainless steel fixed-bed reactor. Details of these reactors will be presented later. Catalytic test was carried out using gas mixture containing 20 vol.% of CH4,
20 vol.% of CO2and 60 vol.% of N2. The mixture of gas products from
the outlet of the reactor were analysed by a micro-chromatograph analyser (Agilent 3000 " GC) which allowed determining the vol-ume percentage of each gas in this mixture.
3. Results and discussion 3.1. Elemental analysis
ICP-AES was performed for the determination of Ru and Pt con-tents of the dried or calcined catalysts (Table 2). High deposition yields (79–90%) were observed for both the metals by different
Fig. 4. Imaging of ruthenium, calcium, phosphorus, and chlorine present in Ru/HAP CEX; (A): TEM image for mapping; B to E: mapping of phosphorus, ruthenium, calcium, and chlorine, respectively; (F): image treatment of phosphorus (red), calcium (blue) and ruthenium (sky-blue). (For interpretation of the references to color in this figure legend, the reader is referred to the web version of this article.).
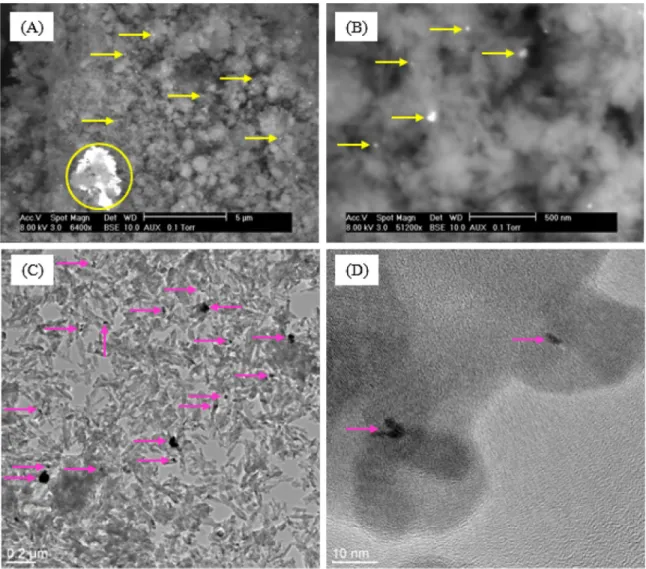
Fig. 5. SEM (A, B) and TEM (C, D) images of Pt/HAP LIM; yellow and pink arrows: Pt-based particles; yellow circle: Pt-based agglomerate. (For interpretation of the references to colour in this figure legend, the reader is referred to the web version of this article.)
Table 2
Ruthenium and platinum contents determined by ICP-AES analysis.
Catalyst Pt or Ru (wt.%), ICP-AES Pt or Ru (wt.%), theoretical value
Pt/HAP IWI 0.73 0.92
Pt/HAP LIM 0.80 0.92
Ru/HAP IWI 0.66 0.80
Ru/HAP CEX 0.72 0.80
Table 3
Specific surface area of the initial HAP support and of the calcined catalysts.
Catalyst SBET, m2g−1
Initial HAP support 60
Pt/HAP IWI 59
Pt/HAP LIM 60
Ru/HAP IWI 57
Ru/HAP CEX 56
deposition methods. The loss was probably due to the fixation of the metals on flask walls during the preparation.
3.2. Specific surface area (SBET)
Specific surface area measurement was performed with the ini-tial HAP support and the calcined catalysts (Table 3). HAP support
had the specific surface area of 60 m2g−1. As expected, the
deposi-tion of Ru and Pt (<1 wt.%) did not significantly modify its specific surface area.
3.3. SEM and TEM
Fig. 1presents SEM and TEM images of Ru/HAP IWI, or HAP sup-ported ruthenium catalyst which was prepared by IWI method and calcined at 400◦C. At micrometric scale (Fig. 1(A) and (B)),
individ-ual particles (yellow arrows) and agglomerates of these individindivid-ual particles (yellow circle) could be observed, thanks to the differ-ence of contrast between Ru-based compounds and the elements present in HAP support. At nanometric scale, Ru particles could be more easily observed. Their particle size varied from some nm to hundreds of nm (pink arrows,Fig. 1(D)). Ru particles did not have the expected spherical shape. On the other hand, irregular shape and rod shape were usually observed. Well-defined particles such as rod shape are generally formed by crystalline growth in solution with the presence of surfactant. In our case, no additional surfactant was used. So, understanding the formation of these well-defined Ru particles still needs scrutiny.
SEM and TEM images of Ru/HAP CEX are presented inFig. 2. The results were similar compared to those inFig. 1for Ru/HAP IWI, with the formation of both individual Ru particles and agglomer-ates of these individual particles (SEM images,Fig. 2(A) and (B)). At
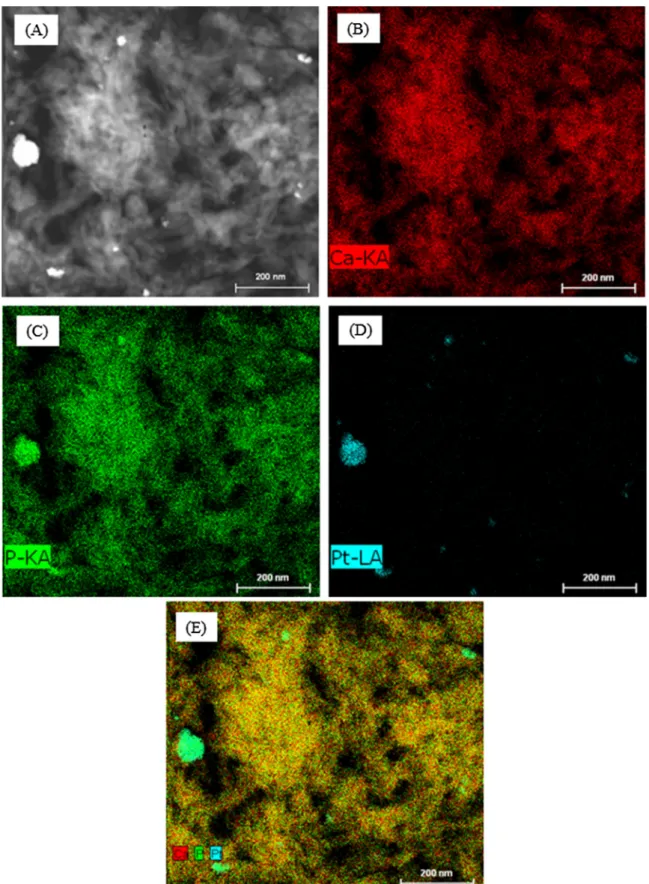
Fig. 6. Imaging of platinum, calcium, and phosphorus present in Pt/HAP LIM; (A): TEM image for mapping; B to D: mapping of calcium, phosphorus, and platinum, respectively; (E): image treatment of calcium (red), phosphorus (green) and platinum (turquoise). (For interpretation of the references to color in this figure legend, the reader is referred to the web version of this article.).
nanometric scale, Ru-based particles of irregular shape or rod shape were also observed. The formation of Ru-based particles indicates that crystallization or agglomeration of Ru-based compounds took place when HAP particles were set in contact with RuCl3solution,
and the expected cationic exchange between Ru3+and Ca2+did not
happen or only partially occurred.
In contact with chloride anions, hydroxyl groups of apatitic structure can be partially replaced by chloride anions to form
Fig. 7. SEM (A) and TEM (B, C) images of Pt/HAP IWI; pink arrows: Pt-based particles. (For interpretation of the references to color in this figure legend, the reader is referred to the web version of this article.)
chloroapatite: Ca10(PO4)6(OH2-xClx)2. To highlight the presence
of chloride on the surface of HAP particles, imaging of the main elements present in HAP supported Ru catalysts was performed.
Figs. 3shows the results obtained with Ru/HAP IWI. The formation of a Ru-based rod on the surface of HAP support could be clearly observed. Chlorine seemed to be mostly associated with ruthenium. This result suggests that anionic exchange between chloride (Cl−)
and hydroxyl (OH−) anions might also take place but the
sensibil-ity of the EDX analysis was not enough for the detection of chlorine resulting from this exchange. Further analysis such as secondary ion mass spectrometry (SIMS) may be useful to highlight this anionic exchange. Also, the calcination of the catalyst at 400◦C under air
atmosphere did not allow the complete removal of chlorine from the catalytic solids.
Fig. 4shows imaging of chemical elements present in Ru/HAP CEX. Rod and irregular Ru-based particles on the surface of HAP support could be observed. As observed previously for Ru/HAP IWI,Fig. 4highlighted also the association of chlorine with ruthe-nium. As communicated above, ionic exchange between ruthenium species and calcium species, and between chloride and hydroxyl groups seemed to not happen.
Fig. 5shows SEM and TEM images of Pt supported HAP cata-lyst, prepared by excess liquid phase impregnation (Pt/HAP LIM). Pt-based particles and agglomerates were observed either at micro-metric (Fig. 5(A)) or nanometric (Fig. 5(B), (C) and (D)) scale. The
size of Pt-based particles varied from some nm to hundreds of nm. Imaging analysis confirmed the presence of platinum particles at nanoscale (Fig. 6).
SEM and TEM images of Pt/HAP IWI are presented inFig. 7. In contrast with previous catalysts, Pt-based particles of this catalyst could not be visible by SEM analysis suggesting the absence of par-ticles or agglomerates at micrometric scale (Fig. 7(A)). At higher magnifications (Fig. 7(B) and (C)), TEM analysis highlighted the for-mation of Pt particles with particle size varying from less than 1 nm up to about 25 nm (pink arrows).
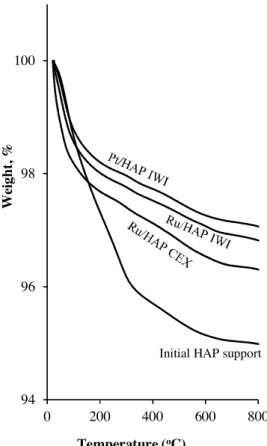
3.4. TG
The results of TG analysis of the initial HAP support, and the catalysts after calcinations are presented inFig. 8. HAP support had different weight losses in the temperature range investigated, which correspond to the removal of surface moisture (around 100◦C), to the dehydration of hydrogenophoshate groups, and
to the continuous dehydration of hydroxyl groups in the apatitic structure of HAP[29,30]. For Ru and Pt supported catalysts, the dehydration was less important up to 370◦C, because they were
already calcined at 400◦C. Above 370◦C, they had the similar
94
96
98
100
0
200
400
600
800
We
igh
t,
%
Temperature (
oC)
Initial HAP support
Fig. 8. TG analysis of the initial HAP support and different catalysts.
3.5. FTIR and XRD
FTIR spectra of the initial HAP support and the calcined catalysts can be found inFig. 9. Characteristic peaks of phosphate (1076, 1038, 960, 603, and 559 cm−1) and hydroxyl (633 cm−1) groups
were found for HAP support[31]. As expected, FTIR spectra of the calcined Ru and Pt catalysts did not have any significant difference compared to that of HAP support.
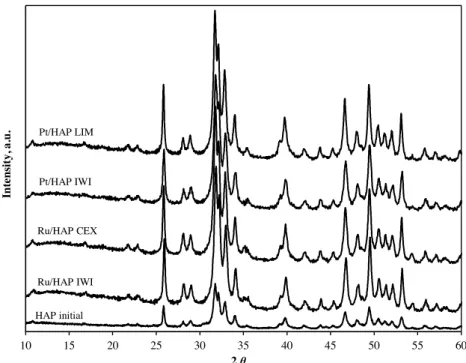
Fig. 10shows XRD patterns of the initial HAP support and the calcined catalysts. HAP showed low crystallinity, which is generally observed for hydroxyapatite synthesized at moderate temperature (80◦C). For the calcined Ru and Pt catalysts, the calcination at 400◦C
increased the crystallinity of HAP support. No crystalline phase of Ru- and Pt-based component was observed, because of their low contents in the prepared catalysts (<1 wt.%). According to the results of TEM-EDS analysis, either XRD or FTIR analyses did not reveal the presence of chloroapatite in the final prepared catalysts. 3.6. Comparative catalytic study
The first catalytic tests for comparing various catalysts prepared in this work were performed in a U-shape quartz reactor (Fig. 11). In the literature, the use of this reactor configuration is largely reported for bi-phasic gas-solid catalytic test. At laboratory scale, most work related to the transformation of methane and carbon dioxide into syngas was carried out with the U-shape quartz reac-tor[6,8,10,12,14–16,18,20,24,32]. For a given catalytic test, 500 mg of catalyst was introduced into the reactor. Then, it was heated by a vertical furnace to 400◦C at the rate of 20◦C min−1under N2
flux (70 N mL min−1). At this temperature, the reaction was started
by feeding the reactor with the mixture of gas reactants (20 vol.% of CH4, 20 vol.% of CO2 and 60 vol.% of N2) at the flow rate of
70 N mL min−1. The reaction was kept at this temperature for 1 h
and gas product of the reaction was analyzed by an Agilent 3000
0 10 15 20 25 30 35 40 45 50 55 60 In te nsit y, a. u. 2 θ HAP initial Ru/HAP IWI Ru/HAP CEX Pt/HAP IWI Pt/HAP LIM
Fig. 10. XRD patterns of the initial HAP support and the prepared Ru- and Pt-based catalysts.
Fig. 11. Illustration of the U-shape quartz reactor used in this study; Reactants: mixture of 20 vol.% of CH4, 20 vol.% of CO2and 60 vol.% of N2.
GC. Then, the reaction temperature was changed to 500◦C at the
heating rate of 20◦C min−1, and was kept at this temperature for
1 h, under the flux of reactants. Gas product of the reaction was also analyzed by !-GC. This procedure was repeated for 600 and 700◦C.
Catalytic tests using successively-increased temperature programs were already reported by Baktash et al.[33].
The initial HAP support had negligible catalytic activity under the reaction conditions used (result not showed). For Ru and Pt catalysts summarized inTable 1, the results obtained are shown in
Fig. 12for the evolution of the concentration of CH4and CO2. For all
four catalysts, the concentration of CH4was always slightly higher
than that of CO2, in the final gas product mixture. It may be due to
the reverse water-gas-shift reaction, where CO2reacts with H2to
form CO and H2O, as shown in Eq.(4) [19]. Ru catalysts were found
active within the temperature range investigated (400–700◦C). But
the deactivation seemed to be important. The reactivity of Ru/HAP IWI slowed down strongly within the first three hours of time-on-stream when the reaction was kept at 500–700◦C. For Ru/HAP CEX,
it partially lost its reactivity between 600 and 700◦C (decrease of
H2and CO production at 700◦C). This was probably due to the
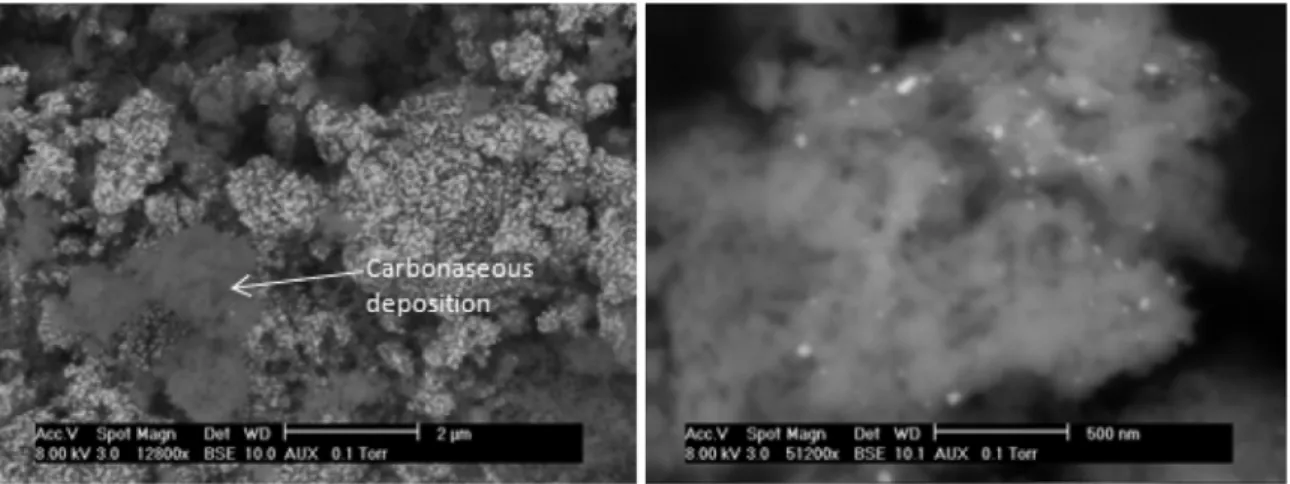
for-mation of carbonaceous deposits on the surface of the catalysts, as illustrated inFig. 13. Carbonaceous species covered the surface of Ru catalyst, leading to the reduction of available active sites and so causing the catalytic deactivation. This carbon deposition must be due to side reactions of the process, including the Boudouard reaction (Eq.(5)), and the methane cracking (Eq.(6)).
CH4+ CO2→ 2CO + 2H2!H◦298= 247 kJ mol−1 (3)
CO2+ H2→ CO + H2O!H◦298= 41 kJ mol−1 (4)
2CO → C + CO2!H◦298= −172 kJ mol−1 (5)
CH4→ C + 2H2!H◦298= 75 kJ mol−1 (6)
As expected, CO and H2 were found to be the main gas
prod-ucts of the reaction. No other peak was detected from the mixture of gas products of the reaction by !-GC analysis. In all cases, the concentration of CO was systematically higher than that of H2. As
explained above, the water-gas-shift reaction must happen (Eq.
(4)), taking into account the fact that the concentration of CO2was
0 5 10 15 20 25 400 500 600 700 CH 4 , ( vo l.%) Temperature (oC) Pt/HAP LIM Pt/HAP IWI-Cal Ru/HAP IWI-Cal Ru/HAP CEX-Cal
(A)
0 5 10 15 20 25 400 500 600 700 CO 2 , ( v ol .% ) Temperature (oC) Pt/HAP LIM Pt/HAP IWI Ru/HAP IWI Ru/HAP CEX(B)
0 5 10 15 20 25 400 500 600 700 CO , ( vo l.% ) Temperature (oC) Pt/HAP LIM Pt/HAP IWI-Cal Ru/HAP IWI-Cal Ru/HAP CEX-Cal(C)
0 5 10 15 20 25 400 500 600 700 H2 , ( vo l.%) Temperature (oC) Pt/HAP LIM Pt/HAP IWI-Cal Ru/HAP IWI-Cal Ru/HAP CEX-Cal(D)
Fig. 12. Evolution of the concentration of methane (A), carbon dioxide (B), carbon monoxide (C) and hydrogen (D) in the final reaction product over Ru and Pt supported catalysts at 400–700◦C and atmospheric pressure using U-shape quartz reactor; 500 mg of catalyst; inlet gas flow rate: 70 N mL min−1of 20%CO2-20%CH4-60%N2.
Fig. 14. Scheme of the stainless steel fixed-bed reactor. Reactants: mixture of 20 vol.% of CH4, 20 vol.% of CO2and 60 vol.% of N2; MCF: mass flow controller; limit pressure:
30 bar; internal diameter: 8 mm; total length of the reactor: 30 cm; homogeneous temperature zone: 8 cm at the center of the reactor.
Platinum catalysts were found active in this reaction. Pt/HAP IWI was much more active than Pt/HAP LIM. This seemed to be in coherence with SEM and TEM analyses. In fact, Pt particles present in Pt/HAP IWI (Fig. 7) were more dispersed than those present in Pt/HAP LIM (Fig. 5). This means that Pt is more available when pre-pared by IWI method compre-pared to LIM method. For Pt/HAP IWI, at 700◦C, the concentrations of CH4and CO2remaining in the gas
product mixture were around 6 and 9%, respectively, for the reac-tion time of 5 h at this temperature.
3.7. Isothermal test
The U-shape quartz reactor above has advantage to be simply designed and fabricated. However, powder catalyst cannot be really immobilized under gas stream. Consequently, when gas flow rates accidentally increase, catalyst bed becomes fluidized and can get out the reactor. The risk of preferential gas passage may also be present. Thus, a stainless steel fixed-bed reactor was designed and fabricated for isothermal catalytic test.Fig. 14shows the scheme of this reactor.
The same reactants mixture was used for the isothermal cat-alytic test. The catalyst bed was now fixed between two beds of inert alumina. The reaction temperature was controlled by a ther-mocouple, set at the center of the catalyst bed. At the outlet of the reactor, a gas counter was used for measuring the total gas flow rate. From this last one and the concentration of each gas, analyzed by !-GC, the molar flow rate of each gas at the outlet of the reactor
(Qi, mol h−1) could be obtained. The conversion and the selectivity
of the reaction were thus calculated as follows: XCH4, % = QE CH4− QCH4O QE CH4 × 100 (7) XCO2, % = QE CO2− QCO2O QE CO2 × 100 (8) SelCO, % = QO Oxygen QT Oxygen × 100 (9) SelH2, % = QO Hydrogen QT Hydrogen × 100 (10)
where: XCH4and XCO2: conversion of CH4and CO2, respectively;
QE
CH4and QCH4O : molar flow rate of CH4(mol h−1) at the inlet and
out-let of the reactor; QE
CO2and QCO2O : molar flow rate of CO2(mol h−1)
at the inlet and outlet of the reactor; SelCOand SelH2: selectivity of
the reaction in CO and H2, respectively; QOxygenE and QOxygenO : atomic
flow rate of oxygen (mol h−1) at the inlet (under CO2form) and
out-let (under CO form) of the reactor; QE
Hydrogenand QHydrogenO : atomic
flow rate of hydrogen (mol h−1) at the inlet (under CH4form) and
outlet (under H2form) of the reactor.
The major problem of this catalytic process is the deactivation due to carbon deposition. This deposition is favored by decreas-ing reaction temperature[34]. So, the isothermal catalytic test was carried out at 700◦C. Pt/HAP IWI was selected for this test because
0 5 10 15 20 25 0 5 10 15 20 25 30 35 40 45 50 Ou tle t c on cen tra tion (v ol . %) Time on stream (h) CH4 CO2 H2 CO (A) 0 10 20 30 40 50 60 70 80 90 100 0 5 10 15 20 25 30 35 40 45 50 C on ve rsi on (% ) Time on stream (h) CH4 CO2 (B) 0 10 20 30 40 50 60 70 80 90 100 0 5 10 15 20 25 30 35 40 45 50 Se lec tiv ity (% ) Time on stream (h) H2 CO H2O (C)
Fig. 15. Catalytic performance of Pt/HAP IWI at 700◦C; 500 mg of catalyst; inlet gas flow rate: 70 N mL min−1; (A): outlet gas composition; (B) conversion of CH4and CO2,
and (C): selectivity in H2and CO calculated from the total gas flow rate and the concentration of gas at the outlet of the reactor.
it appeared as the most performant catalyst fromFig. 12. The cat-alyst was heated under nitrogen (70 N mL min−1) up to 700◦C. At
this temperature, the reactor was fed with the mixture of reac-tants containing 20 vol.% of CH4, 20 vol.% of CO2and 60 vol.% of N2
(70 N mL min−1) for starting the catalytic test.
Fig. 15(A) simply reports the composition of gas at the outlet of the reactor obtained by !-GC. These results confirmed those obtained with the U-shape quartz reactor (Fig. 12for Pt/HAP IWI catalyst at 700◦C). The remaining concentration of CH4and CO2at
the outlet of the reactor was about 7–9 and 6–7% within the first hours of reaction, respectively. These correspond to the conver-sion of CH4and CO2close to 50 and 67%, respectively (Fig. 15(B)).
The catalyst reached the stability after only the first ten hours of time-on-stream. The initial deactivation could be attributed to the carbonaceous deposition, as shown by SEM analysis (Fig. 16). Crystallites of HAP support were slightly covered by amorphous carbonaceous species. But Pt particles, with high contrast, could be observed (yellow arrows,Fig. 16), signifying that they could still
be accessible for the catalytic reaction. This last one explains the stability of the catalyst after the first ten hours of time-on-stream. Along the reaction, the conversion of CO2was higher compared
to that of CH4. It has been usually reported in the literature, as
recently reviewed by Usman et al.[35], and could be explained by the reverse water-gas-shift reaction (Eq.(4)). This reaction is gener-ally favorable at the temperature range of 400–800◦C[31].Table 4
shows some results reported in the literature on the conversion of CH4and CO2at 700◦C and ambient pressure over noble
metal-based catalysts. Under the similar reaction conditions, the catalytic activity of platinum supported on HAP support (this work) could be compared with that of noble metal-based catalysts, prepared on other supports. According to TEM results inFig. 7, the catalytic per-formance of our Pt/HAP IWI can still be improved by limiting the formation of large Pt particles.
The selectivity reached around 87% into CO and around 70–80% into H2(Fig. 15(C)). This confirms the results obtained with the
Fig. 16. Example of SEM image of Pt/HAP IWI after 7 h of catalytic test.
700◦C). Previously, we supposed that side reactions took place, in
particular the water-gas-shift reaction (Eq.(4)).Fig. 15(C) enhances this hypothesis, wherein the selectivity in H2 was smaller than
the selectivity in CO, and the conversion of CO2 was higher than
that of CH4. Using a water trap at the outlet of reactor (Fig. 14),
which contains fine particles of silica-gel, water was well identified and quantified as by-product of the reaction. The increase of water selectivity with the decrease of hydrogen selectivity confirmed that water-gas-shift took place. Note that water analysis has never been reported for this process. The formation of water was discussed by
Pintar’s research team[10,40,41]but any details were given on how it has been done.
From the flow rate and the composition of the outlet gas mea-sured along the reaction, the matter balance for all the elements of the reaction could be established (Fig. 17). Hydrogen balance was done with water, hydrogen and methane. Oxygen balance was per-formed with water, carbon monoxide and carbon dioxide. Carbon balance was obtained with methane, carbon monoxide and car-bon dioxide. Note that coke deposition was not included into the carbon balance because it could not be correctly measured during
Table 4
Reactivity of noble metal-based catalysts at 700◦C and ambient pressure for the conversion of methane and carbon dioxide into syngas.
Metal and its content (wt.%)
Support Catalyst weight, mg
Inlet gas composition, vol.%
Inlet gas flow rate (N mL min−1)
CH4conv., % CO2conv., % Time-on-stream, h Refs.
1%Pd Al2O3 100 25%CH4, 25%CO2 diluted in He 4 ≈59 ≈52 3 [36] ≈44 ≈37 6 1%Pt MgO-Al2O3 50 33%CH4, 33%CO2 diluted in N2 x 81 72 6 [37] ZrO2-Al2O3 86 70 CeO2-Al2O3 90 78
1%Ru ZrO2-Al2O3 50 85
MgO-Al2O3 50 37 1%Pt La2O3 500 10%CH4, 10%CO2 diluted in Ar 83 ≈78 x x [38] Al2O3 ≈86 0.5%Rh La2O3 ≈90 Al2O3 ≈90 1%Pt ZrO2 100 50%CH4, 50%CO2 26 79 86 4 [39] 0.7%Pt HAP 500 20%CH4, 20%CO2 diluted in N2 70 30 40 50 This work 0 0.2 0.4 0.6 0.8 1 1.2 0 0.5 1 1.5 2 2.5 3 0 5 10 15 20 25 30 35 40 45 50 H ba la nc e H (mm ol/h) Time on stream (h) H inlet H outlet H balance
(A)
0 0.2 0.4 0.6 0.8 1 1.2 0 0.4 0.8 1.2 1.6 2 0 5 10 15 20 25 30 35 40 45 50 O ba lanc e O (mm ol/h) Time on stream (h) O inlet O outlet O balance(B)
0 0.2 0.4 0.6 0.8 1 1.2 0 0.4 0.8 1.2 1.6 2 0 5 10 15 20 25 30 35 40 45 50 C ba lan ce C (mm ol/h) Time on stream (h) C inlet C outlet C balance(C)
Fig. 17. Matter balance of the reaction.
the catalytic test. For a given element (A), the matter balance was calculated as follow:
Abalance = AAinlet
outlet
with A: C, O or H; Ainlet: flux of element A fed into the reactor
(mmol/h); Aoutlet: flux of element A quantified from the outlet gas
(mmol/h).
For both O and H, the matter balance was buckled with the values close to unit along the reaction time. So, if there are other by-products which have not been detected by the !-GC used, their concentration must be negligible. For C, despite the exclusion of car-bonaceous deposition, the carbon balance was relatively buckled, meaning that the main components of the outlet gas were carbon monoxide and unreacted methane and carbon dioxide.
4. Conclusions
Using hydroxyapatite (HAP) as support, Ru and Pt supported catalysts were prepared by different methods and were investi-gated in the catalytic transformation of CH4and CO2to syngas. For
both metals, catalysts prepared by incipient wetness impregnation (IWI) were found to be the most efficient. Ru-based catalysts were quickly deactivated in this reaction, because of coke deposition. On the other hand, Pt/HAP IWI catalysts were found to be active and stable for a long reaction time of 50 h of time-on-stream, under the reaction conditions used.
Water was experimentally identified and quantified as a by-product of the reaction. Further work would be focused on the continuous quantification of this water, which may help for iden-tifying the presence of side reactions. The influence of the basicity of HAP support, as well as the dispersion of active metal (Pt) on the catalytic performance will be also subject of future work.
Acknowledgments
The authors gratefully acknowledge colleagues at RAPSODEE Center for technical help.
References
[1]P.J. Coolcock, R.C. Brown, A review of cleaning technologies for biomass-derived syngas, Biomass Bioenergy 52 (2013) 54–84.
[2]D.K. Kundiyana, R.L. Huhnke, M.R. Wilkins, Syngas fermentation in a 100-L pilot scale fermentor: design and process considerations, J. Biosci. Bioeng. 109 (5) (2010) 492–498.
[3]Y. Richardson, J. Blin, A. Julbe, A short overview on purification and conditioning of syngas produced by biomass gasification: catalytic strategies, process intensification and new concepts, Prog. Energy Combust. Sci. 38 (2012) 765–781.
[4]Anis Atikah Ahmad, Norfadhila Abdullah Zawawi, Farizul Hafiz Kasim, Assessing the gasification performance of biomass: a review on biomass gasification process conditions, optimization and economic evaluation, Renew. Sustain. Energy Rev. 53 (2016) 1333–1347.
[5]Nourredine Abdoulmoumine, Sushil Adhikari, Avanti Kulkarni, Shyamsundar Chattanathan, A review on biomass gasification syngas cleanup, Appl. Energy 155 (2015) 294–307.
[6]T. Zhu, M. Flytzani-Stephanopoulos, Catalytic partial oxidation of methane to synthesis gas over Ni–CeO2, Appl. Catal. A: Gen. 208 (2001) 403–417.
[7]V.R. Choudhary, S.D. Sansare, A.S. Mamman, Low-temperature selective oxidation of methane to carbon monoxide and hydrogen over cobalt-MgO catalysts, Appl. Catal. A: Gen. 90 (1992) L1–L5.
[8]Z. Boukha, M. Kacimi, M.F.R. Pereira, J.L. Faria, J. Luis Figueiredo, M. Ziyad, Methane dry reforming on Ni loaded hydroxyapatite and fluoroapatite, Appl. Catal. A: Gen. 317 (2007) 299–309.
[9]L. Pelletier, D.D.S. Liu, Stable nickel catalysts with alumina-aluminum phosphate supports for partial oxidation and carbon dioxide reforming of methane, Appl. Catal. A: Gen. 317 (2007) 293–298.
[10]I.G.O. Awa, Tunable ceria–zirconia support for nickel–cobalt catalyst in the enhancement of methane dry reforming with carbon dioxide, Catal. Commun. 52 (2014) 10–15.
[11]N. Wang, X. Yu, Y. Wang, W. Chua, M. Liu, A comparison study on methane dry reforming with carbon dioxide over LaNiO3perovskite catalysts supported on mesoporous SBA-15, MCM-41 and silica carrier, Catal. Today 212 (2013) 98–107.
[12]P. Littlewood, X. Xie, M. Bernicke, A. Thomas, R. Schomäcker, Ni0.05Mn0.95O catalysts for the dry reforming of methane, Catal. Today 242 (2015) 111–118.
[13]H.P. Ren, Q.Q. Hao, W. Wang, Y.H. Song, J. Cheng, Z.W. Liu, Z.T. Liu, J. Lu, Z. Hao, High-performance Ni–SiO2for pressurized carbon dioxide reforming of methane, Int. J. Hydrogen Energy 39 (22) (2014) 11592–11605.
[14]R. Zanganeh, M. Rezaei, A. Zamaniyan, Preparation of nanocrystalline NiO–MgO solid solution powders as catalyst for methane reforming with carbon dioxide: effect of preparation conditions, Adv. Powder Technol. 25 (2014) 1111–1117.
[15]Q. Ma, D. Wang, M. Wu, T. Zhao, Y. Yoneyama, N. Tsubaki, Effect of catalytic site position: nickel nanocatalyst selectively loaded inside or outside carbon nanotubes for methane dry reforming, Fuel 108 (2013) 430–438.
[16]D. Liu, Y. Wang, D. Shi, X. Jia, X. Wang, A. Borgna, R. Lau, Y. Yang, Methane reforming with carbon dioxide over a Ni/ZiO2–SiO2catalyst: influence of pretreatment gas atmospheres, Int. J. Hydrogen Energy 37 (13) (2012) 10135–10144.
[17]A. Serrano-Lotina, L. Daza, Influence of the operating parameters over dry reforming of methane to syngas, Int. J. Hydrogen Energy 39 (2014) 4089–4094.
[18]A.R. González, Y.J.O. Asencios, E.M. Assaf, J.M. Assaf, Dry reforming of methane on Ni–Mg–Al nano-spheroid oxide catalysts prepared by the sol–gel method from hydrotalcite-like precursors, Appl. Surf. Sci. 280 (2013) 876–887.
[19]C. Shi, A. Zhang, X. Li, S. Zhang, A. Zhu, Y. Ma, C. Au, Ni-modified Mo2C catalysts for methane dry reforming, Appl. Catal. A: Gen. 431–432 (2012) 164–170.
[20]N. Rahemi, M. Haghighi, A.A. Babaluo, M.F. Jafari, S. Khorram, Non-thermal plasma assisted synthesis and physicochemical characterizations of Co and Cu doped Ni/Al2O3nanocatalysts used for dry reforming of methane, Int. J. Hydrogen Energy 38 (2013) 16048–16061.
[21]D. Homsi, S. Aouad, C. Gennequin, A. Aboukais, E. Abi-Aad, A highly reactive and stable Ru/Co6-xMgxAl2catalyst for hydrogen production via methane steam reforming, Int. J. Hydrogen Energy 39 (2014) 10101–10107.
[22]M. Ghelamallah, P. Granger, Impact of barium and lanthanum incorporation to supported Pt and Rh on "-Al2O3in the dry reforming of methane, Fuel 97 (2012) 269–276.
[23]S. Chandra, Comprehensive Inorganic Chemistry, New age International, Delhi, 2004, pp. 80–81.
[24]A.I. Tsyganok, K. Suzuki, S. Hamakawa, K. Takehira, T. Hayakawa, Mg–Al layered double hydroxide intercalated with [Ni(edta)]2-chelate as a precursor for an efficient catalyst of methane reforming with carbon dioxide, Catal. Lett. 77 (1-3) (2001) 75–86.
[25]D. Pham Minh, M. Galera Martinez, A. Nzihou, P. Sharrock, Thermal behavior of apatitic calcium phosphates synthesized from calcium carbonate and orthophosphoric acid or potassium dihydrogen orthophosphate, J. Therm. Anal. Calorim. 112 (2013) 1145–1155.
[26]D. Pham Minh, G. Aubert, P. Gallezot, M. Besson, Degradation of olive oil mill effluents by catalytic wet air oxidation: 2-oxidation of p-hydroxyphenylacetic and p-hydroxybenzoic acids over Pt and Ru supported catalysts, Appl. Catal. B: Environ. 73 (2007) 236–246.
[27]A. Peeters, L. Claes, I. Geukens, I. Stassen, D. de Vos, Alcohol amination with heterogeneous ruthenium hydroxyapatite catalysts, Appl. Catal. A: Gen. 469 (2014) 191–197.
[28]S. Akbayrak, P. Erdek, S. Özkar, Hydroxyapatite supported ruthenium(0) nanoparticles catalyst in hydrolytic dehydrogenation of ammonia borane: insight to the nanoparticles formation and hydrogen evolution kinetics, Appl. Catal. B: Environ. 142–143 (2013) 187–195.
[29]A. Lebugle, E. Zahidi, G. Bonel, Effect of structure and composition on the thermal decomposition of calcium phosphates (Ca/P = 1.33), React. Solids 2 (1986) 151–161.
[30]S. Lazic, S. Zec, N. Miljevic, S. Milonjic, The effect of temperature on the properties of hydroxyapatite precipitated from calcium hydroxide and phosphoric acid, Thermochim. Acta 374 (2001) 13–22.
[31]D. Pham Minh, N.D. Tran, A. Nzihou, P. Sharrock, Carbonate-containing apatite (CAP) synthesis under moderate conditions starting from calcium carbonate and orthophosphoric acid, Mater. Sci. Eng. C 33 (2013) 2971–2980.
[32]H. Sun, J. Huang, H. Wang, J. Zhang, CO2reforming of CH4over xerogel Ni-Ti and Ni-Ti-Al catalysts, Ind. Eng. Chem. Res. 46 (2007) 4444–4450.
[33]E. Baktash, P. Littlewood, R. Schomäcker, A. Thomas, P.C. Stair, Alumina coated nickel nanoparticles as a highly active catalyst for dry reforming of methane, Appl. Catal. B: Environ. 179 (2015) 122–127.
[34]D. Pakhare, J. Spivey, A review of dry (CO2) reforming of methane over noble metal catalysts, Chem. Soc. Rev. 43 (2014) 7813–7837.
[35]M. Usman, W.M.A.W. Daud, H.F. Abbas, Dry reforming of methane: influence of process parameters – a review, Renew. Sustain. Energy Rev. 45 (2015) 710–744.
[36]C. Shi, P. Zhang, Role of MgO over #-Al2O3-supported Pd catalysts for carbon dioxide reforming of methane, Appl. Catal. B: Environ. 170-171 (2015) 43–52.
[37]D.C. Carvalho, H.S.A. de Souza, J.M. Filho, A.C. Oliveira, A. Campos, E.R.C. Milet, F.F. de Sousa, E. Padron-Hernandez, A.C. Oliveira, A study on the modification of mesoporous mixed oxides supports for dry reforming of methane by Pt or Ru, Appl. Catal. A: Gen. 473 (2014) 132–145.
[38]M. Ghelamallah, P. Granger, Supported-induced effect on the catalytic properties of Rh and Pt-Rh particles deposited on La2O3and mixed "-Al2O3-La2O3in the dry reforming of methane, Appl. Catal. A: Gen. 485 (2014) 172–180.
[39]S. Ozkara-Aydinoglu, E. Ozensoy, A. Erhan Aksoylu, The effect of impregnation strategy on methane dry reforming activity of Ce promoted Pt/ZrO2, Int. J. Hydrogen Energy 34 (2009) 9711–9722.
[40]M.S. Aw, I.G.O. Crnivec, P. Djinovic, A. Pintar, Strategies to enhance dry reforming of methane: synthesis of ceria-zirconia/nickel–cobalt catalysts by freeze-drying and NO calcination, Int. J. Hydrogen Energy 39 (2014) 12636–12647.
[41]P. Djinovic, I.G.O. Crnivec, A. Pintar, Biogas to syngas conversion without carbonaceous deposits via the dry reforming reaction using transition metal catalysts, Catal. Today 253 (2015) 155–162.