Analytical Strategies for the Comprehensive Profiling of Histone Post Translational Modifications by Mass Spectrometry and
Implications for Functional Analyses
Par Paul Drogaris
Département de Chimie Faculté des Arts et des Sciences
Thèse présentée à la Faculté des Études Supérieures en vue de l’obtention du grade de
Philosophiæ Doctor (Ph.D.) en chimie
Novembre 2010
Université de Montréal Faculté des Études Supérieures
Cette thèse intitulée :
Analytical Strategies for the Comprehensive Profiling of Histone Post Translational Modifications by Mass Spectrometry and
Implications for Functional Analyses
Présentée par Paul Drogaris
A été évaluée par un jury composé des personnes suivantes:
Pierre Thibault ... Directeur de recherche Alain Verreault... Codirecteur de recherche Joëlle Pelletier...Président-rapporteur Jean-François Masson... Membre du jury Daniel Figeys ... Examinateur externe Pascal Chartrand ...Représentant du Doyen de la Faculté
Resumé
Le long bio-polymère d'ADN est condensé à l’intérieur du noyau des cellules eukaryotes à l'aide de petites protéines appelées histones. En plus de leurs fonctions condensatrices, ces histones sont également la cible de nombreuses modifications post-traductionnelles (MPT), particulièrement au niveau de leur section N-terminale. Ces modifications réversibles font partie d’un code d’histones épi-génétique transmissible qui orchestre et module dynamiquement certains événements impliquant la chromatine, tels l’activation et la désactivation de gènes ainsi que la duplication et la réparation d’ADN. Ces modifications sont impliquées subséquemment dans la signalisation et la progression de cancers, tels que la leucémie. En conséquence, l'élucidation des modifications d’histones est importante pour comprendre leurs fonctions biologiques.
Une méthodologie analytique a été mise au point en laboratoire pour isoler, détecter, et quantifier les MPT d’histones en utilisant une approche rapide à deux volets à l’aide d’outils bioinformatiques spécialisés. La méthodologie développée en laboratoire a été validée en utilisant des histones de souche sauvage ainsi que deux types d’histones mutants déficients en enzymes acétyltransferase. Des trois sources d’histones utilisées, la seule MPT qui a démontré un changement significatif est l’acétylation de l’histone H3 à lysine 56 (H3K56ac). L’expression et la stœchiométrie de cette MPT, issue de cellules de souche sauvage et de cellules mutantes, ont été déterminées avec précision et comparées.
Les fonctions de balayage polyvalentes d'un instrument à trappe ionique quadrupôle linéaire hybride ont été utilisées pour améliorer la détection de protéines intactes. Le mode de balayage « enhanced multiply charged » (EMC) a été modifié pour contenir et détecter les ions de protéines intactes situées dans la trappe ionique linéaire. Ce mode de balayage nommé « targeted EMC » (tEMC) a permis de quadrupler le niveau de sensibilité (signal/interférence), et quintupler la résolution du mode de balayage conventionnel. De plus, la capacité de séparation des charges du tEMC a réduit de façon significative les effets de « space charge » dans la trappe ionique linéaire. La résolution
supérieure du mode tEMC a permis de différencier plusieurs isoformes modifiées, particulièrement pour l’histone H3. L’analyse des peptides d’histones trypsiques à l’aide du mode de balayage « MRM » a permis le séquençage et la quantification de MPT avec un haut degré de précision. La seule MPT qui était sous-exprimée entre l’histone de souche sauvage et le mutant DOT1L fut la méthylation de l’histone H3 lysine 79 (H3K79me1).
Les effets de deux inhibiteurs d’enzymes HDAC (HDACi) sur l’expression de MPT d’histone ont été évalués en utilisant la méthodologie analytique mentionnée. Les histones extraites de cellules normales et cancéreuses ont été exposées à du Vorinostat (SAHA) ou du Entinostat (MS-275) pour une période de 24 à 72 heures. Deux histones furent principalement affectées, soit H3 et H4. Étonnamment, les mêmes effets n'ont pas été détectés lorsque les cellules normales ont été traitées avec le HDACi pour une période de 48 à 72 heures. Une méthode absolue de quantification avec une courbe d’étalonnage a été développée pour le peptide H3K56ac. Contrairement à certaines publications, nos résultats démontrent que cette MPT est présente dans les cellules mammifères avec une stœchiométrie très basse (< 0,1%) et n'est pas surexprimée de façon significative après le traitement au HDACi.
Mots Clés: Histones, modifications post-traductionnelles, spectrométrie de masse, nanoLC-MS/MS, trappe ionique linéaire, protéomique quantitative.
Summary
In eukaryotic cells, the lengthy DNA biopolymer is condensed into the cell nucleus with the aid of small packaging proteins called histones. In addition to their packing functions, histones are also targets of numerous post translational modifications (PTMs), especially on their N-terminus. These reversible modifications are believed to be constituents of a heritable epigenetic“histone code” that dynamically orchestrate and modulate chromatin-based events such as gene activation and silencing, DNA replication and repair, and are also involved in the downstream signaling and progression of cancers, such as leukemia. Thus, the elucidation of histone PTMs is important in understanding their biological function.
An analytical workflow was designed and set-up in the laboratory to isolate, detect, and quantitate histone PTM, using a two-pronged, unbiased, and rapid approach with specialized bioinformatic tools. The workflow was validated using histones from wild-type, and 2 mutants deficient in acetyltransferase activity. Between the three histone sources, the only PTM that demonstrated any change was acetylation at histone H3 lysine 56 (H3K56ac). The down-regulation and stoichiometry of this PTM was accurately assessed between wild-type and mutant cells.
The versatile scan functions of a hybrid quadrupole-linear ion trap instrument were exploited to enhance the detection of intact histone proteins. The enhanced multiply charged (EMC) scan was modified in order to contain and detect intact protein ions within the linear ion trap. This targeted EMC (or tEMC) resulted in not only a 4-fold increase in signal-to-noise, but also a 5-fold increase in resolution. Furthermore, the charge separation capability of the tEMC dramatically reduced space charge effects within the linear ion trap. The superior resolution of the tEMC mode allowed for the discimination of many modified histone isoforms, especially for histone H3. Using the bottom-up strategy with multiple reaction monitoring (MRM), histone peptides were quantified and sequenced with a high degree of precision. The only PTM that was
down-regulated between wild-type and DOT1L mutant histones was methylation at histone H3 lysine 79 (H3K79me1).
The effects of two clinically relevant small molecule HDAC inhibitors (HDACi) on histone PTMs patterns were assessed using the analytical workflow developed. Histones derived from both normal and cancer cells were exposed to either Vorinostat (SAHA) or Entinostat (MS-275) over a 24- to 72 hour period. The two core histones primarily affected were H3 and H4. Surprisingly, the same effects were not observed when normal cells were treated with three doses of SAHA at 24-hour intervals over a 72-hour period. An absolute quantitation method using a calibration curve was developed for H3K56ac. In opposition to other published litterature, our findings demonstrate that this PTM is present in very low stoichiometry (< 0.1%) in mammalian cells, and exhibits no significant up-regulation in different cell lines treated with several types of HDACi.
Keywords: Histones, post-translational modifications, mass spectrometry, nanoLC-MS/MS, linear ion trap, quantitative proteomics.
Table of contents
Resumé ... iii
Summary ...v
Table of contents ... vii
List of tables ... ix
List of figures...x
List of abreviations ... xii
Acknowledgements ... xvi
Chapter 1: Introduction ...1
1.1 DNA structure and properties ...2
1.2 Histones: the packaging proteins of DNA ...3
1.2.1 Higher order chromatin architecture...6
1.2.2 Histone modifications ...8
1.3 Epigenetics: going beyond the DNA sequence...11
1.3.1 Epigenetic drug therapy: a promising avenue for cancer treatment ...15
1.4 Protein analysis: the early years...17
1.5 Mass spectrometry: the driving force of proteomics ...18
1.5.1 The emergence of electrospray ionization ...19
1.5.2 Analytical LC-MS instrumentation for proteomics ...20
1.5.2.1 Sample introduction for mass spectrometry ...20
1.5.2.2 The ionization source...21
1.5.2.3 The mass analyzer...21
1.5.2.4 Tandem mass spectrometry...23
1.5.2.5 Peptide fragmentation by collision-induced dissociation ...24
1.5.2.6 Peptide fragmentation by electron transfer dissociation...26
1.5.2.7 The detection module...28
1.5.2.8 Database searching and processing of proteomics data...29
1.6 The analysis of histones by mass spectrometry ...30
1.7 Research objectives...32
1.8 Contents of the thesis...34
Chapter 2: Experimental Section ...47
2.1 Sample preparation for histones...48
2.2 Biological Models...49
2.3 Nanoscale HPLC...51
2.4 MS detection and sequencing ...52
2.4.1 Agilent TOF, Waters Q-TOF, and AB Sciex 4000 Q-trap for differential expression profiling and peptide sequencing (chapter three) ...52
2.4.2 AB Sciex 4000 Q-trap for targeted EMC and differential PTM profiling (chapter four) ...53
2.4.3 Agilent Q-TOF, Thermo LTQ-Orbitrap XL, and AB Sciex 4000 Q-trap for differential PTM expression and targeted MRM (chapter five) ...54
2.5 Bioinformatic tools and database searching ...55
2.5.1 Peptide map generation...55
2.5.2 Clustering analysis...56
2.5.3 Database searching...56
2.6 References...59
Chapter 3: Comprehensive profiling of histone modifications using a label-free approach and its applications in determining structure-functions relationships...60
Chapter 4: Enhanced protein detection using a trapping mode on a hybrid quadrupole linear ion trap (Q-trap) ...85
Chapter 5: Clinically relevant histone deacetylase inhibitors enhance histone H3 and H4 acetylation more readily in transformed cells than in normal cells...114
Chapter 6: Conclusion ...150
6.1 Conclusion and final thesis overview ...151
6.2 Future perspectives ...158
6.3 References...160
Appendix 1: Supplementary information and figures...162
List of tables
Table V-1 Stoichiometry and amounts of H3K56ac detected in transformed
cells exposed to different HDACi...143
Table A.1 Histone H3 volcano plot intensity data CTL vs. SAHA 6h Rx ...163
Table A.2 Histone H3 volcano plot intensity data CTL vs. SAHA 24h Rx ...164
Table A.3 Histone H3 volcano plot intensity data CTL vs. MS275 6h Rx ....165
Table A.4 Histone H3 volcano plot intensity data CTL vs. MS275 24h Rx ...166
Table A.5 Histone H4 volcano plot intensity data CTL vs. SAHA 6h Rx ...167
Table A.6 Histone H3 volcano plot intensity data CTL vs. SAHA 24h Rx ...168
Table A.7 Histone H4 volcano plot intensity data CTL vs. MS275 6h Rx ....169
Table A.8 Histone H4 volcano plot intensity data CTL vs. MS275 24h Rx ...170
Table A.9 Histone H3 Peptide MS/MS Identifications ...171
Table A.10 Histone H4 Peptide MS/MS Identifications ...172
Table A.11 Histone H3K56 peptide MRM transitions ...173
List of figures
Figure 1.1 The helical and chemical structure of DNA ...3
Figure 1.2 Histones packaging DNA into the cell nucleus ...4
Figure 1.3 The histone octameric complex ...5
Figure 1.4 Two models of chromatin structure ...7
Figure 1.5 A partial list of histone modifications...9
Figure 1.6 The classical epigenetic “landscape” ...11
Figure 1.7 Histone PTMs synchronizing different chromatin states...12
Figure 1.8 Effects of histone PTMs in leukemia...14
Figure 1.9 Epigenetic drug therapy ...17
Figure 1.10 Electrospray ionization ...20
Figure 1.11 Examples of mass analyzers used in proteomics ...22
Figure 1.12 Principle of the MRM scan mode ...24
Figure 1.13 Peptide fragment ion generation ...25
Figure 1.14 CID peptide fragmention mechanism ...26
Figure 1.15 ETD peptide fragmentation mechanism ...28
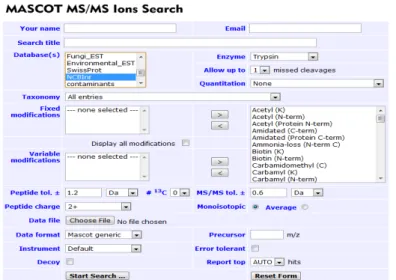
Figure 1.16 Mascot database search...29
Figure 2.1 Chemical derivatization of lysine residues ...49
Figure 2.2 Generation of peptide maps from LC-MS/MS raw data...55
Figure 2.3 Alignment of peptide clusters ...56
Figure 2.4 Flowchart of raw data processing using bioinformatic tools ...58
Figure 3.1 Overview of two-pronged strategy ...68
Figure 3.2 Intact histone profiling using nanoLC-MS ...70
Figure 3.3 Reproducibility tests ...73
Figure 3.4 Linearity and dynamic range assessments ...74
Figure 3.6 Scatter plots for diffential PTM expression...77
Figure 3.7 Histone peptide sequencing by tandem mass spectrometry...78
Figure 3.8 Histone PTM maps ...79
Figure 4.1 Overview of the targeted EMC ion trapping strategy ...95
Figure 4.2 MCS voltage optimization and conventional EMC ...97
Figure 4.3 Resolution enhancement using targeted EMC...99
Figure 4.4 Sensitivity enhancement using targeted EMC ...100
Figure 4.5 Space charge evaluation using targeted EMC ...102
Figure 4.6 NanoLC-MS of DT40 histones using different scan modes...104
Figure 4.7 Intact histone profiling using targeted EMC...107
Figure 4.8 Peptide quantitation and sequencing using MRM ...109
Figure 5.1 Cell cycle distribution and viability of K562 cells ...127
Figure 5.2 LC-MS analyses of intact histones derived from K562 cells ...130
Figure 5.3 LC-MS analyses of intact histones derived from normal diploid fibroblasts...131
Figure 5.4 Histone H3/H4 ion intensity profiling using volcano plots ...134
Figure 5.5 Western blot analysis of histone H4 treated with SAHA ...136
Figure 5.6 Identification and quantitation of H3K56ac from K562 cells using targeted MRM on an AB Sciex 4000 Q-Trap instrument...138
Figure 5.7 LC-MS/MS analysis of H3K56ac from K562 cells using an LTQ-Orbitrap XL mass spectrometer...140
Figure 5.8 Cross-reactivity of commercial H3K56ac antibodies ...142
Figure A.1 Total ion chromatogram from control K562 histone extract ...175
Figure A.2 HPLC fractionation of core histones from K562 cells...176
Figure A.3 Targeted MRM analyses of H4K91 propionylated peptides ...177
List of abreviations
1-D One dimensional
2-D Two dimensional
A Adenine ac Acetylation
ADP Adenosine diphosphate
ACN Acetonitrile
AGC Automatic gain control
amu Atomic mass unit
API Atmospheric pressure ionization
APL Acute promyelocytic leukemia
BCA Bicinchoninic acid
bp base pair(s)
BSA Bovine serum albumin
C Cytosine
C. albicans Candida albicans
CAD collision activated dissociation cal. conc. calculated concentration
CDK Cyclin-dependent kinase
CE capillary electrophoresis
CES Collision energy spread
CID collision induced dissociation
CML chronic myelogenous leukemia
CRM Charged residue model
CV Coefficient of variation
Cyt C Cytochrome C
Da Dalton
DC Direct current
DNA Deoxyribonucleic acid
DNMT DNA methyltransferase
E. coli Escherichia coli
ECD Electron capture dissociation
EMC Enhanced multiply charged scan
EMS Enhanced MS scan
EPI Enhanced product ion scan
ESI Electrospray ionization
ETD Electron transfer dissociation
FAIMS High field asymmetric waveform ion mobility spectrometry fg femtogram
FT-ICR Fourier transform ion cyclotron resonance FT-MS Fourier transform mass spectrometer
fwhm Full width at half maximum
G Guanine
GC Gas chromatography
h hour
HAT Histone acetyltransferase enzyme
HDAC Histone deacetylase enzyme
HDACi Histone deacetylase enzyme inhibitor HPLC High performance liquid chromatography
IDA Information dependant acquisition
IEM ion evaporation model
IT ion trap
kbp kilo base pairs
LC-MS Liquid chromatography interfaced with electrospray ionization mass spectrometry
LC-MS/MS Liquid chromatography interfaced with electrospray ionization and tandem mass spectrometry
LC Liquid chromatography
LE Leucine enkephalin
LIT Linear ion trap
M Concentration expressed in molar units
MALDI Matrix-assisted laser desorption ionization
MCS Multiply charged separation
MDS myelodysplastic syndrome me methylation me1 monomethylation me2 dimethylation me3 trimethylation μL volume in microliters
MIDAS MRM initiated data acquisition and sequencing
MRM Multiple reaction monitoring
MS Mass spectrometry
ms millisecond
MSD Mass selective detector
MS/MS Mass spectrometry/Mass spectrometry
(tandem mass spectrometry)
MW Molecular weight
m/z mass-to-charge ratio
NAD+ Nicotinamide adenine dinucleotide
NCP Nucleosome core particle
ng nanogram
PA propionic anhydride
pg picogram
PITC phenyl isothiocyanate
PTH phenylthiohydantoin PTMs Post translational modifications
Q0 Non-resolving quadrupole
Q1 First resolving quadrupole
QqLIT Quadrupole-linear ion trap mass spectrometer QqQ Triple quadrupole mass spectrometer
Q-TOF Quadrupole-time of flight mass spectrometer Q-TRAP Quadrupole-linear ion trap mass spectrometer
S. cerevisiae Saccharomyces cerevisiae
s second
SAHA Suberoylanilide hydroxamic acid
SDS-PAGE sodium dodecyl sulfate-polyacrylamide gel electrophoresis
SIDT single ion in droplet theory
SILAC stable isotope labeling by amino acids in cell culture stoichio. Stoichiometry
RF Radio frequency
rH3 Recombinant yeast histone H3
RIC Reconstructed ion chromatogram
ROS Reactive oxygen species
RP Reversed phase
RSD Relative standard deviation
SCX Strong cation exchange
T Thymine
tEMC Targeted enhanced multiply charged scan mode
TFA Trifluoroacetic acid
Th Thompson
TIC Total ion chromatogram
TOF Time-of-flight mass analyzer
UV Ultraviolet detection
WT Wild-type
Acknowledgements
A successful Ph.D. project is never the work of solely one person. There is a great number of other players involved, both actively and on the sidelines. I will take this opportunity to thank the many people who made this dream a reality.
My journey into the realm of mass spectrometry began in 1995, after registering for an undergraduate level course given by Dr. Robin Rye at Concordia University. It was during this semester when I realized how powerful mass spectrometry truly was. A few months later, I would land my first job as a bench chemist at Phoenix life sciences, and eagerly waited for my opportunity to get my hands on the various Sciex API III instruments present in the facility. I would have to wait patiently for another two years, and another company, before my chance would materialize. My first teacher and mentor was Roger Demers at Maxxam Analytics, who took me under his wings and taught me not only the basics on a Sciex API III instrument, but also method development for the bioanalysis of drugs and metabolites from biological matrices. For this opportunity and invaluable experience, I will be forever grateful.
My next break came in 2001 during the ASMS conference in Chicago. This is where I had the opportunity to meet Dr. Pierre Thibault. After keeping in contact for several years, we had met again one night in early 2005 at a local conference in Montreal. After learning that he had become a professor at the Université de Montréal and started his own lab, I jumped at the opportunity to join his group. A few months later, I was accepted in the chemistry program, and started my new academic journey. I would like to thank Pierre for giving me the chance to realize my research potential. Again, for the opportunity to pursue graduate studies in mass spectrometry, I will be forever grateful.
With Pierre opening the door to pursue graduate studies, my co-director Alain Verreault provided a constant supply of biological samples, which became a gold mine of information waiting to be discovered. I am thankful for not only his expertise, patience, and willingness to share his knowledge, but also for motivating me to probe and go
further. A special thanks to all the members in his lab, including Hugo Wurtele, Jason Tanny, Benoit Guillemette, Valérie Villeneuve, Neda Delgoshaie, and Eun-Hye Lee for not only being a great group of scientists, but wonderful people to work with. I can only wish that the people I get to work with in my future endeavors would be the same as in the Verreault lab.
I would like to thank all the past and present members of the Thibault lab. They have not only been great colleagues and friends, but also provided much needed support in times of discouragement. I will miss them all greatly.
I would like to thank my parents George and Georgia, my brother Costa, and my wife Véronic for their relentless support, love, and encouragement. I would have not been able to accomplish this journey without them.
A special thanks goes out to all my past and present teachers and training partners in various martial art disciplines, including coaches Tony Blauer and Phil Hughes, sensei Tetsuji Ishizuka, Joel Boucher, Marcel Lefebvre, Patrick Dubé, Marc-André Côté, senseis Claude Gagnon and Josette Lanteigne, and Guru Randall Goodwin, for helping to bring out and forge the warrior spirit of my Spartan heritage.
Finally, I would like to dedicate this Ph.D. thesis to the late Eleni Alevizatos (1917-2000), beloved mother and grandmother, who succumbed to the metastatic effects of liver cancer. If any of this research could one day contribute to the some type of cancer therapy, then it would have been worth the difficult Ph.D. journey I embarked upon.
“Shikin Haramitsu Daikomyo”
1.1 DNA structure and properties
The organizational and biological blueprint of an organism’s genetic information is contained in its DNA sequence. At the most basic structural level, DNA consists of a constant deoxyribose sugar moiety, and four variable and alternating nucleotide bases [1]: adenine (A), thymine (T), cytosine (C), and guanine (G), (see Figure 1.1). Antiparallel polynucleotide chains can form hydrogen bonds with each other, joining A-T and C-G base pairs (bp). X-ray diffraction studies using DNA fibers by Watson and Crick [2] enabled the elucidation of the DNA structure, and the formulation of the classical “B-form” model. According to their pioneering work, DNA is a repeating right-handed double helix, requiring 10 base residues to complete a full turn, with a precise 36 degree rotation angle between subsequent bp. The majority of DNA molecules adopt this B-form
in vivo, while being stabilized by “high water activity” and along a spine of hydration [3].
Biophysical studies have shed a great deal of insight about the hydration dynamics [4] and conformational stabilization [5] of B-DNA in solution using short synthetic oligomers. DNA can also adopt two other well-characterized conformations, notably the A- and Z-forms [6]; these depend on the chemical environment and DNA sequence. The A-form arises when DNA becomes dehydrated, resulting in a more compact double helix, with 11 bp per turn. The Z-confirmation can form in solutions of high ionic strength, with alternating CG-CG and CA-TG sequences [7], resulting in a left-handed helix. The classical model was amended primarily by the work of Dickerson and co-workers [8]. Using x-ray diffraction analysis of DNA dodecamer crystals, they concluded that the bp bond rotation had a slightly different range (28 to 42 degrees). Furthermore, the bp were not co-planar, but rather could rotate in opposite directions; this “propeller twisting” [9] enabled a high degree of bp stacking. One of the most important topological properties of DNA is its ability to be supercoiled [10, 11] and twisted periodically into multiple superhelices without physical damage, enabling the macromolecule to be highly compacted.
(a) (b)
Figure 1.1: The helical structure of DNA, with its four nucleotide base pairs (a). Chemical structure of DNA, with negatively charged phosphate groups (b). From references [12] and [13].
1.2 Histones: the packaging proteins of DNA
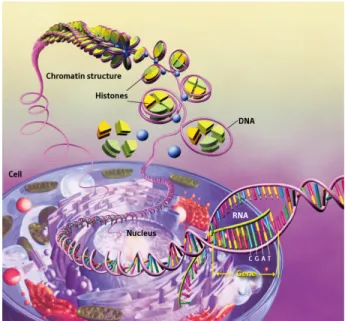
All essential proteins necessary for the biological functioning of an organism are encoded in its DNA sequence, forming a very long biopolymer that twists onto itself to generate a thermodynamically stable helical structure. Almost 3 billion bp make up the human genome [14] (6 billion bp per diploid cell), and the entire DNA sequence from a cell would easily span a linear distance of roughly two meters when annealed and unwrapped. This very lengthy sequence of nucleotides cannot occupy the limited size of the cell nucleus (about 10-5 m in diameter) without some form of packaging. As a result, nature has evolved an elegant solution to accommodate and package DNA in a highly ordered manner. The key proteins involved in this packaging process in eukaryotic organisms are called histones [15]. These proteins are relatively small (10 to 20 kDa), and highly basic; their entire amino acid sequence contains over 20% lysine and arginine residues. Together, DNA and histones form chromatin fibers (see Figure 1.2), which are the physiologically relevant substrate for important cellular activities such as DNA transcription, replication, and repair. At the first level of organization, 147 bp of DNA are wrapped in roughly 1 ¾ turn around an octamer of histone proteins, forming a
nucleosome, or nucleosome core particle (NCP). At first, DNA was believed to reside in “uniform supercoils”, however, the existence of NCPs was demonstrated by several groups including Clark [16], Hewish [17], and Noll [18] in chromatin digestion studies using micrococcal nuclease and DNase I. Unlike DNA strands, chromatin digestion was incomplete and did not form small oligonucleotides; this result led to the conclusion that the protein component was not evenly distributed along the DNA strands, suggesting the presence of a “subunit”. Although these experiments were simplistic in design, the same results and observations by different research groups were convincing enough and led to further investigation by emerging instrumental techniques such as electron microscopy and high resolution x-ray crystallography. Chromatin extracted from eukaryotic cells was found to be present in a linear array of repeating spheres (“beads on a string”) by Olins [19]; this further corroborated the coiling of DNA to form the NCP. Finally, Luger [20] and Davey [21] provided concrete evidence at the atomic level using crystallized human α-satellite DNA and recombinant histone proteins. Their studies showed that 147 bp of DNA underwent excessive curvature to coil around a histone protein core forming a superhelix, whose folding was dependant on electrostatic interactions between the histones and DNA.
Figure 1.2: Histone proteins aid in the packaging of DNA into the cell nucleus. From reference [22].
A closer inspection of the NCP reveals an octameric histone complex. The protein complex is made up of four different types of core histones, namely, H2A, H2B, H3, and H4 (see Figure 1.3). The association of the four core histones is also ordered and specific: two pairs of H2A and H2B molecules assemble into two H2A-H2B dimers, forming a tetramer, while H3 and H4 form an (H3-H4)2 tetramer [23, 24]. All four core histones
share common structural motifs, including a hydrophobic core, referred to as the histone-fold or globular domain, comprising three α-helices, and hydrophilic extremities, i.e., conformationally flexible N-termini or N-terminal “tails”, as well as short C-terminal ends. The histone-fold domain is primarily involved in maintaining structural integrity of the NCP, while the more basic histone tails, rich in lysine and arginine residues, protrude outside of the NCP structure. The core of the histone-fold domains from two different histones associate interfaces together in a head-to-tail fashion that results in inter-molecular, six α-helix bundles, forming a “handshake motif” by the two forms of heterodimers: H2A-H2B and H3-H4 [25]. Both the α-helices and the “paired-element motifs” of the helix/loop-and-strand/helix (HSH) structures contribute to form grooves in the histone-fold octamer [26], which serve as “docking pads” for DNA. Moreover, specific arginine residues [27] in the globular domain provide DNA anchoring points for negatively charged phosphate groups by electrostatic and hydrogen bonding.
Figure 1.3: Formation of the octameric complex by the four core histones. From reference [28]
As Arents points out [26], an important and well-conserved lysine-arginine pair for DNA interaction exists in the HSH2 loop between helix II and strand B. The core histones bind to the DNA backbone at precise locations [20], namely the L1L2 loops, and four α1α1 helices in the globular domain.
1.2.1 Higher order chromatin architecture
Repeating units of nucleosomes are compacted further into a helical coil of nucleosomes. This is achieved by additional structural components and chromatin associated proteins to form the “30 nm fiber” [29]. This constitutes the secondary level of DNA-histone organization. Chromatin fibers are stabilized and maintained in a higher order structure by another type of histone, referred to as linker histone H1 [30]. In mammals, there are six different types of histone H1 variants (H1.0 to H1.5), each possessing different biological properties, and named according to their chromatographic behavior [31]. Histone H1 is structurally and functionally different from the four core histones comprising the nucleosome. Compared to the histones present in the NCP, histone H1 is longer and heavier (about 23 kDa), with three distinct structural domains [32]. These are characterized by an 80 residue long globular domain, attached to a short N-terminal and a long C-terminal extension, both of which are highly basic [33].
The globular domain of H1 also contains two surfaces lined with positively charged amino acids that provide two additional DNA binding regions in NCPs. A short sequence of DNA resides outside of the nucleosome, and varies in length depending on species and tissue. This linker DNA provides contact points for the N- and C-terminal extensions of histone H1. Linker histone H1 helps to stabilize and maintain the higher ordered chromatin fiber by neutralizing the negative electrostatic charges on the DNA molecule, and also by interacting with NCPs. Biophysical studies have shown that although linker histone H1 helps maintain chromatin stability, it is not totally essential. For example, Carruthers and colleagues [34] have shown that nucleosomal arrays from histone octamers depleted of histone H1 and twelve 208 bp tandem repeats of Lytechinus 5S rDNA were able to fold in salt solutions of varying concentrations. Although unstable
in solution, the arrays showed a high degree of folding. The extensive basic N- and C- terminal extensions of linker histone H1 provide the driving force to stabilize and maintain the higher order chromatin structure. Tertiary structure formation involves further packaging of chromatin into thick and condensed fibers. Two models (shown in Figure 1.4) have been proposed to describe this higher order architecture: the solenoid and “zig-zag” models [35]. Due to its highly compacted nature, the spatial arrangement and localization of individual nucleosomes within the 30 nm fiber is not resolvable. Although it is very difficult to determine with absolute certainty which model holds true
in vivo, experimental evidence points to the “zig-zag” model as being the most plausible
one [36-38]. In this model, nucleosomes become “interacting partners”, imparting more stabilization.
Figure 1.4: Two models of chromatin structures, i.e., the solenoid (left) and “zig-zag” models. From reference [39].
Further folding of the chromatin fiber into a metaphase chromosome necessitates the formation of radial and helical loops of 50 to 100 kbp. Construction of this highly organized chromosomal configuration is aided by the support of a nuclear “matrix” or “scaffold” [6]. One of the major components of this scaffolding is topoisomerase II (topo II). A study conducted by Takeyasu demonstrated that topo II was an integral component necessary for the condensation of mitotic chromosomes and had the ability to join two DNA strands together. Moreover, this process required histone H1-bound chromatin for
the formation of higher order structures in an ATP-independent manner [40]. Other chromatin-associated proteins are involved in this higher order packing [41]; these include MeCP2, which binds to methylated DNA and stabilizes loops, MENT, a serpin family protein that aids in oligomerization, and Polycomb, a large protein complex involved in gene silencing and can also attach to nucleosomes. In addition, inner nuclear membrane proteins such as the lamins [42] provide binding sites for chromatin within the cell nucleus. All of these structural components work together in concert to ultimately achieve the final packaged state of the chromosome.
1.2.2 Histone modifications
The preceding sections have described histone proteins solely as packaging agents of chromatin, resulting in nucleosomes with a rather rigid globular domain, and flexible N-terminal tails. Histones have a number of amino acids, including basic lysine and arginine residues, spread over the length of both the globular domain and the flexible N-terminal tails that can be covalently modified. These post-translational modifications (PTMs) of histones have been known for many years; for example, acetylation was first reported in 1963 by Phillips in histones isolated from calf thymus extracts [43]. To date, there are over 60 PTM sites on histones that have been identified by techniques such as Edman sequencing and mass spectrometry [44]; this list continues to grow as research intensifies. The most common and well-characterized histone PTMs include acetylation, methylation, and phosphorylation. Some of these PTMs are shown in Figure 1.5. A great number of lysine residues can be modified by acetylation and methylation (in mono-, di-, and trimethyl forms). Arginine residues can be methylated (mono- and dimethyl forms), while serine and threonine can be phosphorylated. Other less commonly observed PTMs include conjugation of histone lysine residues to small proteins such as Ubiquitin and Sumo, as well as ADP-ribosylation of histone arginine, aspartic and glutamic acid side chains. The majority of these PTMs occur on the N- and C-terminal tails of histones, yet a small number of important modifications have also been detected in the globular domain, e.g. histone H3 lysine 79 methylation. The multitude of these PTMs leads to an ever increasing complexity and combinatorial “explosion” of possibilities.
The fact that histone proteins show a high degree of sequence conservation between different species, and their modifications often have similar functions in various biological systems suggests that these PTMs are important and possess evolutionarily conserved roles in cell biology. The modification of histones is dictated by both internal and external cellular stimuli, and ultimately leads to changes in the structure and function of chromatin, mediating important biological processes such as gene transcription, DNA replication, and damage repair [45]. These alterations in chromatin can be achieved by three known mechanisms: (a) disrupting DNA-histone electrostatic interactions (“cis” effects), and (b) recruitment of enzymes and chromatin remodeling complexes (“trans” effects), and (c) replacement of canonical histones by histone variants, e.g., H3.1 by replacement H3.3, and H2A by H2A.Z.
Figure 1.5: A partial list of known histone PTMs that occur on the N-terminal tails and globular domains of the core histones. From reference [46].
One of the best known and most studied cis-effects of chromatin remodeling is the acetylation of lysine residues on core histones. The incorporation of an acetyl group removes the positive charge on the lysine side chain, thus negating the electrostatic contact with the DNA backbone. This PTM favours the unraveling of a specific region of chromatin, making DNA more accessible, and allowing gene transcription to proceed. In the yeast S. cerevisiae, lysine 14 on the H3 N-terminal tail can be acetylated by the
enzyme Gcn5, which activates gene transcription [47]. As demonstrated by Cairns [48], H3K14ac is an active mark for transcription recognized by the bromo domain of the RSC complex, an ATP-dependent nucleosome remodelling enzyme that promotes gene activation by disrupting histone-DNA interactions. Thus, histone modifications can also serve as a “docking site” for larger enzyme complexes and remodeling machinery. These
trans-effect chromatin marks direct the engagement of other binding proteins, which can
signal downstream cellular processes. Another example of such a trans (but opposing) effect is the methylation of lysine 9 on histone H3 [49]. This modification can be generated by the Suv39h methyltransferase, providing an anchoring point for the chromo domain heterochromatin binding protein 1 (HP1). Once bound to chromatin that contains K9-methylated H3 molecules, HP1 can mediate the formation of heterochromatic regions, forcing DNA to be inaccessible, and promoting gene silencing. The third mechanism involves the substitution of core histones by sequence variants in nucleosomes. These histone variants are utilized to establish chromatin states with specialized functions. In mammalian cells, one such histone variant is H3.3, which resembles the canonical H3 histone, but differs only in four amino acid residues.
In the fruit fly D. melanogaster and human cells, this H3 variant can be deposited into chromatin in a replication-independent manner, and directed into sites of transcriptionally active genes [50]. These small differences in amino acids are crucial for the deposition of H3.3 into specific regions, and its function after incorporation into chromatin [51]. One of these differences is at position 31; in H3.1, this residue is an alanine, while in H3.3, the alanine is replaced by a serine or threonine. Unlike the alanine residue in the canonical histone H3, serine and threonine can be phosphorylated, triggering important downstream cellular events. Allis and colleagues [52] have demonstrated that Ser-31 phosphorylation occurs only in metaphase, and is localized in specific areas adjoining centromeres. Suggested functions for this residue difference and PTM include protection of euchromatin, and substitution of H3.3 by the canonical H3.
1.3 Epigenetics: Going beyond the DNA sequence
A recent study performed by Fraga [53] examined phenotypic differences in monozygous (MZ) twins. Although genetically identical at birth, these MZ twins developed significant differences over time, e.g., risk of disease progression. This begs the following question: what mechanism(s) is responsible for these alterations over time? One major finding in the study was that older twins showed drastic changes in their DNA methylation and histone acetylation profiles. Hence, the answer could lie beyond the genetic information encoded in the DNA sequence. The regulation of phenotypes by non-DNA related mechanisms brings us to the concept of epigenetics. The idea that phenotypic changes can be caused by non-genotypic changes is not entirely new. Originally coined by Conrad Waddington in 1942 (see Figure 1.6), epigenetics was the term used to “describe events that could not be explained by genetic principles” [54]. A more recent definition by Allis would describe epigenetics as the collection of modifications to chromatin producing different states of gene expression from the same genome [46]. In multicellular organisms, most cells have the same genotype, yet become differentiated and organized to fulfill many distinct roles.
Figure 1.6: The classical epigenetic “landscape” by Waddington. In this figure, a cell is represented by a ball at the top of the hill. A number of slopes are present, representing a limited number of pathways that the cell can take, leading to different cellular fates. From reference [54]
There are two main epigenetic mechanisms in mammalian cells: (1) DNA methylation and (2) histone modifications [55]. The vast majority of DNA methylation occurs on cytosine residues in 5’-CpG-3’ dinucleotides. In regions where CpG dinucleotides occur frequently (known as CpG “islands”), methylation of cytosine is a mark of gene silencing [56].
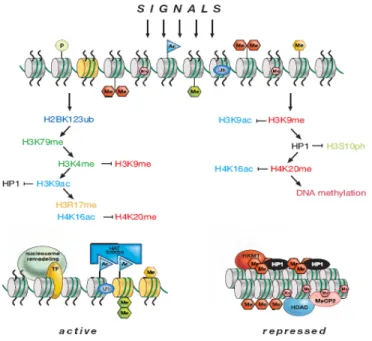
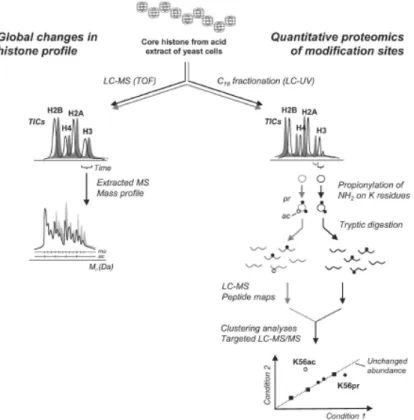
The second mechanism is the modification of specific amino acid residues of histone proteins. As described the previous section, the diverse types of histone PTM can modulate when and how genes are expressed, using chromatin as a template for synchronizing cellular events. These modifications usually do not occur as single events on chromatin, but rather in combination with each other at precise residues and defined times within the cell cycle, causing spatio-temporal changes in chromatin structure that lead to gene transcription or repression. An example of histone PTMs working in concert to modulate chromatin remodelling is shown in Figure 1.7.
Figure 1.7: Histone PTMs are a series of synchronized events working synergistically or antagonistically to generate active (left) or repressed (right) chromatin states. From reference [46].
The combinatorial nature and phenotypic changes of these modifications lead to the formulation of the “histone code” hypothesis by Allis, Strahl and Jenuwein [57, 58]. According to them, these PTMs form an “epigenetic language” that is reversible and heritable, without necessitating changes in the DNA sequence. The multiple sites of modification present on the small segments of the N-terminal tails makes them “hotspots” for enzymatic activity. Addition of a modification on a specific residue of an N-terminal tail can affect the binding and the catalytic rate of another enzyme, either inductively or antagonistically. Some research groups have provided evidence that supports the existence of this histone code by modification “switches”. For example, Lo and colleagues have shown that H3 serine-10 phosphorylation up-regulates the acetylation of H3 lys-14 by several HATs, including Gcn5, PCAF, and p300 [59]. This modification sequence is linked to transcriptional activation.
Epigenetics can be viewed as a double edged sword. On one hand, epigenetic mechanisms are involved in regulating important DNA metabolic processes such as gene transcription and DNA repair, which help maintain a high degree of genomic integrity and stability [60]. This regulation is maintained by a multitude of “feedback mechanisms”, and interplay between different enzymes, such as DNA methyltransferases and chromatin modifying complexes. However, epigenetic mechanisms are often disrupted in diseases such as cancer. Essentially, cancer is genetic disease in which gene expression has become abnormal and cellular homeostasis is unbalanced. Some common attributes of different types of cancers include unregulated cell proliferation, point mutations, loss or silencing of genes, tumor growth, invasion, and metastasis [61]. However, the molecular complexity of this disease is further expanded by dysfunctional epigenetic regulation, such as defects in DNA cytosine methylation and histone modifications.
Both genetic and epigenetic factors can work in tandem to interfere with normal cellular activity, producing two types of aberrations in gene expression that contribute to cancer: (1) induction of oncogenes, and (2) silencing of tumor suppressor genes [46]. One example is the oncogenic activation of the ras gene [62]. This occurs by a genetic point
mutations that cause single amino acid substitutions in the Ras protein, and high spontaneous mutation rates, especially in pancreatic cancers [63]. The presence of the positive K-ras mutation in patients with lung adenocarcinomas is associated with poor prognosis and low survival rates. The second mechanism by which cancer may be induced is by epigenetic repression of genes that are important to regulate and maintain healthy cellular functions. One key epigenetic mechanism involved in tumorigenesis is CpG island promoter hypermethylation [64]. In bladder cancers, the CDK inhibitor and tumor suppressor p16INK4a becomes silenced by extended hypermethylation of the DNA region encoding the gene [65]. This allows malignant cells to bypass senescence and proliferate without constraint. Histone modifications can also contribute to abnormal gene silencing during carcinogenesis. Baylin and colleagues demonstrated that, in cancer cells, the silenced promoter of tumor suppressor gene hMLH1 resides in an area whereby histones are de-acetylated and subsequently methylated at H3K9 [66]. In mixed lineage leukemia (MLL), a chromosome translocation aberrantly fuses the AF10 and MLL genes (see Figure 1.8). The AF10-MLL oncogenic fusion protein aberrantly recruits the histone methyltransferase hDOT1L, resulting in abrogation of the H3K4me mark characteristic of active chromatin, and induces H3K79 hypermethylation, leading to the overexpression of the HoxA9 gene and leukemogenesis [67].
Figure 1.8: Normal myeloid differentiation mediated by histone modifications characteristic of healthy cells (top). Fusion proteins (MLL-AF10) cause aberrant H3K79 methylation and transcription of the Hoxa9 gene, leading to leukemia (bottom). From reference [67].
1.3.1 Epigenetic drug therapy: a promising avenue for cancer treatment
Biochemical processes often require strict regulation by opposite sets of enzymes. In diseases such as cancer, these processes become dysregulated, leading to the silencing of genes that are involved in tumor suppression. The realization that abnormal epigenetic gene inactivation can be reversed led to an interest in studying the enzymes that propagate epigenetic marks as potential therapeutic drug targets. As discussed in the previous section, an important epigenetic process that is often dysregulated in cancer cells is DNA methylation. When CpG islands become hypermethylated by DNA methyltransferases (DNMTs), this can lead to inappropriate inactivation of tumor suppressor genes. Studies of DNA methylation during the 1960s led to the discovery of methylation inhibitors, such as 5-azacytidine [68]. This small molecule has anti-proliferative properties and inhibits tumor growth. Further optimization resulted in the development of structural analogues such as 5-aza-2’-deoxycytidine [69] that have less toxicity and side effects. This research also prompted studies of other enzyme inhibitors as potential epigenetic therapies. These inhibitors exert their pharmacological effects [70] by administration as prodrugs, metabolic activation via phosphorylation, and incorporation into DNA as a modified nucleosides that subsequently interfere with DNA methylation. Continued research into DNMT inhibitors has led to their use as epigenetic chemotherapies that reverse the aberrant gene silencing that occurs in cancer cells. For example, in myelodysplastic syndrome (MDS), the genes encoding the CDK inhibitors p15 and p16 become hypermethylated. Upon treatment with the DNMT inhibitor 5-aza-2-deoxycytidine (decitabine), the hypermethylated state of these genes was reversed in responsive patients, restoring gene function and controlling the proliferation of malignant cells [71]. Clinical studies led to the approval by the US food and drug administration of 5-azacytidine for the treatment of all subtypes of MDS [72], while several other structural analogues are in different phases of drug development.
Histone modifications such as acetylation are also a highly regulated. This regulation is mediated by the reversible actions of both histone acetyltransferases (HATs) and deacetylases (HDACs). In cancers such as acute promyelocytic leukemia (APL) [73],
HDAC enzymes contribute to epigenetic gene silencing through aberrant recruitment by fusion proteins to specific loci, forming a complex with other enzymes, and remodeling chromatin into a condensed state. This deacetylation effect is amplified in cancer, since HDACs can undergo overexpression in certain malignancies such as colon cancer [74]. Wilson and colleagues demonstrated that HDAC4 can promote proliferation of cancerous colon cells by down regulating the p21 gene promoter. Hence, HDACs have also become viable therapeutic drug targets. In humans, there are 18 different types of HDAC enzymes, which are divided into 4 classes [75]: I, IIa, IIb, III, and IV. Every type with the exception of class III enzymes can be inhibited by “classical” small molecule HDAC inhibitors (HDACi). Class I and II HDACi possess a bidentate pharmacophore that can coordinate to and chelate an essential zinc ion within the active site of class I and II HDACs [76]. The third class of HDACs is structurally related to Sir2 yeast proteins, uses NAD+ as a co-substrate, rather than simply hydrolyzing the acetyl group from lysine residues in the target protein. The class III HDACs are not inhibited by “classical” HDACi that block class I and class II enzymes. Once HDACi are bound to an enzyme’s catalytic core, deacetylase activity is blocked, histones become hyperacetylated, and target genes activated through chromatin remodeling (see Figure 1.9). Several research groups, including Marks and colleagues, have shown that HDACi can block proliferation or kill tumor cells by triggering G1/S cell cycle arrest, differentiation, increased levels of reactive oxygen species (ROS), and apoptosis [77]. Furthermore, HDACi can trigger hyperacetylation of non-histone proteins such as transcription factors (E2F1, p53, STAT1). Transcription factor and histone hyperacetylation can act synergistically to shift the equilibrium to reactivate tumor suppressor genes. To date, only two HDACi have been approved by the US food and drug administration for treatment of cutaneous T-cell lymphoma. The most successful and extensively studied HDACi is the Merck chemical Vorinostat (Zolinza), a hydroxamic acid based molecule that inhibits a wide spectrum of class I and II HDAC enzymes. However, the ability of pan-HDACi to alter the acetylation patterns of other proteins has raised concern about toxicity and potential side effects; this has led to research aimed at developing more selective HDACi that target a smaller group of enzymes.
Figure 1.9: Epigenetic drug therapy. In acute promyelocytic leukemia (APL), chromosomal translocations result in fusion proteins that recruit DNMTs and HDAC enzymes to silence tumor suppressor genes. Treatment with HDAC inhibitors can disrupt these complexes, hyperacetylate histones, and reactivate the required genes which trigger cell cycle arrest, differentiation or apoptosis of cancer cells. From reference [78].
1.4 Protein analysis: the early years
The word protein is derived from the Greek word “proteios”, meaning “of first importance or rank” [1]. The term was coined by Jons Jacob Berzelius [79] in 1838 to highlight the biological significance of these molecules. Proteins are present in virtually all cells and are involved in almost all cellular processes, from mitosis to catalysis of xenobiotics. The structural building blocks of proteins are amino acids, which occur naturally in 20 different forms [80]. These structural components are responsible for synthesizing the vast amounts of different proteins in all organisms, from single cell amoeba to complex mammals. The amino acid sequence determines the protein’s structure, chemical properties, folding, and ultimately, its function.
A great interest in the structural biology of proteins started in 1950’s, with the pioneering work of Corey and Pauling. Their research focused on bond lengths, atomic arrangements, and peptide configurations, which eventually led to the elucidation of an
important structural motif: the α-helix [81]. This caused a great interest in protein and peptide research in the scientific community, and fuelled the start of the research explosion into protein structure and function. During the same period, there was another important contribution made in analyzing protein structure: the Edman degradation [82]. This reaction enables the N-terminal sequencing of proteins by sequentially removing one amino acid at a time from the polypeptide backbone. The reaction is a three-step process [80], whereby the polypeptide is reacted with phenyl isothiocyanate (PITC) to form a stable phenylthiohydantoin (PTH) derivative. The PTH-amino acid can be easily analyzed using chromatographic methods, such as HPLC. Repeated cycles of Edman degradation will liberate the amino acids, thus allowing the determination of the protein sequence. Edman degradation has serious limitations [83], including a practical limit of 40 to 60 residues before side reactions make sequencing unreliable, the necessity of a substantial amount of purified protein, and long reaction times. Furthermore, if the N-terminus is modified, the amino acid will not be derivatized, and the method would fail completely [84]. Despite these limitations, it was the principle method that researchers would use for the next thirty years.
1.5 Mass spectrometry: the driving force of proteomics
A sample containing multiple components from an in vivo source can provide a serious challenge from an analytical perspective. “Classical” methods of analysis consist of gas or liquid chromatography with various types of spectroscopic detection (i.e. ultra-violet, fluorescence). Although rugged and reliable, these techniques can sometimes result in ambiguity or uncertainty in the identity of the peaks detected. Mass spectrometry (MS) provides another analytical methodology to detect various analytes, including peptides and proteins. Instead of using a spectroscopic property to detect and measure the component of interest, MS discriminates analytes based on their mass-to-charge (m/z) ratio [85]. Analytes are converted to gaseous ions, and their m/z ratio is recorded onto a mass spectrum. Since the mass is used to identify chemical species, this results in much better specificity in analytical determinations compared to spectroscopic methods. Hence, using MS to investigate a proteome (the protein complement to the
1990’s, this new approach in protein analysis would take over as the method of choice for protein and peptide analysis due to its speed, sensitivity, and specificity.
1.5.1 The emergence of electrospray ionization
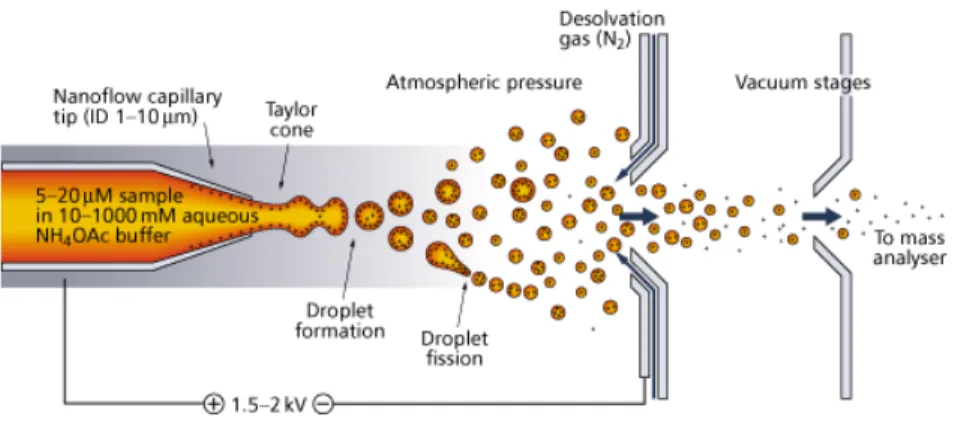
A key breakthrough that would change the landscape of protein analysis by mass spectrometry was the optimization of the electrospray ionization (ESI) process for large biomolecules by John Fenn [86] and colleagues at Yale University. Using data and observations reported by both Rayleigh and Dole [87, 88], Fenn’s group capitalized on this preliminary research and successfully applied it to larger charged species, i.e., proteins [89]. This ionization method uses high voltage (kilo volt range) applied to a narrow diameter capillary with the aid of a counter current flow of drying gas (e.g. nitrogen). Species that are ionizable in solution are placed in a solvent. This solution is passed through the capillary in order to produce charged species in the gaseous phase. During this process (depicted in Figure 1.10), liquid emerging from the tip of the capillary generates the Taylor cone [90] and experiences opposing electrostatic and surface tension forces [91], forming a mist of droplets. Solvent molecules gradually evaporate until the Rayleigh instability limit [92] is reached. Beyond this point, repulsive coulombic forces between species of the same charge overcome the surface tension of the sprayed droplet, releasing ions into the gaseous state. Additives present in the liquid effluent (i.e. acid) undergo charge transfer reactions with analytes in the gaseous phase, producing protonated adducts and pseudomolecular ions [93]. An important feature of ESI is the generation of intact multiply charged ions without fragmentation or decomposition. There are currently two models used to rationalize the generation of ions from charged droplets in the gaseous phase by ESI. The first is the charged residue model (CRM) [94], or single ion in droplet (SIDT) [95] theory, formulated by Dole. In this description, it is assumed that total solvent evaporation results in one analyte molecule being contained per charged droplet at the end of a series of coulombic explosions; this analyte molecule then accepts a charge from the last droplet formed. In the ion evaporation model (IEM) developed by Iribarne and Thomson [96], ions are desolvated
and ejected by a sufficient amount of electrostatic force from the surface of “highly electrified cloud droplets” containing many charges.
Figure 1.10: A close-up view of the formation of gas phase ions during electrospray ionization. From reference [97].
1.5.2 Analytical LC-MS instrumentation for proteomics
There are five main components that make up an MS-based analytical system for proteomics: (a) a sample introduction device, (b) an ion source, (c) a mass analyzer, (d) a detection module, and (e) data processing station. Each component will be discussed in more detail below.
1.5.2.1 Sample introduction for mass spectrometry
The two most common sample introduction devices for MS include liquid and gas chromatographs. Capillary electrophoresis (CE) has also been used to introduce samples into the mass spectrometer [98]. For protein and peptide analysis, capillary HPLC and CE are the two most widely used separation methods [99]. Prior to mass analysis, complex protein extracts or tryptic digests require some form of column separation to decrease the sample complexity and resolve the components individually. This can be accomplished by chromatographic or electrophoretic separation methods. LC column separation by partition chromatography on reversed phase (RP) sorbents [100] is the conventional method for both protein and peptide applications. Two dimensional chromatography with
strong cation exchange (SCX) [101] sorbents installed before the RP column enable orthogonal separations and higher amounts of starting material to be loaded. Alternatively, CE methods in free solution using an applied voltage to separate components based on electrophoretic mobilities have been used to separate complex samples with high efficiency [102].
1.5.2.2 The ionization source
The ion source is present at the exit of the separation column, taking in the liquid effluent and converting it to gaseous phase ions. The ESI emitter, transfer capillary, and electronic control components are contained within the source housing. Since the report by Fenn’s group, ESI has been researched and improved extensively; over the past twenty years, these improvements include atmospheric pressure ionization (API) sources [103], pneumatically-assisted ESI [104], heat-assisted ESI [105], and nano-ESI for higher sensitivity [106, 107]. For proteomics applications, ion sources have been designed to accommodate lower and stable flow rates in the nL/min range, enabling the detection of very low abundance species from biological extracts. Narrow bore emitters also aid in the generation of smaller diameter microdroplets in the submicron range [108], thus resulting in more efficient desolvation and transfer of ions into the gas phase. Modular microfluidic devices (chip-LC) [109] comprising of chromatographic media, transfer lines, and nano ESI emitters have also been developed to integrate all components and simplify routine nano-ESI operation. Using nano-ESI sources, detection limits in the attomole range can be achieved.
1.5.2.3 The mass analyzer
The principle hardware that allows for discriminating ions based on their m/z ratio is the mass analyzer. The ability of a mass analyzer to differentiate neighboring ions is defined as the mass resolution [94]. This can be described by the following equation:
R = m/Δm (1)
where R is the mass resolution, m is the m/z ratio under investigation, and Δm is the
spacing between two neighboring mass spectral peaks (resolving power). Hence, the higher the value of R, the better the ability of the mass analyzer to separate two closely spaced m/z values. There are several types of mass analyzers (see Figure 1.11) for proteomic applications [110], each with their inherent advantages and disadvantages. These include the following: ion trap (IT), triple quadrupole (QqQ), time-of-flight (TOF), Orbitrap, and Fourier transform ion cyclotron resonance (FT-ICR). These analyzers can also be used in tandem in a hybrid type instrument. Storage based mass analyzers like IT use a three dimensional RF-field to capture and release ions [111]. The IT analyzer can been used to detect peptides and proteins, enabling the determination of m/z ratio, while taking advantage of their rapid duty cycle. However, because of low mass resolution (about 1000) and space charge effects, stand-alone ion trap instruments are not totally suited for the analysis of complex proteomic samples.
g Orbitrap
Figure 1.11: Examples of different mass analyzers used for proteomics (a-g). From references [110] and [112].
Both TOF and quadrupole-TOF (Q-TOF) instruments rely on the principle of separating ions in time during their travel through a fixed flight tube of a certain length [113]. Accurate calculation of this flight time results in the determination of the m/z ratio. Development of the reflectron as an “ion mirror” by Mamyrin [114] allowed TOF analyzers to better focus ions and elongate the flight path, resulting in higher resolution. The TOF analyzers can achieve mass resolution between 10 000 to 20 000, while more recent instrumentation can reach up to 40 000. The Orbitrap mass analyzer recently developed by Makarov [115] consists of 2 electrodes that form an electrostatic field. Ions are injected into the device and oscillate back and forth along the inner electrode. The frequency of these oscillations is used to calculate the m/z ratio with very high precision; mass resolutions of up to 100 000 are attainable with this type of mass analyzer. Lastly, FT-ICR (or FT-MS) is another type of mass analyzer used for both intact protein and peptide analysis. In FT-MS, ions are introduced into a cell (Penning trap) in the presence of a magnetic field [116]. Once the ions are trapped and in orbit, they can be excited by the application of a rotating RF electric field oscillating at the frequency of the ions of a given m/z value. Like the Orbitrap analyzer, cyclotronic frequencies for each ion can be converted to m/z ratios. FT-MS analyzers allow the highest attainable mass resolution, i.e., over 100 000.
1.5.2.4 Tandem mass spectrometry
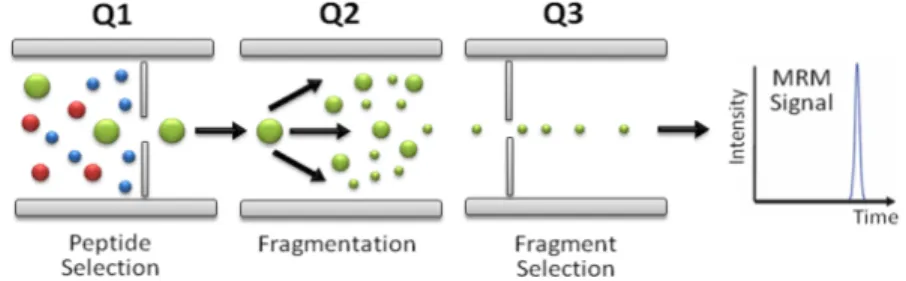
The accurate determination of the ion m/z ratio is only one of the powerful features of a mass analyzer within the LC-MS analytical system. The second attribute that further extends the mass analyzers’ capability is fragmentation of precursor ions and detection of fragment ions. This process is called tandem MS or MS/MS, and is the most widely used technique for fragmenting ions generated through “soft ionization” methods (ESI) [117]. The analysis of fragment ions in a single MS experiment allows for higher selectivity, structural elucidation, and sequencing of both proteins and peptides. A good example is the triple quadrupole mass spectrometer (see Figure 1.12). Triple quadrupole and hybrid triple quadrupole instruments with two mass analyzers and an RF-only collision cell in series [118] (QqQ and QqLIT) enable tandem MS capability, and provide a versatile mass analyzer with multiple types of scan modes, including precursor ion
scan, neutral loss, and multiple reaction monitoring (MRM). These scanning modes allow a researcher to not only obtain further structural information, but also to quantitate analytes with a high degree of precision while increasing signal-to-noise (S/N) ratios for detected species within complex mixtures. The MRM scan mode has been applied extensively by Aebersold’s group to detect and quantify peptides with high precision and sensitivity in a targeted approach [119]. Other instrumental platforms use a TOF, Orbitrap, and FT-ICR to detect fragment ions with higher resolution.
Figure 1.12: Principle of operation of the MRM mode in a triple quadrupole mass analyzer for peptide quantitation. From reference [120].
There are two principles modes of fragmentation used in conventional bottom-up proteomic analyses to elucidate the structure and sequence of peptides. The first is collision-induced dissociation (CID), and the second is electron transfer dissociation (ETD). These mechanisms require a collision or activation cell to fragment ions prior to mass analysis in a second stage.
1.5.2.5 Peptide fragmentation by collision-induced dissociation
In this mechanism, ions detected in the first mass analyzer (i.e., quadrupole or Orbitrap) are transferred to a collision cell along an ion path of increasing electric potential. Depending on the type of instrument, this cell can be an RF only quadrupole, or even an IT analyzer. Neutral molecules (i.e., helium, nitrogen) within the collision cell serve as targets for inelastic collisions with peptide ions. Upon collision, the precursor ions are activated to a higher energy state, whereby a portion of the translation energy imparted to peptide ions is converted to internal energy [121]. This energy is then
redirected and randomized throughout the peptide molecule, leading to the most thermodynamically stable bond cleavage (i.e., the path of least resistance) and fragment generation. The end result of this activation process is a charged fragment ion and a neutral species. This can be summarized in the following two-step reaction:
Mp+ + N Æ Mp+ (act) Æ mf+ + n0 (2)
Where Mp+ is the precursor peptide ion, N is the neutral collision gas molecule, Mp+ (act)
is the activated precursor peptide ion, mf+ is the charged peptide fragment, and n0 is the
neutral peptide fragment.
Basic sites at the N-terminus and amino acid side chains provide anchor points for protonation. These protons are not totally static, but can move about, creating a heterogeneous population of peptide ions with the same sequence but protonated at different amide linkages [122]. According to the mobile proton model [123], these protons can migrate along the peptide backbone by internal solvation, and upon activation by CID, contribute in the fragmentation of the peptide in a “charge-directed” manner. In low-energy (up to 50 eV) collision instrumentation (i.e. quadrupole, Q-TOF,) this fragmentation scheme generates a predictable series of peptide fragment ion pairs by cleavage along the amide backbone [124], along with loss of water and ammonia. The fragmentation and generation of peptide ions is depicted in Figure 1.13.
Figure 1.13: Peptide fragment ion generation. The types of ions produced depend upon where the cleavage site occurs. From references [125] and [126].
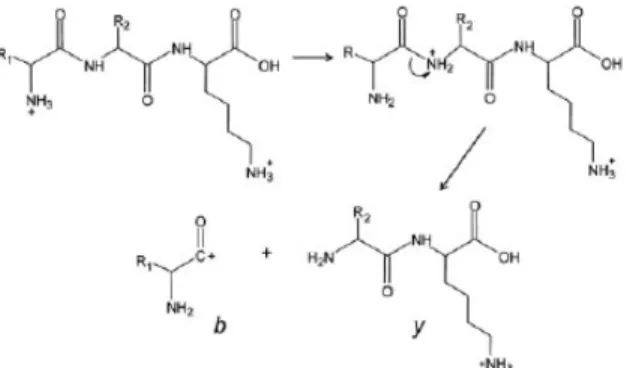
Fragments ions generated from peptide amide bond cleavages are classified as either b- or y-type ions, depending on which terminal end the fragmentation is initiated (N- or C-terminus) [127]. Cleavages of bonds adjacent to the amide bond result in either
a,x or c,z ion pairs (see figure 1.13). Under CID conditions, the predominant ion pairs
formed are b and y ions. Each amino acid will produce its own characteristic b and y fragment ions (see Figure 1.14); thus, the sequence of a given peptide can be deduced based on the type of fragment ions generated by tandem MS.
Figure 1.14: The CID fragmentation mechanism demonstrating the formation of b- and
y-type ions. From reference [128].
1.5.2.6 Peptide fragmentation by electron transfer dissociation
Although a very powerful activation technique, CID does have inherent limitations. These include lower fragmentation efficiency of higher charge state ions (i.e., +4 and greater), as well as inducing loss of labile post translational modifications (PTMs), i.e, phosphorylation, sulfonation, and glycosylation (e.g. O-GlcNAcylation). The application of CID has been used successfully by many groups in the sequencing and localization of phosphorylation sites; for example, Gygi demonstrated the sequencing of over 2000 phosphopeptides from the nucleus of HeLa cells in a large scale study using CID [129]. Even though very functional and reproducible, tandem MS by CID is only providing a limited view of the modified peptides present in a given proteome. To further enable and extend the capabilities of tandem MS to sequence larger peptides, proteins, and labile PTM, new activation methods were required. A key breakthrough was reported in 1998 by McLafferty and Zubarev in the development of a new activation process called electron capture dissociation (ECD) [130]. In this technique, low energy,