HAL Id: hal-02882706
https://hal.archives-ouvertes.fr/hal-02882706
Submitted on 27 Jun 2020HAL is a multi-disciplinary open access archive for the deposit and dissemination of sci-entific research documents, whether they are pub-lished or not. The documents may come from teaching and research institutions in France or abroad, or from public or private research centers.
L’archive ouverte pluridisciplinaire HAL, est destinée au dépôt et à la diffusion de documents scientifiques de niveau recherche, publiés ou non, émanant des établissements d’enseignement et de recherche français ou étrangers, des laboratoires publics ou privés.
Interdiffusion behaviors observation in TiN/ZrO N
bilayer by XAS and ToF-SIMS
Yanyan Yuan, Philippe Jonnard, Karine Le Guen, Bingye Zhang, Anouk
Galtayries, Angelo Giglia, Yuchun Tu, Chao Yan, Rui Lan, Rui Liu
To cite this version:
Yanyan Yuan, Philippe Jonnard, Karine Le Guen, Bingye Zhang, Anouk Galtayries, et al.. Interdif-fusion behaviors observation in TiN/ZrO N bilayer by XAS and ToF-SIMS. Applied Surface Science, Elsevier, 2020, 528, pp.146968. �10.1016/j.apsusc.2020.146968�. �hal-02882706�
1
Interdiffusion behaviors observation in TiN/ZrO
xN
ybilayer
by XAS and ToF-SIMS
Yanyan Yuan1*, Philippe Jonnard2, Karine Le Guen2, Bingye Zhang1, Anouk Galtayries3, Angelo Giglia4, Yuchun Tu5, Chao Yan1*, Rui Lan1, Rui Liu1
1 National Demonstration Center for Experimental Materials Science and Engineering
Education (Jiangsu University of Science and Technology), Zhenjiang 212003, P. R. China
2 Sorbonne Université, Faculté des Sciences et Ingéniérie, UMR CNRS, Laboratoire de
Chimie Physique-Matière et Rayonnement, 4 place Jussieu, F-75252 Paris cedex 05, France
3 Chimie ParisTech, PSL University, CNRS, Institut de Recherche de Chimie Paris, CNRS –
Chimie Paris Tech, 11 rue Pierre et Marie Curie, F-75005 Paris,France
4CNR-Istituto Officina Materiali, I-34149 Trieste, Italy
5 Shanghai Institute of laser plasma, No.1129, Chenjiashan road, Jiading district, Shanghai,
201800, P. R. China
Abstract
Interface behavior plays an important role in multilayer structure. The deep understanding of interface diffusion and reaction is necessary to improve the performance of device with multilayer structure. In the present work, we perform a detailed systematic study on interdiffusion and interaction between the TiN and ZrOxNy layers in the TiN/ZrOxNy bilayer system. A series of TiN/ZrOxNy bilayers
with reverse deposition orders or with varied composition have been prepared by radio-frequency reactive magnetron sputtering. Synchrotron radiation x-ray absorption spectroscopy (XAS) and time of flight secondary ion mass spectrometry (ToF-SIMS) are both used to understand well interface diffusion behavior. The XAS results indicate that interaction and interdiffusion extent between TiN and ZrO2
(ZrOxNy) layers depend on deposition order of both layers. Herein the O atoms enter
easily into the TiN layer by substituting the N atoms when the ZrO2 or ZrOxNy layer is
deposited onto the TiN layer. No significant interaction between TiN and ZrN layers takes places in the TiN/ZrN sample. Both XAS results and ToF-SIMS depth profiles reveal that the interaction between TiN and ZrOxNy layers depends on the deposition
order of the layers. TiN is more easily oxidized when ZrO2 or ZrON is deposited onto
TiN. In addition, the resulting stacks are not significantly different if ZrON is used instead of ZrO2, revealing most probably the full oxidation of ZrON.
Keywords:TiN/ZrOxNy; X-ray absorption spectroscopy (XAS); Time of Flight
secondary ion mass spectrometry (ToF-SIMS); Interdiffusion
*
Corresponding author: [email protected] (Yanyan YUAN); [email protected] (Chao YAN)
3 1. Introduction
Transition metal nitrides, such as TiN, ZrN, and CrN are widely used as protective coatings for cutting and forming tools due to their high hardness and wear resistance [1-4]. Some multicomponent coatings are also designed to further provide the performance of hard coatings, like TiYN, TiCrN, TiWAlN, TiMoSiN [5-10]. Recently periodic multilayer systems alternating (at least) two kinds of component materials have attract number of interests [11-13]. They are not only applied in protecting coatings but also in optics as well as other devices [14-19].
Nanoscale multilayer system can provide excellent performances due to their multi-interfaces structures, refined crystalline strengthening and periodic modulation. Regarding the hard protective coating, transition metal oxides and nitrides have been widely used to prepare periodic nano-multilayers owing to their excellent properties such as chemical stability and mechanical properties as well as oxidation resistance [20-25]. Among them TiN and ZrN crystallize in the face centered cubic (fcc) system and have similar physical properties such as high melting point, high hardness and chemical inertness. TiN-based and ZrN-based multilayer coatings have received amount of attentions [4, 26-32]. Multilayer structures consisting of transition metal oxynitrides show potential excellent performance and have been widely studied because they can combine or even exhibit better properties of both nitrides and oxides [33-36].
According to the hardening mechanism, the mechanical properties of hard coatings composed of two alternating materials are quite related to the coherent epitaxial growth of the two layers[26]. If the two layers can form coherent epitaxial growth with sharp interface, the hardness of coatings increases largely. However, the stable coherent epitaxial growth of oxides cannot be easily obtained meanwhile interfacial diffusion mechanisms between two layers has great influence on growth behavior.
The combination of transition metal nitrides and oxynitrides are proposed to form a periodic multilayer coating, with aim to not only improve the hardness but also the oxidation resistance at high temperature. It is important to know how the
physical-chemical reactive behaviors at the interfaces affect the mechanical properties of such a multilayer. Most published papers have mainly reported about their mechanical properties and phase structure [3, 15, 29, 37, 38]. The effects of layer growth order on the interface diffusion behaviors are rarely reported [39].
In this context, magnetron sputtering technique was used to prepare all samples. The present work focused on interface diffusion behaviors in the TiN/ZrOxNy
multilayer coatings with reverse deposition order. In order to observe separately two kinds of interfaces, we have prepared a series of samples by varying oxygen and nitrogen mixture partial pressure during the deposition process. We have also prepared the same series of samples but with reverse orders: ZrOxNy-on-TiN and
TiN-on-ZrOxNy. X-ray absorption near edge structure (XANES) spectra of all samples
was measured to check their electronic and structural properties. Otherwise, time of flight secondary ion mass spectrometry (ToF-SIMS) elemental depth profiles are also recorded to analyze the interface information. This is of great significance for improving the preparation of the periodic multilayer coatings and their related properties of device.
2. Experimental details 2.1 Preparation of sample
To understand in detail the interaction of TiN and ZrOxNy layers, three series of
bilayer samples: Si/TiN/ZrO2, Si/TiN/ZrON, Si/TiN/ZrN, with corresponding reverse
deposition order of layers, were prepared on Si (111) substrates using radio-frequency magnetron sputtering (JCP-500M3 Beijing Technol. Co. LTD., China) with targets of TiN (99.9%), ZrO2 (99.95%) and ZrN (99.5%). The Si (111) substrates were sliced
with an area of 20 mm×20 mm. The base pressure was 6.0×10⁻⁴Pa before deposition. The target–substrate distance was about 100 mm. The sputtering powers of the targets TiN, ZrO2 and ZrN were set at 120, 100 and 100 W, respectively. The working gas
was argon (99.999%) with a constant flow rate of 20.0 standard cubic centimeters per minute (sccm) when the TiN, ZrO2 and ZrN layers were deposited. The ZrOxNy layers
5
were prepared using ZrO2 target with argon (10 sccm) and nitrogen (10 sccm). TiN,
ZrO2 and ZrN single layers were also prepared as reference samples. Capping layers
of B4C were deposited on all the bilayer and single layer samples to prevent the
oxidation of their surface. Regarding the bilayer, the expected thickness of each layer is around 2.0 nm. The thickness of the single layers (ZrO2, TiN, ZrN) is around
15.0 nm. All samples were grown at room temperature. 2.2 X-ray absorption spectroscopy
X-ray absorption spectroscopy (XAS) is a powerful technique for probing the local electronic structure around a specific element in thin films and other structures[27]. X-ray absorption near edge structure (XANES) provides important information about the electronic and structural properties. Because XANES measurements probe the unoccupied density of states, the method is very sensitive to the local bonding environment, such as the number of valence electrons, their spin configurations, and the symmetry and coordination number of the structural unit cell of the transition metal compounds. In the case of buried interfaces, the phases are often formed in a narrow region, are highly disordered, or present a short-range order. Thus, the XAS technique with short-range order sensitivity provides a suitable tool for the study of interface phases, also called interphases.
XAS measurements of all the samples were performed on the BEAR beamline in the Elettra synchrotron radiation facility[40]. Before XAS measurements, we first performed sputtering on the samples for about 40 min using Ar+ (10-6 mbar, 3 keV, 45°, 1 µA), to remove the capping layer of B4C. Then the B K edge was checked to be
sure that the B4C layer was removed enough. Thus, it was possible to get information
from the buried interfaces. The absorption spectra were obtained by measuring the drain current of the samples, that is to say XAS measurements were performed in total electron yield mode. All the spectra were normalized (divided) by the I0 curve obtained measuring the total electron yield on a clean gold sample and then to take into account features present in the spectra due to the contamination of the optical
elements (mirrors, gratings and so on) present on the beam line. This is a particularly important correction in the N K and O K ranges.We collected the Zr M2,3, Ti L2,3, N K,
O K XANES spectra. The EXAFS measurements were measured above the O K edge, up to 650 eV.
2.3 Time of flight secondary ion mass spectrometry
ToF-SIMS has already been demonstrated to be a useful tool to obtain the elemental and chemical depth profiles in multilayers [19, 39, 41]. In this paper the elemental depth distributions of the bilayer samples, Si/TiN/ZrO2, Si/ZrO2/TiN,
Si/TiN/ZrON and Si/ZrON/TiN, were investigated using a ToF-SIMS instrument (TOF.SIMS V spectrometer, ION-TOF GmbH) working in the dual-beam mode. The sputtering was performed using a 500 eV (25 nA) Cs+ ion beam, rastered over an area of 300 µm × 300 µm. A pulsed 25 keV Bi+ primary ion source at a current of 1.0 pA, rastered over a scan area of 100 µm × 100 µm was used as the analysis beam. Both ion beams were impinging the sample forming an angle of 45◦ with the surface normal
and were aligned in such a way that the analyzed ions were taken from the center of the sputtered crater. Both positive and negative ions were recorded. The ToF-SIMS technique provides a qualitative chemical analysis as the intensity does not correspond directly to the number of atoms in the multilayer (the sputtering yields vary from one element to another as well as from one matrix to another).
3. Results and discussion
3.1 X-ray absorption spectroscopy
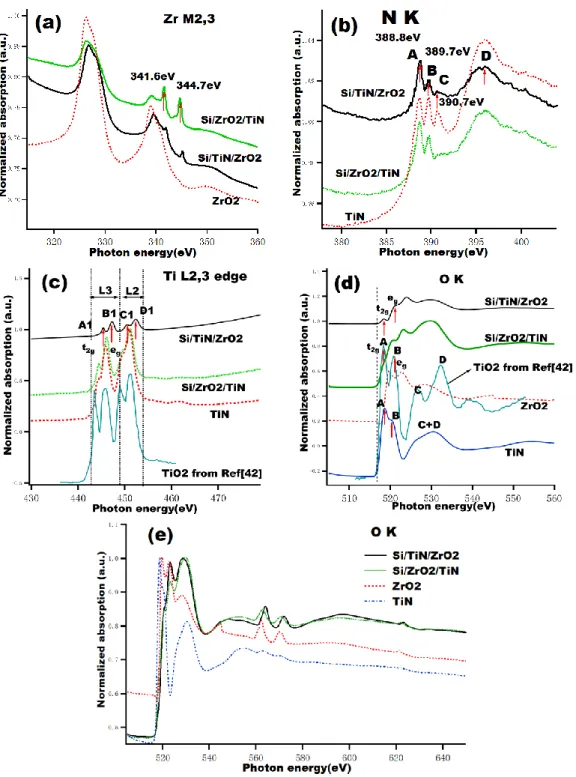
Figure 1 shows the XANES spectra of the Si/ZrO2/TiN, Si/TiN/ZrO2 bilayers and
ZrO2 and TiN single layers. As reported in Ref. [27] the features of XAS spectra in
transition metal oxides and nitrides are related with number of d electrons, electronic configuration as well as crystal structure. In the following part, all these XAS spectra will be analyzed by considering these factors. Figure 1(a) presents the Zr M2,3 edge.
The spectra of both bilayer samples show similar features but they are very different from that of ZrO2 single layer. The bilayer samples have two main peaks around at
7
326.4 and 339.2 eV corresponding to the expected Zr 3p1/2-3p3/2 spin-orbit splitting of
13.7 eV. These two peaks around at 326.4 and 339.2 eV correspond to the Zr-O bond but two small peaks around at 341.6 and 344.7 eV cannot be identified directly. They should probably be ascribed to multiplet electron effect between the TiN and ZrO2
layers. The Si/ZrO2/TiN sample shows a strong intensity around these two small
peaks compared with that of the Si/TiN/ZrO2 sample. It means that interaction takes
places when ZrO2 layer is deposited onto the TiN layer or crystallization behavior of
the TiN layer changes.
Regarding the N K edge, Figure 1(b), the three samples show similar features with an exception of the Si/ZrO2/TiN sample which shows no peak around at 390.7 eV.
According to the Ref. [27], the first two relatively sharp features A and B can be assigned to transitions to the t2g (Ti3d + N2pπ) and eg (Ti3d + N2pσ) orbitals,
respectively; while the higher energy broad feature D is related to the excitation to the (Ti4sp + N2p) states. The peak located around 390.7eV corresponds to the N-Ti2p bond.
Comparison of the Ti L2,3 XANES, Figure 1(c) obtained from two bilayers and
TiN samples shows similar features but a peak shift of 1.4 eV toward higher energy for the Si/TiN/ZrO2 sample. The Ti L2,3 spectra display a complex structure due to the
combination of the atomic interactions and crystal field effect. The spectral features in the L2,3 region corresponds to O2p3/2–Ti3d and O2p1/2–Ti3d transitions, respectively.
Furthermore, it can also be clearly seen that Ti L3 and L2 edges further split into t2g
(A1 and C1) and eg (B1 and D1) states due to crystal field effect. Compared with the
Ti L2,3 spectra of TiO2 from the reference [42], the secondary peaks A1 and C1 around
the main peaks in all samples are due to the oxidation of the TiN layer. However, the intensities of A1 and C1 relative to those of B1 and D1 in the Si/TiN/ZrO2 sample is
higher than that in the other two samples. It means that when the ZrO2 layer is
deposited onto the TiN layer the O atoms enter easily into the TiN layer by substituting the N atoms. Indeed, when the ZrO2 layer is deposited onto the TiN layer,
operation. Therefore these energetic species easily interact with TiN layer to oxidize Ti. However in reverse mode, TiN layer is deposited onto ZrO2 layer which is a very
stable compound. Moreover the Zr and O atoms have a big electronegativity difference so O atoms in the ZrO2 compound difficulty enter into the TiN layer.
Figure 1. XANES (a-d) and EXAFS (e) spectra of the samples: Si/TiN/ZrO2, Si/ZrO2/TiN
bilayers, TiN and ZrO2 single layer samples. For the sake of clarity, some spectra are shifted vertically.
9
ZrO2 references and TiO2 from Ref.[42]. Significant changes are obtained between
single layer and bilayer samples. In principle, the TiN layer should not contain O atoms but here O K spectrum was observed because the bilayer sample was slightly oxidized. Ref. [27] reported that the number of O K edge features and their peak positions are very different from one metal oxide to another. It can be seen clearly that the features of two bilayer samples are neither same as those of TiN nor ZrO2. It
means that some interaction occurs at the interface between TiN and ZrO2 layers. In
the TiO2 spectrum, peaks A and B can be assigned to transitions to the t2g (Ti
3d + O2pπ) and eg (Ti3d + O2pσ) orbitals, respectively. The broad feature at higher
energy is related to the excitation to the (Ti4sp + O2p) states. For TiN and ZrO2
samples, the broad features are related to the excitation to the (Ti4sp + N2p) and (Zr4sp + O2p) states, respectively. Then, the broad features of two bilayer samples are related to the excitation to the (Ti4sp + N2p) and/or (Zr4sp + O2p) states.
Figure 1(e) shows the O K-edge EXAFS spectra. Two peaks located around at 562 and 570 eV appear in the two bilayer sample and ZrO2 sample. They should be due to
the Zr and O atoms interaction. It can be concluded from the comparison of the spectra of the bilayer and single layer samples that an interaction between TiN and ZrO2 layers does take place. The bilayer with different deposition order presents
different spectral changes indicating different interface behaviours.
Figure 2. XANES (a-d) and EXAFS (e) spectra of the samples: Si/TiN/ZrN, Si/ZrN/TiN bilayers and TiN and ZrN single layer samples. For the sake of clarity, some spectra are shifted vertically.
Figure 2 shows the XAS spectra of the bilayers Si/TiN/ZrN, Si/ZrN/TiN as well as single layer TiN, ZrN samples. The Zr M2,3 spectra, shown in Figure 2(a), of the
bilayers is different from that of ZrN single layer. Some small peaks (341.6 and 344.8 eV) and shoulders are accompanied the two main peaks which probably correspond to the Ti-N bond. For the Si/TiN/ZrN sample, shoulders toward lower energy around two main peaks are observed. In addition, the positions of the two main peaks in the Si/ZrN/TiN sample shift to higher energy with respect to the two other samples. This indicates that the bonding environment of Zr atoms in the Si/ZrN/TiN sample is different from the other samples.
About the N K spectra, shown in Figure 2(b), they all have a similar shape with an exception of the ZrN sample. The features can be assigned to the excitation of N 1s electrons to the hybridized molecular orbitals of TiN or ZrN. As discussed earlier in the Figure 1(b) the first two relatively sharp features (A2 and B2) in the bilayer
11
samples and the TiN samples can be assigned to the N 2p orbitals hybridized with metal nd states, which are splitted into the t2g (Ti/Zr3d + N2pπ) and eg
(Ti/Zr3d + N2pσ) orbitals, respectively; the higher energy broad feature (D2) is related to the excitation to the (Ti/Zr4sp + N2p) states. The sharp feature located at round 390.7eV (C2) should correspond to the N-Ti/Zr 2p bond. However, for the ZrN sample, a new feature located at 392 eV appears with the narrow feature at higher energy. It is probably due to the bonding environment of N in the ZrN thin films. The broad feature D2 at higher energy of two bilayer samples has a lower intensity than that of TiN single film. This should be ascribed to the comprehensive bonding environment of N atoms in the ZrN and TiN layers. Perhaps some interaction takes place at the interface between ZrN and TiN layer.
Regarding the Ti L spectra in Figure 2(c), both bilayer samples show different features. As discussed in earlier, the L3 and L2 edges in the Si/ZrN/TiN sample further
split into t2g (A2 and C2) and eg (B2 and D2) states due to crystal field effect.
About the O K spectra, Figure 2(d), the four samples present similar peak feature: A2, B2 and C2, but with different positions and intensities. The absorption edge position changes as a function of samples. The Si/ZrN/TiN sample shows two first sharp peaks similar as those of the ZrN single layer. The position of the first two features in the Si/TiN/ZrN samples shifts towards higher energy compared with TiN single layer. The two peak features in TiN layer are similar to the two first features of TiO2 from Ref. [42]. It means that a little bit of oxidation occurs in the TiN layer. The
three other samples behave in a similar way.
In Figure 2(e) no obvious changes of EXAFS spectra happen on the all samples meaning that the distance of interstitial atoms and coordination number in the ZrN and TiN layer do not change.
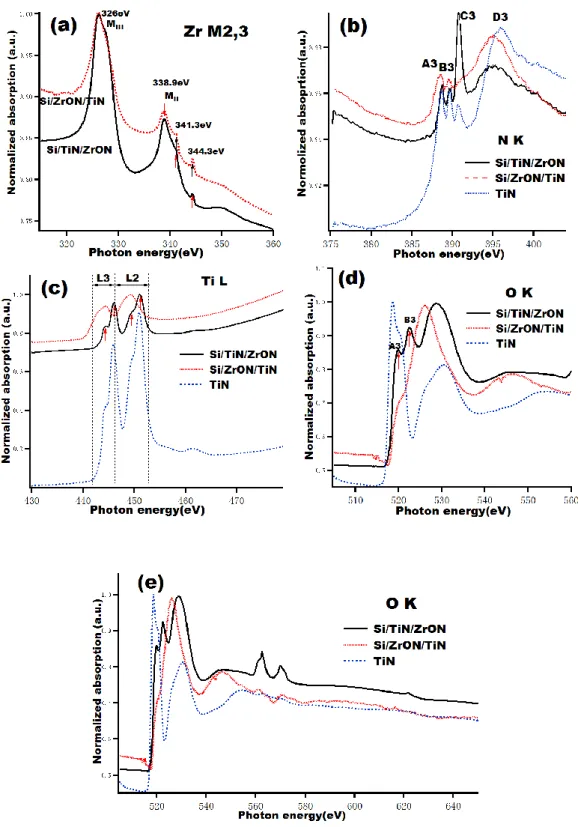
Figure 3. XANES (a-d) and EXAFS (e) spectra of the samples: Si/TiN/ZrON, Si/ZrON/TiN bilayers and TiN single layer samples.
Figure 3 shows the XAS spectra of the Si/TiN/ZrON, Si/ZrON/TiN and TiN samples. The Zr M2,3 edge of two bilayer samples, shown in Figure 3(a), have similar
features but with different peak intensities. In addition, at higher energy, as discussed earlier, both bilayer samples show two weak peaks around at 341.3 and 344.3 eV
13
which can be ascribed to the multiplet electron effect between TiN and ZrON layers. In Figure 3(b), each sample shows a similar first two A3 and B3 features. They are due to the transitions of the t2g (Ti/Zr 3d + N 2pπ) and eg (Ti/Zr3d + N2pσ)
orbitals, respectively. But the Si/TiN/ZrON sample possesses a strong C3 peak ascribed to the Zr-N bond [27]. Furthermore the crystal structure of both layers also affects the spectra shape because of multi-electron configuration interaction.
Figure 3(c) shows the Ti L spectra of the three samples. It can be seen clearly that the Si/TiN/ZrON sample gives rise to similar four features as TiO2 shown in Figure
1(c), which indicates the slightly oxidation of TiN layer. The peak position of the Si/ZrON/TiN sample shifts towards lower energy indicating a different crystal structure of both bilayer samples.
In Figure 3(d), the Si/TiN/ZrON sample gives rise to significant sharp features of O K edge which is related to the hybridization of the O 2p orbital with metal 3d states, with a broad structure in higher energy. However, the Si/ZrON/TiN sample does not show a similar behavior. This means that these three features can be attributed to oxidation of the TiN layer.
The O K edge EXAFS spectra are presented in Figure 3(e). They greatly change from one sample to another. The O K absorption edge of the Si/ZrON/TiN sample shifts toward higher energy. The bilayer samples present different spectra. Furthermore, the peaks around at 562.5 and 570.0 eV should be due to the interaction between the Zr and O atoms. All these changes demonstrate again that the O atoms easily diffuse into the TiN layer only when ZrOxNy layers are deposited onto TiN
layer.
From the above analysis, it can be seen that different deposition orders of the thin layers lead to different spectral features. This means that the interface atoms environment is affected by the deposition order of the two same layers. The first deposited layer can change the crystallization behavior of post-deposition layer as well as accompanies the multiplet electrons effects and electronic configuration change at interfaces.
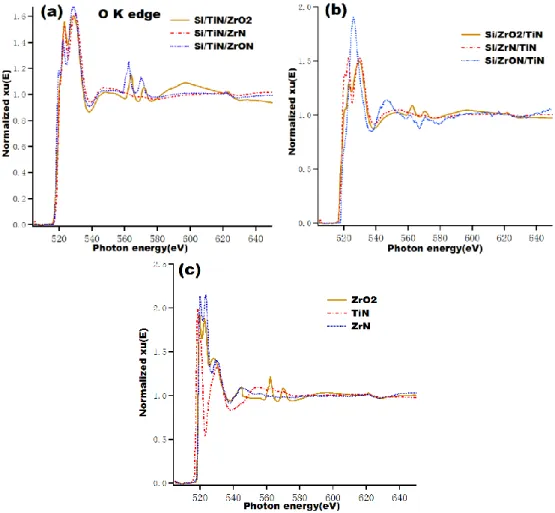
Figure 4. O K edge EXAFS of all samples, (a):Si/TiN/ZrO2, Si/TiN/ZrON, Si/TiN/ZrN bilayer; (b) Si/ZrO2/TiN, Si/ZrON/TiN, Si/ZrN/TiN bilayer; (c) ZrO2, TiN and ZrN single
layer.
Figure 4(a) shows the O K EXAFS spectra of three bilayer samples with the same deposition order of TiN layer, that is to say TiN being the first layer close to Si substrate. Near the edge, the three samples show similar features. But the O K absorption edge of the Si/TiN/ZrON sample shifts toward lower photon energy. In the extended edge area range at 550-640 eV, especially after 620 eV, the Si/TiN/ZrO2
sample presents different spectra from the others. It means that an interaction between O and Ti or N atoms takes place. Figure 4(b) is EXAFS with the ZrOxNy layer close to
the Si substrate. The feature of the Si/ZrON/TiN sample is different from the others, as it presents a strong peak around at 526 eV. After 560 eV no more features are observed. The Si/ZrO2/TiN and Si/ZrN/TiN samples present similar features but with
15
the Si/ZrO2/TiN sample. Figure 4(c) shows the O K EXAFS spectra of the three single
layer samples. ZrO2 and ZrN show similar spectra around their edge. But in the
extended edge area only the ZrO2 sample present two small peaks at 562 and 567 eV.
Now let us go back to the EXAFS spectra of the bilayer samples: it is observed that all bilayer samples with ZrO2 layer present two similar small peaks around at 562 and
567 eV. In addition, the Si/TiN/ZrON sample has also two similar peaks. It indicates that these two peaks are due to the Zr-O bonding environment.
3.2 Time of Flight Secondary Ion Mass Spectrometry
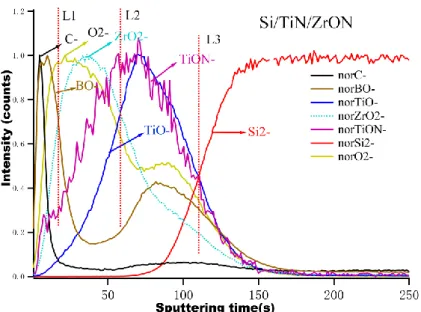
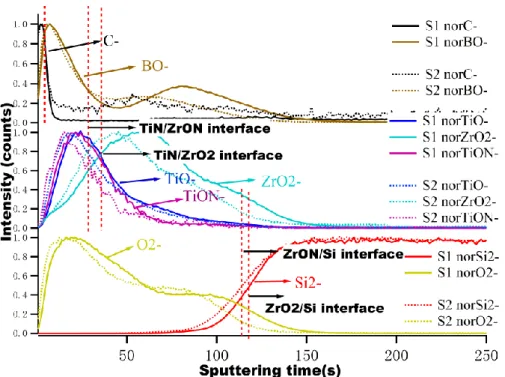
A selection of four samples has been profiled in depth by ToF-SIMS to get the direct view of the composition of the stacks. The focus has been put on the order of the stack as regards TiN and the Zr-containing compounds, as well as on the impact of using ZrON compared to ZrO2. Figure 5 shows the negative ion depth profiles, which
intensities are normalized, of the Si/TiN/ZrON sample. The vertical red dashed lines: L1, L2 and L3 arbitrarily materialize B4C-on-ZrON, ZrON-on-TiN and TiN-on-Si
substrate interfaces, for better visualizing the stack. The C-, BO-, ZrO2-, TiO-, TiON-,
Si2- and O2- are excellent chemical markers for the different layers (from the
outermost part of the stack to bulk Si) which reveal :
- the outermost contamination layer of adventitious carbon (C-);
- the B4C capping layer, well described by the BO- and BO2- markers (BO2- line
is not shown here for sake of clarity), which is at least partly (maybe totally) oxidized most probably in air during transfers;
- the ZrO2- ion profile (or ZrO-, not shown here) represents the Zr-rich layer, with
an increase, a short plateau and a decrease at the interface with the following layer;
- the TiON- and TiO- depth profile, at the interface with the ZrON layer and Si substrate, respectively (the substrate is itself well described by the Si2- profile,
representing bulk Si).
maximum corresponding to the most oxidized part, which is most probably oxidized-ZrON into ZrO2, during deposition. It is also necessary to indicate that the
ZrON- ion does not present any significant intensity along the Zr-rich layer, confirming the change in chemistry of the Zr-compound (into ZrO2). This is also in agreement with
the XANES conclusions.
As regards interfaces between the ultra-thin layers, Si/TiN/ZrON shows a significant overlap between the TiO- and ZrO2- profiles, indicating a possible intermixing between
the Zr-rich and Ti-rich layers. The internal interface between the Ti-rich layer and bulk Si is also mixed with the passive part of Si (oxidized Si into SiO2) which has formed on
top of the wafer, whatever the cleaning pre-treatment before deposition.
One important intermediate conclusion is that the ToF-SIMS depth profile proves the bi-layered structure in Si/TiN/ZrON, with additional proofs of the chemical information in and between the layers. After about 100 s of sputtering in our conditions, both ultra-thin deposited layers are sputtered.
Figure 5. ToF-SIMS depth profiles of negative ions for the Si/TiN/ZrON sample (normalized intensities)
Figure 6 shows the negative ion depth profiles of the Si/ZrO2/TiN and Si/ZrON/TiN
samples. The C-, BO-, ZrO2-, TiO-, TiON-, Si2- and O2- ion profiles, which intensities
are normalized, present a similar bi-layered structure as in Si/TiN/ZrON, but this time, the Ti-rich layer (represented by the TiO- and TiON- markers) is at the interface with
17
the B4C layer (represented by the BO- marker), while the Zr-rich layer (represented by
the ZrO2- marker) is an inner interface with the passivated silicon of bulk Si. Again,
after about 100 s of sputtering, the full stack is sputtered. When comparing with Si/TiN/ZrO2, it seems that there is no significant difference here between ZrO2 and
ZrON compounds in the stacks, from the examination of the profiles. Most probably the reason is that they are too thin layers (2.0 nm) to get a bulk composition, having two close interfaces with oxidized compounds, oxidized silicon at the inner interface and oxidized Ti at the other interface.
The question is then to compare Si/TiN/ZrON and Si/ZrON/TiN samples. Between the two profiles (Figure 5 and Figure 6), we can compare both the shape of the TiO -line and the intensity of the TiON- profile: the former is reasonably sharp and symmetric (the profile presents a full width at half maximum of about 35 s of sputtering) in Si/ZrON/TiN (similar in Si/ZrO2/TiN), and it is larger (about 40 s of
sputtering) and less symmetric in Si/TiN/ZrON (same observation can be made with the Si/TiN/ZrO2 sample, which profile is not shown here). This increased “width”
may reveal a mixed inner interface with the oxidized silicon present in the outermost layer of bulk Si.
Figure 6. ToF-SIMS profiles (normalized intensities) of negative ions of the Si/ZrO2/TiN (labeled as S1) and the Si/ZrON/TiN (labeled as S2) samples.
The shape of the TiON- profile is the same as the TiO- profile with a smaller intensity but still very significant in the case of Si/ZrON/TiN (similar in Si/ZrO2/TiN), while
the TiON- signal is hardly detectable in the case of Si/TiN/ZrON and Si/TiN/ZrO2
samples. This may indicate that the TiN layer is not fully oxidized into a TiO2 layer, as
stated above from the XANES measurements, when TiN is at the outer interface, while it is more oxidized at the inner interface.
4. Conclusion
The interdiffusion and interactions in TiN/ZrOxNy bilayers with reverse deposition
orders were studied by synchrotron radiation x-ray absorption spectroscopy and time of flight secondary ion mass spectrometry. The interface diffusion and reaction between TiN and ZrOxNy layers is fully understood by using the samples with reverse
layer order. No significant interaction between TiN and ZrN layers was found in the Si/TiN/ZrN sample. Both XAS results and ToF-SIMS depth profiles reveal that the reaction between TiN and ZrOxNy layers depends on the deposition order of layers.
The TiN layer is more easily oxidized when the ZrO2 or ZrON layer is deposited onto
the TiN layer. In addition, the resulting stacks are not significantly different if ZrON is used instead of ZrO2, revealing most probably the full oxidation of ZrON.
Acknowledgments
This work was supported by the National Natural Science Foundation of China (#51702133) and by the Priority Academic Program Development of Jiangsu Higher Education Institutions (PAPD). The research leading to these results has received funding from the European Community’s Seventh Framework Programme (FP7/2007-2013) under grant agreement Nº 226716.
References
1. Aihua, L., et al., Friction and wear properties of TiN, TiAlN, AlTiN and CrAlN PVD nitride coatings. International Journal of Refractory Metals and Hard Materials, 31 (2012) 82-88.
2. Pogrebnjak, A.D., et al., Structure and properties of arc evaporated nanoscale TiN/MoN multilayered systems. International Journal of Refractory Metals and Hard Materials, 48 (2015) 222-228.
19
3. Shan, L., et al., Structure and mechanical properties of thick Cr/Cr2N/CrN multilayer coating deposited by multi-arc ion plating. Transactions of Nonferrous Metals Society of China, 25(4) (2015) 1135-1143.
4. Pogrebnjak, A., et al., Multilayered vacuum-arc nanocomposite TiN/ZrN coatings before and after annealing: Structure, properties, first-principles calculations. Materials Characterization, 134 (2017) 55-63.
5. Ju, H. and J. Xu, Microstructure, oxidation resistance, mechanical and tribological properties of Ti–Y–N films by reactive magnetron sputtering. Surface and Coatings Technology, 283 (2015) 311-317.
6. Xu, J., H. Ju, and L. Yu, Influence of silicon content on the microstructure, mechanical and tribological properties of magnetron sputtered Ti–Mo–Si–N films. Vacuum, 110(2014) 47-53.
7. Ju, H. and J. Xu, Influence of vanadium incorporation on the microstructure, mechanical and tribological properties of Nb–V–Si–N films deposited by reactive magnetron sputtering. Materials Characterization, 107 (2015) 411-418.
8. Xu, J., H. Ju, and L. Yu, Microstructure, oxidation resistance, mechanical and tribological properties of Mo–Al–N films by reactive magnetron sputtering. Vacuum, 103(2014) 21-27.
9. Yu, L., et al., Influence of Al content on microstructure, mechanical and tribological properties of Ti-W-Al-N composite films. Vacuum, 137 (2017) 31-37.
10. Thampi, V.V.A., A. Bendavid, and B. Subramanian, Nanostructured TiCrN thin films by Pulsed Magnetron Sputtering for cutting tool applications. Ceramics International,. 42(8) (2016) 9940-9948.
11. Arias, D.F., Y.C. Arango, and A. Devia, Characterization of bilayer coatings of TiN/ZrN grown using pulsed arc PAPVD. Applied Surface Science, 252(4) (2005)1175-1181.
12. Naddaf, M., et al., Influence of N2 partial pressure on structural and microhardness properties of TiN/ZrN multilayers deposited by Ar/N2 vacuum arc discharge. Nuclear Instruments and Methods in Physics Research Section B: Beam Interactions with Materials and Atoms, 381 (2016) 90-95.
13. Wang, H., et al., Superlattice supertoughness of TiN/MN (M=V, Nb, Ta, Mo, and W): First-principles study. Thin Solid Films, 607 (2016) 59-66.
14. Maksakova, O.V., et al., Multilayered ZrN/CrN coatings with enhanced thermal and mechanical properties. Journal of Alloys and Compounds, 776 (2019) 679-690.
15. Koutná, N., et al., Correlating structural and mechanical properties of AlN/TiN superlattice films. Scripta Materialia, 165 (2019) 159-163.
16. Xu, Y.X., et al., Effect of the modulation ratio on the interface structure of TiAlN/TiN and TiAlN/ZrN multilayers: First-principles and experimental investigations. Acta Materialia, 130 (2017) 281-288.
17. Ivashchenko, V.I., et al., First-principles molecular dynamics investigation of thermal and mechanical stability of the TiN(001)/AlN and ZrN(001)/AlN
heterostructures. Thin Solid Films, 564(2014) 284-293.
18. Le Guen, K., et al., Introduction of Zr in nanometric periodic Mg/Co multilayers. Applied Physics A, 102(1) (2010) 69-77.
19. Maury, H., et al., Analysis of a B4C/Mo/Si multilayer interferential mirror by SIMS: influence of the sputtering ion. Surface and Interface Analysis, 38(4) (2006) 781-783.
20. da Silva-Oliveira, C.I., et al., Thermal stability of Zr-O-N(:Ti) thin films prepared by magnetron sputtering. Vacuum, 151 (2018)148-155.
21. Hsiao, H.-W., J.-H. Huang, and G.-P. Yu, Effect of oxygen on fracture toughness of Zr(N,O) hard coatings. Surface and Coatings Technology, 304 (2016) 330-339.
22. Huang, J.-H., T.-C. Lin, and G.-P. Yu, Phase transition and mechanical properties of ZrNxOy thin films on AISI 304 stainless steel. Surface and Coatings Technology, 206(1) (2011) 107-116.
23. Dinu, M., et al., Enhancement of the Corrosion Resistance of 304 Stainless Steel by Cr-N and Cr(N,O) Coatings. Coatings, 8(4)(2018) 20.
24. Castaldi, L., et al., Effect of the oxygen content on the structure, morphology and oxidation resistance of Cr–O–N coatings. Surface and Coatings Technology, 203(5-7) (2008) 545-549.
25. Wilhartitz, P., S. Dreer, and P. Ramminger, Can oxygen stabilize chromium nitride?—Characterization of high temperature cycled chromium oxynitride. Thin Solid Films, 447-448 (2004) 289-295.
26. Chu, X. and S.A. Barnett, Model of superlattice yield stress and hardness enhancements. Journal of Applied Physics, 77(9) (1995) 4403-4411.
27. Chen, J.G., EXAFS STUDY of transitional metal nitrides, oxides, sulfides. Surface Science Reports, 30(1995) 1-152.
28. Braic, M., et al., TiN/ZrN heterostructures deposition and characterisation. Surface and Coatings Technology, 200(22) (2006) 6505-6510.
29. Lin, S., et al., Structural, mechanical, and sand erosion properties of TiN/Zr/ZrN multilayer coatings. Vacuum, 122(2015) 179-186.
30. Yalamanchili, K., et al., Growth and thermal stability of TiN/ZrAlN: Effect of internal interfaces. Acta Materialia, 121(2016) 396-406.
31. Pogrebnjak, A.D., et al., Experimental and theoretical studies of the physicochemical and mechanical properties of multi-layered TiN/SiC films: Temperature effects on the nanocomposite structure. Composites Part B: Engineering, 142(2018) 85-94.
32. Pogrebnjak, A.D., et al., Antibacterial Effect of Au Implantation in Ductile Nanocomposite Multilayer (TiAlSiY)N/CrN Coatings. ACS Applied Materials & Interfaces, 11(51)(2019) 48540-48550.
33. Minami, T., S. Nishio, and Y. Murata, Periodic microstructures of Cr–O–N coatings deposited by arc ion plating. Surface and Coatings Technology, 254(2014) 402-409.
34. Selvakumar, N., et al., Spectrally selective CrMoN/CrON tandem absorber for mid-temperature solar thermal applications. Solar Energy Materials and Solar
21 Cells, 109(2013) 97-103.
35. Li, W.Z., et al., Effects of the constitution of CrON diffusion barrier on the oxidation resistance and interfacial fracture of duplex coating system. Journal of Alloys and Compounds, 518(2012) 86-95.
36. Arvinte, R., et al., Preparation and characterization of CrNxOy thin films: The effect of composition and structural features on the electrical behavior. Applied Surface Science, 257(21)(2011) 9120-9124.
37. Pogrebnjak, A., et al., Multilayered vacuum-arc nanocomposite TiN/ZrN coatings before and after annealing: Structure, properties, first-principles calculations. Materials Characterization, 134(2017) 55-63.
38. Pradhaban, G., et al., Nanomechanical properties of TiN/ZrN multilayers prepared by pulsed laser deposition. Materials Today: Proceedings, 3(6)(2016): 1627-1632.
39. Yuan, Y., et al., Interface observation of heat-treated Co/Mo2C multilayers. Applied Surface Science, 331(2015) 8-16.
40. Nannarone, S., The BEAR Beamline at Elettra, in AIP Conference Proceedings. (2004) 450-453.
41. Jonnard, P., et al., Study of the Au-Cr bilayer system using X-ray reflectivity, GDOES, and ToF-SIMS. Surface and Interface Analysis, 50(11) (2018) 1213-1217.
42. Kumar, S., et al., Electronic structure and magnetic properties of Co doped TiO2 thin films using X-ray absorption spectroscopy. Ceramics International, 41(2015) S370-S375.