ALTERNATIVE METHODS FOR BIOMASS COMBUSTION
CONTROL
Michel, J.-B(1) 1, Onillon E. (2) Koechli D. (3)
(1) Geneva Institute of Technology, University of Applied Sciences of Western Switzerland
(2) Swiss Center for Electronics and Microtechnology, Neuchâtel, Switzerland (3) Müller AG Holzfeuerungen, Switzerland
ABSTRACT
The purpose of this paper is to examine alternative methods to improve the control of combustion in industrial moving grate biomass boilers. A review of existing and recently developed methods is presented, especially new gas sensors for CO and unburnt hydrocarbons. The development of a new passive optical method and first results obtained on industrial wood-burning boilers are shown.
It is expected that these new types of sensors which are significantly cheaper than existing Lambda sensors will be increasingly used on biomass burning boilers.
Keywords: biomass, combustion control, boilers, sensors, optical, signal processing. BACKGROUND
Renewable energy sources, in particular biomass, are an attractive option to diversify the EU’s energy supply: renewable sources are available locally, they bring environment benefits and they contribute to employment and the competitiveness of the European industry. Technologies are still developing and can make these sources increasingly profitable.
In recent memos and papers [ 1 ]- [ 4 ] the European Commission reports on the share of renewable sources in the energy balance of the EU Member States. The targets set in the Renewables Directive 2001/77/EC1 for 2010 were [ 3 ]:
• To double the share of renewable energy in national gross energy consumption from 6% to 12% (including heating, electricity and transport),
• To increase the share of green electricity in total electricity consumption from 13% to 21%
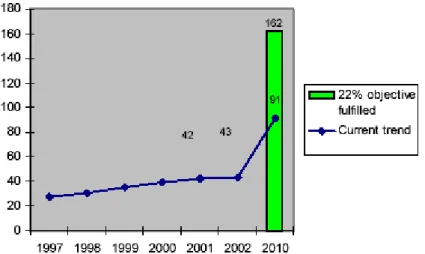
The 21% target for electricity includes a 22% target for biomass. Despite a lot of efforts it is unlikely that this target will be met for electricity: this would require biomass electricity to grow by 18% a year – compared with a rate of only 7% a year over the past 7 years, see Figure 1.
Similarly, biomass for heat production (domestic and industrial) was expected to contribute to about 66 Mtoe in 2010 compared to 43 Mtoe in 2002 and this is also unlikely to be achieved.
The main conclusion of the commission report [ 4 ] was that fulfilment of the 12% RES target for 2010 will require a step change in national policies towards the use of
Figure 1 - Estimation of the Biomass
renewable energy in heating.
electricity trend and comparison with the 22% objective (TWh)
ific
ess air along the various combustion zones, is very complex and
TATE OF THE ART OF EXCESS-AIR CONTROL SENSORS
using in-situ
flue-ed on catalytic car exhaust for e-gas oxygen monitoring systems for industrial boilers, based on Therefore, in order to contribute to this ambitious goal, the technical and scient community must find better solutions to produce heat and electricity from biomass at an attractive price. In this context, one of the main technical problems to overcome is the great variability of the biomass in terms of moisture, size distribution and composition, making it difficult to control and optimise the combustion. This is especially the case for smaller installations (in the MW range), which have only limited instrumentation. Due to these reasons, combustion of wood on a grate is usually done with high excess air and at relatively low temperature compared to fossil fuels, causing a lower overall thermal efficiency of the boilers (generally 75-80% instead of 90-95%). This also results in higher pollutant emissions in the form of unburnt hydrocarbons and fine particulate matter.
The control of exc
rather poorly achieved due to the lack of reliable and low cost indicators of excess air levels. Furthermore, in the case of wood chips or bark, feeding onto the grid is intermittent, causing a periodic fluctuation of the wood bed which is normally not compensated by air-flow adjustments.
S
Existing systems for excess air control in biomass burning boilers are
gas probes with solid-state zirconia electrolyte. They produce a potential difference (or a current for the amperometric type probe) which is related to the oxygen concentration difference on both side of the electrolyte (Nernst law).
Lambda sensors using the same principle are also us air/fuel ratio control.
The cost of existing flu
Lambda sensors, is in the range of 1000 to 2000 Euros. Such a high cost comes from the high constraints in terms of life-time, resistance to dust and corrosion, and temperature compensation. The sensors are kept at a surface temperature of about 800°C and are known to be very reliable for gas and oil fired applications.
It is worth noting that Zirconia based sensor can also be used to monitor simultaneously CO and unburnt hydrocarbons as well as O2. The instrument developed by the company
Lamtec [ 6 ] is achieving this.
However, the high cost of such sensors prevents their use for smaller industrial boilers. Other known flue-gas measurement systems (e.g. NDIR analysers) are all more expensive than the Lambda probes.
For smaller industrial boilers and for domestic boilers, recent developments of other types of flue-gas sensors have taken place:
- A non-nertzian zirconia electrolyte sensor, so-called “CarboSEN 1000”. It is a miniaturized sensor for detecting unburned (CO/H2) in flue-gases. It is
produced by the company Escube (D) [ 6 ]
- A semi-conducting gallium oxide (Ga2O3) thin film sensor from the company
Steinel (CH) [ 7 ]. This sensor is produced in large numbers and is used in commercial domestic gas boilers.
Tests of such sensors have been reported by the Swedish National Testing and Research Institute [ 8 ], [ 9 ] . Tests were made on domestic pellet boilers, showing good results in terms of accuracy of the measurements. However the authors recommended that in-situ gas sensors probably require filters to improve their lifetime. They also concluded that “both tested sensors can be used together with an oxygen sensor in a lambda optimised control system” and that “a pellet burner with a lambda optimised control system is insensitive to variations in fuel qualities and fuel load, which leads to higher efficiency and lower emissions of CO”.
However, flue-gas sensors require periodic maintenance and are unable to provide a direct indication of what is happening in the flame zones on their own.
The sensors required for the control of biomass burning boilers should have the following characteristics:
- Give a reliable indication of overall excess oxygen in the flame.
- Give a reliable indication of incomplete combustion (CO, unburnt hydrocarbons) that can occur even in case of excess oxygen.
- Be relatively cheap (less or equal 1 Euro per kW as a rule of thumb)
- Provide a way to regulate the primary air flow through the fuel bed in the case of fixed or moving grate boilers. This is usually not done as the primary air flow is fixed in most cases.
- Provide a way to regulate the distribution of air flow along the grate in the case of a moving grate. Such a distribution is set empirically and fixed.
- Require no or very low maintenance. - Have a lifetime of more than 10 years.
The four last requirements are currently not met by the flue-gas sensors previously reviewed.
Meeting those needs at a low cost is the purpose of the new method which is currently under development at the Geneva Institute of Technology and described in the following.
PRINCIPLE OF THE PASSIVE OPTICAL METHOD
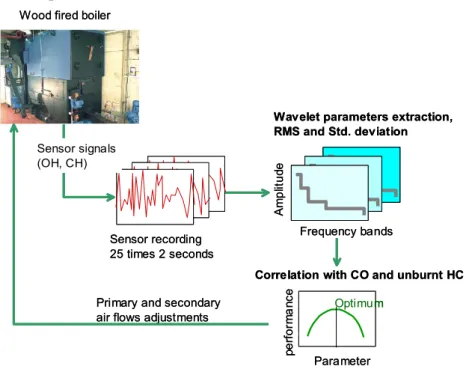
This method is based on the so-called “flame signature” principle already proven on gas and oil fired burners [ 5 ]. The sensing method uses an innovative processing of the signals from the existing flame detector on the burner. The basic idea is to use the
fluctuating component of the global UV and/or IR radiation, produced during combustion, as an indicator for air/fuel mixing and in particular for excess air. Its principle is described in Figure 2.
In the case of oil/gas burners, a single photodiode was used to measure the UV or IR radiation. For wood flames, two flame sensors will be used in order to record and process simultaneously two ranges of wavelengths from the flame: one which contains the OH radical emissions (several peaks from 305 to 320 nm) and another which contains the CH emissions (main peak at 432 nm). The objective is to get a combustion indicator for the overall degree of oxidation within the flame region including the unburnt hydrocarbons.
For moving grate boilers, several sensors can be placed on the sides so that they provide an indication of local fuel/air ratio across the grate.
The feasibility of this approach has already been demonstrated extensively on oil and gas fired burners of all types, ranging from 300 kW to 18 MW nominal load. In particular, it has been shown that the flame signature obtained with the wavelet transform in the frequency range 0-1500 Hz is correlated to the excess air in the combustion zone. The sensor was able to detect variations of excess air of +/-4% corresponding to +/- 0.5% vol. O2 in the flue-gas. Details of the sensor are given below.
This was obtained with a single sensor but with two sensors, the signal processing technique will be similar.
Sensor recording 25 times 2 seconds
Primary and secondary air flows adjustments
Correlation with CO and unburnt HC
Parameter pe rf o rm a nc e Optimum A m pl it ud e Frequency bands
Wavelet parameters extraction, RMS and Std. deviation
Sensor signals (OH, CH) Wood fired boiler
Sensor recording 25 times 2 seconds
Primary and secondary air flows adjustments
Correlation with CO and unburnt HC
Parameter pe rf o rm a nc e Optimum A m pl it ud e Frequency bands
Wavelet parameters extraction, RMS and Std. deviation
Sensor signals (OH, CH) Wood fired boiler
Figure 2 – Principle of the flame signature sensor
Sensor operation
A photograph of the first sensor used and its electronics is shown in Figure 3. In the test version, the signal is amplified with a two stage-amplifier allowing to split the DC and AC parts. The DC part provides a normal flame detector whereas the AC of the signal is sampled and analysed in a separate box, using the wavelet transform. Nine frequency bands are used for this transformation with a dyadic scale. In the case of gas/oil flames the frequencies were in the range 3-1500 Hz. A dyadic filter bank (Daubechies wavelets) is used for the implementation of the algorithm on a commercial low-cost microprocessor.
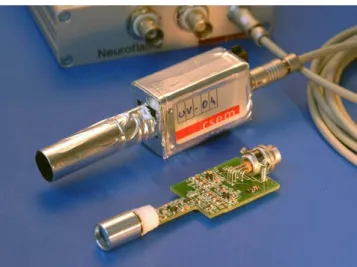
Figure 3 – Photograph of the flame signature sensor (by courtesy of CSEM)
This produces a so-called “wavelet flame signature” which was found very effective to characterize the air-fuel ratio in gas and oil diffusion flame. This is explained by the implicit relation that exists between the distribution of turbulent flame eddies and the global air-fuel ratio: the sensor measures the light emitted by all the turbulent eddies within its field of view. The measured wavelet spectrum should be correlated to the overall turbulence spectrum and therefore to the global air-fuel ratio.
However the relation between wavelet spectrum and air-fuel ratio is very complex and depends upon many other factors such as furnace/burner type, fuel type, load, sensor position etc. To avoid a lengthy calibration of the sensor, an automatic start-up and calibration procedure was established and implemented in the embedded signal processor. This is described below.
Learning/calibration mode in the case of gas/oil fired boilers
At start-up, the system acquires 100 times 5s of signal at 3 kHz, and for each acquisition, the wavelet transformation algorithm is applied, producing nine coefficients corresponding to the energy of the associated frequency band.
The measured matrix, formed of 100 vectors of nine coefficients, is used to calculate the system covariance matrix and the 9 mean values. The norm of the covariance matrix also characterises the measurement quality. The higher the norm is, the worst the quality is, giving therefore a very useful information, related to the signal/noise ratio.
Normal running mode
As soon as the calibration is ended the signal is acquired at 3kHz and the wavelet transformation algorithm is applied in the same way as for the calibration, producing the nine coefficients. The coefficients are used to calculate a distance representing how far the combustion is from nominal conditions. The distance is the Mahalanobis distance, given by )' ( * ) ( µ µ − − = X Covmat X D
Frequency bands 1 2 3 4 5 6 7 8 9 W a v e le t co e ff ic ie n ts (a rb it ra ry u n its ) calibration curve +/- 2 std. dev. + + + + + + + + + Instant measurement Frequency bands 1 2 3 4 5 6 7 8 9 W a v e le t co e ff ic ie n ts (a rb it ra ry u n its ) Frequency bands 1 2 3 4 5 6 7 8 9 W a v e le t co e ff ic ie n ts (a rb it ra ry u n its ) 1 2 3 4 5 6 7 8 9 1 2 3 4 5 6 7 8 9 1 2 3 4 5 6 7 8 9 W a v e le t co e ff ic ie n ts (a rb it ra ry u n its ) calibration curve +/- 2 std. dev. calibration curve +/- 2 std. dev. + + + + + + + + + Instant measurement + + + + + + + + + + + + + + + + + + + + + + + + + + + Instant measurement
Figure 4 – Definition of the wavelet spectrum distance
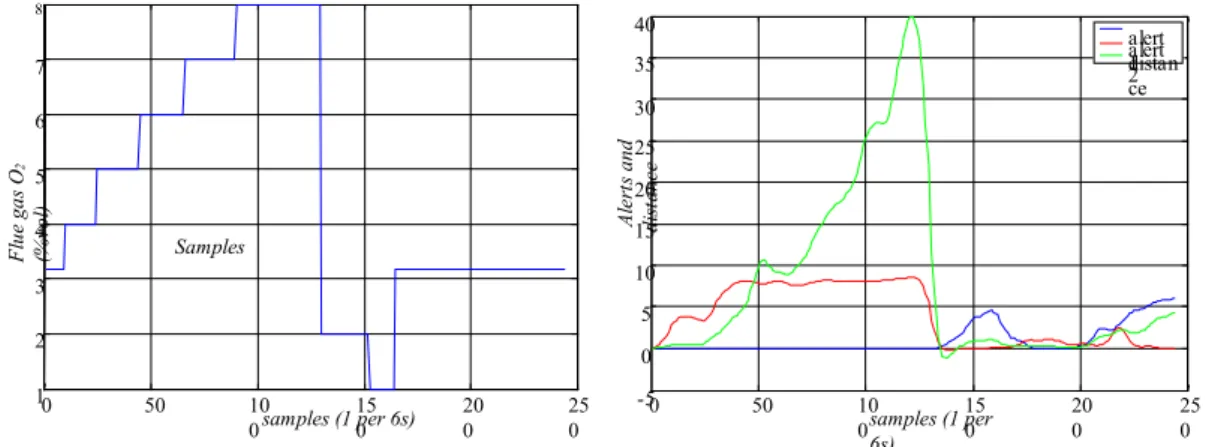
where X is the vector composed of the 9 wavelet coefficients, µ is the vector of the 9 coefficients from the learning phase (mean value), Covmat is the covariance matrix. An example of result obtained with a forced draught gas burner is shown in Figure 5. The excess air was varied by steps and the oxygen concentration in the flue-gas was measured at the same time as the distance. It can be seen that this distance is directly linked to the oxygen value.
The sensor also provides alerts if (X-µ) is greater or lesser than twice the standard deviation obtained during the learning phase. The sum of the alerts for the nine frequency bands is represented in Figure 5.
0 50 10 0 150 200 250 -5 0 5 10 15 20 25 30 35 40 samples (1 per 6s) A ler ts a nd di st an ce alert 1 alert 2 distan ce 8 Fl ue g as O2 (% vo l) Samples 0 50 10 0 150 200 250 1 2 3 4 5 6 7 samples (1 per 6s)
Figure 5 – Example of sensor response to step changes in excess air for a forced-draught diffusion burner, 180 kW (trained for 15% excess air).
A very interesting feature of the method is its inherent reliability and repeatability. It was found that even after a prolonged stop of the burner or after several months of operation, the flame signature obtained is quite identical, with variations that are within the normal statistical deviation. This makes this sensor an ideal candidate for preventive maintenance of small to medium scale burners that are not continuously supervised by an operator.
FIRST RESULTS ON WOOD-BURNING BOILERS
Testing on wood-burning boilers of the new method is still on-going and first results were obtained on three different wood-boilers:
1. A travelling grate boiler, of about 2 MW, fed with wood wastes and saw dust 2. An under-fire fixed grate boiler, 200 kW, vulcan type, fed with wood chips and
saw dust
3. A movable horizontal grate boiler of 1 MW, fed with wood chips and tree roots. A single sensor was used in all three cases, mounted on the rear wall, looking horizontally through the flame as shown on Figure 6. A commercially available photodiode with spectral response in the range 190-550 nm and an active surface of 5.2 mm2 was used.
In the last two cases, the load, the excess air and the flue-gas residual oxygen were recorded simultaneously with the sensor response.
Heat exchanger Boiler door Post-combustion
Secondary and primary air inlets
Moving grate Sensor
Ash extraction
Wood feeding system
Figure 6 – Boiler schematic for case 3, 1 MW boiler
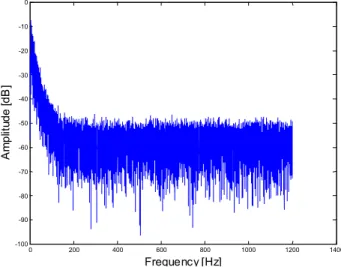
0 200 400 600 800 1000 1200 1400 -100 -90 -80 -70 -60 -50 -40 -30 -20 -10 0 Frequency [Hz] A m pl it ud e [ d B ]
The first observation was that the flame radiation fluctuations are one order of magnitude slower in the case of these flames than for forced-drought diffusion flames, i.e. with highest frequencies in the 50 to 200 Hz instead of 500-1500 Hz, see Figure 7. This is due to the lower gas velocities, which are about one order of magnitude smaller. Similar results were obtained on boilers 1 and 2. For the same reason as before highest frequencies were also found to increase with the boiler load.
The second observation was that the global emissions from wood flames in the 190-550 nm range are greater than those of gas or oil flames: the amplification circuit was initially saturating even with lowest load operation (30% of maximum) on the three boilers and the gain was reduced to avoid the saturation. This probably arises from two different reasons: the greater number of “flame fronts” were OH radicals are formed, over the full length of the grate, the more kinetically controlled combustion, with higher local OH radical concentrations, and the greater field of view of the sensor (in the case of gas/oil flames, the sensor was placed inside the burner and could only see a tiny portion of the flame).
These two observations are very beneficial for the use of UV/visible sensors: the amplification gain can be greatly reduced thus the signal/noise ratio will be much greater.
On the contrary, the IR emissions from the wood flames was too low to give any signal on the IR sensors used for gas/oil flames, even with a greater gain (10X). As a matter of fact, this is quite normal by virtue of the Stefan-Boltzmann radiation law : peak flame temperatures are of about 1270 K compared to 2070 K, so peak IR radiation is 7 times lower. As the sensor measures the radiation fluctuations relative to average, one can understand that the signal was too weak to be measured.
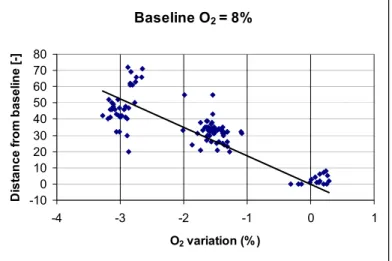
The effect of excess air on the UV/visible sensor response could be assessed on boiler No. 2, used as an experimental boiler by Mueller Holzfeurungen (Balsthal, CH). The boiler was operating at 30% load and the baseline O2 was set at 8% vol. Simultaneous
recording of O2 and the UV signal was done at a sampling rate of 250 Hz.
Baseline O2 = 8% -10 0 10 20 30 40 50 60 70 80 -4 -3 -2 -1 0 1 O2 variation (%) D ist a n ce f rom basel in e [ -]
Figure 8 - Wavelet distance as a function of flue-gas oxygen with decreasing excess air
Data averaging was done every 20 second interval providing the values of the wavelet
signature parameters and the distance compared to the baseline signature. The O2
set-point was varied by steps of 1.5% vol. every 10 minute interval, first by decreasing it then by increasing. Unfortunately, for technical reasons, the baseline signature could not be kept exactly the same for both cases. Results are shown in Figure 9 and Figure 9.
Baseline O2 = 8% 0 100 200 300 400 500 600 700 800 -1 0 1 2 3 4 5 O2 variation (% ) D ist anc e f rom bas e line [ -] 6
Figure 9 – Wavelet distance as a function of flue-gas oxygen with increasing excess air
The correlation is found to be quite linear for O2 variations of less than 3% vol. and then
it becomes of the second order. This is in agreement with what was observed for gas
and oil flames. However the correlation degree is not so good (R2=0.64 and 0.8) which
can be explained by the rather large variations of O2 in normal operation: changes of
+/-2% compared to the nominal value were monitored during a 10 minute run. In particular, changes due to the intermittency of the wood supply on the grid were clearly visible on the signal.
This highlights the difficulties inherent to wood combustion testing. For control purpose, this shows that averaging for about 10 minute periods will be necessary.
Further tests will be necessary to investigate thoroughly the combined effect of excess air and biomass composition changes, especially those of moisture content and calorific value.
CONCLUSIONS
The cost of existing flue-gas oxygen monitoring systems for industrial boilers, based on Lambda sensors, is in the range of 1000 to 2000 Euros. These can only be afforded for the larger boilers above 1 MW.
New sensors are now available which offer interesting perspective for the control of air/fuel ratio on smaller boilers, in particular biomass fired boilers were such controls are very useful to increase the combustion and thermal efficiency and to reduce the overall pollutant emissions: CO/HC and particulate emissions.
A non-nertzian solid electrolyte flue gas sensor using thin zirconia layer offers a promising alternative for the continuous measurement of CO and unburnt hydrocarbons.
Similarly, a new sensor using a semi-conducting Ga2O3 layer has already been
introduced on the market for gas/oil burner applications. This sensor allows to monitor CO and unburnt hydrocarbons and would thus be very useful on wood burning boilers. Results of other investigators on pellet burners are very encouraging in this respect. The new passive optical sensor and its electronics described, produced in medium series, will cost in the order de 200 Euros. According to our industrial partners, this cost
is very realistic for medium size boilers (around 1 MWth), especially when the sensor
reliability of operation, and a higher overall thermal efficiency. However extensive testing will be required, with a dual sensor system, to assess the reliability of the air/fuel ratio indication with the variation of biomass composition.
ACKNOWLEDGEMENTS
The authors gratefully acknowledge the financial and technical support of the CREED (the center for environment, energy and waste research) - Veolia Environnement's research center based in Limay (France) and of the City of Geneva in providing access to their 1MW wood-burning boiler for the experimental work.
REFERENCES
[ 1 ] European Commission memo: “How to support renewable electricity in Europe? An assessment of the different support schemes”, Directorate-General for Energy and Transport, Dec. 2005
[ 2 ] European Commission memo: “Renewable energy to take off in Europe? 2004 – overview and scenario for the future”, Directorate-General for Energy and Transport, May 2004
[ 3 ] Directive 2001/77/EC of 27 September 2001 on the promotion of electricity produced from renewable energies sources in the internal electricity market. J.O. 27.10.2001, L 283/33. Date for the implementation of this Directive was October 2003 and for the new Member States, 1 May 2004. [ 4 ] communication from the commission to the council and the European parliament: “The share of
renewable energy in the EU, Brussels, 26.5.2004, COM(2004) 366 final
[ 5 ] J.-B. Michel, R. Gentsch, E. Grenet, F. Heitger, E. Onillon, C. Verjus – “Low cost sensors and methods for combustion control». Seventh International Conference on Technologies and Combustion for a Clean Environment, Lisbon, July 2003.
[ 6 ] H. Weber – “CO Control The better alternative of O2 control for gas-fired furnaces”, Gaswärme International, No. 07 / 2003, pages 448 - 450
[ 7 ] U. Hoefer, “Abgassensoren zur Verbrennungsregelung von Kleinfeurungsanlagen”, Technische Messen 72 (2005)
[ 8 ] D. Eskilsson, H. Quicklund, C. Tullin, “utilisation of novel gas sensors for combustion optimisation of pellet burners”, 2nd World Conference on Biomass for Energy, Industry and Climate Protection, 10-14 May 2004, Rome, Italy
[ 9 ] David Eskilsson, Marie Rönnbäck, Jessica Samuelsson, Claes Tullin, “Optimisation of efficiency and emissions in pellet burners”, Biomass and Bioenergy 27 (2004) 541–546
Web links for further reference:
Lamtec: www.lamtec.de/ Steinel: www.steinel.ch Escube: www.escube.de Mueller: www.mueller-holzfeuerungen.ch CSEM: www.csem.ch Veolia: http://www.veoliaenvironnement.com/en/group/research/creed/