HAL Id: hal-00850625
https://hal.archives-ouvertes.fr/hal-00850625
Submitted on 7 Aug 2013
HAL is a multi-disciplinary open access
archive for the deposit and dissemination of
sci-entific research documents, whether they are
pub-lished or not. The documents may come from
teaching and research institutions in France or
L’archive ouverte pluridisciplinaire HAL, est
destinée au dépôt et à la diffusion de documents
scientifiques de niveau recherche, publiés ou non,
émanant des établissements d’enseignement et de
recherche français ou étrangers, des laboratoires
Use of inverse method for bonding quality assessment
between bitumen and aggregates under asphalt mixes
manufacturing conditions
Sâannibè Ciryle Some, Vincent Gaudefroy, Didier Delaunay
To cite this version:
Sâannibè Ciryle Some, Vincent Gaudefroy, Didier Delaunay. Use of inverse method for bonding
quality assessment between bitumen and aggregates under asphalt mixes manufacturing conditions.
Proceedings of the 11th Biennal Conference on Engineering Systems Design and Analysis, TRK 8, Jul
2012, France. 9p. �hal-00850625�
Proceedings of the 11th Biennial Conference on Engineering Systems Design and Analysis TRK 8 July 2-4, 2012, Nantes, Loire-Atlantique, France
ESDA 2012 -82361
USE OF INVERSE METHOD FOR BONDING QUALITY ASSESSMENT BETWEEN
BITUMEN AND AGGREGATES UNDER ASPHALT MIXES MANUFACTURING
CONDITIONS
Sâannibè-Ciryle SoméLUNAM Institut Français des Sciences et Technologies des Transports, de l’Aménagement
et des Réseaux (IFSTTAR), Route de Bouaye CS4, 44344 Bouguenais Cedex, France
Vincent Gaudefroy
LUNAM Institut Français des Sciences et Technologies des Transports, de l’Aménagement
et des Réseaux (IFSTTAR), Route de Bouaye CS4, 44344 Bouguenais Cedex, France
Didier Delaunay
Laboratoire de Thermocinétique
de l’École Polytechnique de l’Université de Nantes, UMR CNRS 6607 Rue Christian Pauc,
BP 50609 44306 Nantes cedex, France
ABSTRACT
In roads building, classical asphalt mix manufacturing commonly requires the heating (at 160°C) and the complete drying of aggregates. The induced energy cost has opened the way to develop alternatives processes and materials with low energy/carbon materials such as Warm Mix Asphalt (WMA). In warm mixes processes, aggregates manufacturing temperatures are different and lower than the Hot Mix ones. However, manufacturing temperature reduction can locally lead to poor bonding between bitumen and aggregate during the mixing step, due to the bitumen viscosity increasing, although bonding quality measurement remained a challenge. The aim of our study was to presents two thermal inverse methods for bonding quality assessment. These methods are based on Thermal Contact Resistance (TCR) assessment between bitumen and aggregate, during asphalt mix manufacturing. The experimental test principle consisted of heating both bitumen and cylindrical aggregate to their manufacturing temperatures (over 100°C) and to put them into contact thanks to a special experimental device. According to initial samples temperatures, heat transfer occurs from the bitumen to the aggregate. Two variants of the sequential Beck’s method were used to solve the inverse heat conduction problem. The first one consisted of determining the TCR from heat flux and temperatures and the second one
consisted of identifying directly the TCR. The TCR values were interpreted as bonding quality criteria.
Results showed low sensitivity to temperature measurement noise in the second variant of the inverse method. Moreover our study showed that bonding quality depends on bitumen and aggregate temperatures. The higher the component’s temperatures, the lower the TCR values and better is the bonding quality.
INTRODUCTION
In roads building, classical asphalt mix manufacturing commonly requires the heating (at 160°C) and the complete drying of aggregates. This operation induces high energy consumption. In the last decade roads companies have developed new processes based on fuel consumption reduction. In these processes coarses aggregates temperatures can be reduced significantly [1-3]. The component’s temperatures reduction induces bitumen viscosity increases. However, the effect of this high viscosity on the bonding property between bitumen and aggregates are not well known. In the manufacturing step, hot liquid bitumen comes into contact with hot or warm aggregates. This leads to bonding between the bitumen and aggregates. The influence of bitumen and aggregates temperatures on the bonding quality has not been studied yet at manufacturing conditions. However, some studies
have been carried out at room temperature on cool material manufacture at high temperatures.
Conestrari et al [4] have studied the adhesion/cohesion properties of bitumen-aggregate system and the effect of moisture damage by using mechanical pull-off tests. Varying the temperature of the aggregate surface between 90 and 135°C was expected to influence the adhesion between bitumen and aggregate, and moisture susceptibility. A higher surface temperature should result in higher adhesion values since the lower bitumen viscosity allows better bonding, which should lead to lower sensitivity to water damage. This hypothesis was tested with two types of aggregate (porphyry and limestone). These tests were conducted at room temperature (25°C and 40°C) and some specimens conditioned with immersion. Their studies showed that surface temperature effects were negligible for both aggregate types at 40°C and not negligible in other cases. The difficulties of these tests are the fact that the results are very scattered and need statistical ANOVA treatment to be well understood.
Vasconcelos et al [5] have characterized the adhesion between bitumen and aggregate at different aggregate temperatures by measuring the total energy of adhesion (TEA) using DSC apparatus. Two vials were used, one empty (reference) and the other with 8g of aggregate (sample) consisting of sand of 1.15mm maximum diameter. The aggregates were treated at four different temperatures (90, 110, 130 and 150°C). Bitumen solutions were prepared using 1.5g of bitumen dissolved in 11mL of HPLC grade toluene because the binder in a toluene solution does not compromise the physico-chemical characteristics of the bitumen. Moreover bitumen molecules in a toluene solution have similar kinetics to those of molecules in liquid bitumen at elevated temperatures. This process avoids bitumen heating. The cells were allowed to reach thermal equilibrium. Equilibrium was confirmed as the point when the heat flow ceased to change over time. After reaching thermal equilibrium, the asphalt binder solution was injected with syringes into the vials. The asphalt binder molecules preferentially adhere to the aggregate surface reducing the total energy of the system and producing heat. The heat flow from the reaction cell was recorded over time and the system was allowed to return to thermal equilibrium. The area under the heat flow curve over time was integrated to obtain the TEA. Their results showed that for the non-porous aggregates used, lower aggregate pretreatment temperatures (within the range of 90°C to 150°C) did not significantly impact TEA.
Le Goff et al [6] have investigated the heat transfer that occurs during the solidification of semi-crystalline polymer on a mold surface. On the microscopic scale, the mold surface is not completely smooth and consists of small asperities production from the surface profile. When liquid polymer approaches the mold surface, contact occurs at the peaks of asperities. Rapid cooling at these peaks induces solidification of the polymer to nucleate from these sites. Indeed, it is a location where heat flux density is maximum. They showed that the diameter of the crystallized area increased. The increase of the air gap volume due to the shrinkage during crystallization
increases the Thermal Contact Resistance (TCR). When crystallization is complete, the thermal contact resistance continues to grow at a smaller rate. Just after the contact, its value is relatively high and it decreases to reach a minimum. This decrease is due to the evacuation of the air layer which is trapped in the surface roughness. It takes some time to be evacuated. This principle is quite similar to what occurs during asphalt mixture manufacturing when hot bitumen comes into contact with hot aggregates.
In our study the experimental device used in reference [6] was modified to put hot bitumen into contact with a hot or warm aggregate substrate. The aim of this study is to assess the TCR between both components. As in the case of many studies, [6-13] the interfacial thermal properties such as TCR, surface temperature or heat flux, assessment required inverse heat conduction problem solving. This paper deals with thermal contact resistance between bitumen and aggregate substrates in hot and warm asphalt mixture manufacturing conditions. This TCR was analyzed as a bonding quality indicator.
The sequential method widely described by Beck [16, 17] was used. Two variants of the sequential inverse method were performed to solve the inverse heat conduction problem. The first one consists of determining TCR from heat flux and component’s surface temperatures and the second variant consists of direct identification of the TCR.
All methods showed good agreement. However, the first method was more sensitive to the temperature data recorded noisy. Moreover, our study has shown that bonding quality depends on bitumen and aggregate temperatures. The higher the component’s temperatures, the lower the TCR values and better were the bond quality.
NOMENCLATURE
Cp specific heat capacity, Jkg-1K-1 E thermal effusivity
∆t time interval, s t time, s
r number of future time steps n, k time discretisation index m number of sensors x abscissa, m
l bitumen thickness, m
L distance between TC5 and TC4, m
∆x space interval, m
T average estimated temperature, °C S sensitivity coefficient
h inverse of TCR Wm-2K-1 J Residual function
Y measured temperature, Km²W-1
Ra arithmetic average of the absolute values of the measured profile height deviation, µm
TCi measured by sensor i
TCR thermal contact resistance Km²W-1
Greek symbols
λ thermal conductivity, Wm-1K-1
ϕ heat flux Wm-2
Subscripts
G,s granular substrate b bitumen
i,j space discretisation index
MATERIALS
Bitumen is a natural polymer of low molecular weight, and behaves as a viscoelastic material. Its microstructure is widely studied by DSC [18, 19]. It is rigid and brittle at low temperature, flexible at room temperature, and flows at high temperature. The bitumen used in this study has the following characteristics: pen grade 35/10 mm and softening point ring and ball temperature 53.6 °C. It has 8mm average thickness and 50 mm diameter.
The aggregate substrate (gneiss substrate) consisted of a cylinder cored with 52mm high and 70mm diameter from a block. Its base surface roughness was characterized by an optical profilometer. The arithmetic average of the absolute value of the measured profile height deviation (Ra) was 75µm. Four micro-thermocouples, constituted by wires of 80µm diameter, are placed in the aggregate along its vertical axis. For an accurate implementation of the wires and no disturbance of the heat flux, the substrate was cut along an axial symmetric plane, in two parts. On one of these parts and at different depths from the surface, each wire was soldered on its end on the centre line and placed in a thin parallel groove to the aggregate surface to minimize the heat drain. The exact positions of the sensor junctions with respect to the surface, given in Table 1, were measured by an optical profilometer before the two parts were precisely re-assembled. The first thermocouple which was the most important for the measurement sensitivity respected rather well the conditions described in reference [20].
TC1 TC2 TC3 TC4 Ra
+1.48mm +1.43mm +1.48mm +5mm 75µm Table 1: Roughness (Ra define in above paragraph) and thermocouples positions with respect to contact interface
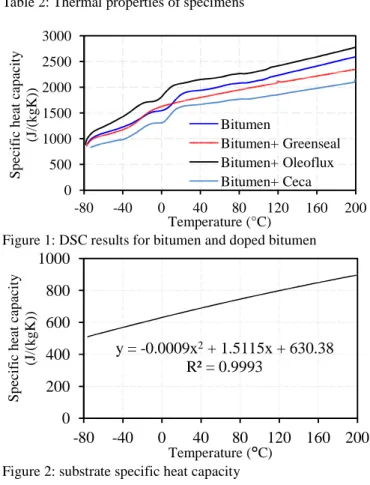
The aggregate and bitumen thermal conductivities were measured according to the guarded hot plate method. In the temperature range of interest 30°C to 160°C, we found a constant value of the thermal conductivity of these samples. The results are given in Table 2.
Differential scanning calorimeter (DSC) was used to investigate the thermal behavior of the specimens. Heating, as defined here, was heating of the samples at a moderated rate by the calorimeter, an average of about 10°C/min up from -80°C to 200°C. The region of interest is from 30°C to 160°C. In this temperature range, the heat capacity was approximated by quadratic polynomial. Fig. 1 and Fig. 2 show DSC results for bitumen, doped bitumen and substrate.
The specific volume was measured by the PvT-α apparatus described in reference [21]. The specific volume was assumed to be linear between 30°C and 160°C as found by the experimental result. The thermal properties are summarized in
Table 2. Apart from specific heat capacity, all other properties of bitumen and doped bitumen are similar.
Table 2: Thermal properties of specimens
Figure 1: DSC results for bitumen and doped bitumen
Figure 2: substrate specific heat capacity
EXPERIMENTAL METHODS
The purpose of this study is to investigate the bonding quality when hot bitumen is put into contact with hot or warm aggregate during the mixing operation of asphalt mix manufacturing. In the manufacturing of warm mixes [1-3], bitumen is generally heated to 160°C when aggregates are heated to a temperature range between 100°C and 150°C. This induced a low cooling rate of bitumen during the aggregates coating. The bitumen cooling leads to its viscosity increasing and can limit its penetration in the aggregates microcavities. The consequence of bad aggregate coating is water sensitivity of the pavement at room temperature. Water is known to delaminate the bitumen and aggregates interface. It is then
0 500 1000 1500 2000 2500 3000 -80 -40 0 40 80 120 160 200 S p ec if ic h ea t ca p ac it y (J /( k g K )) Temperature (°C) Bitumen Bitumen+ Greenseal Bitumen+ Oleoflux Bitumen+ Ceca
y = -0.0009x
2+ 1.5115x + 630.38
R² = 0.9993
0
200
400
600
800
1000
-80
-40
0
40
80
120
160
200
S p ec if ic h ea t ca p ac it y (J /( k g K )) Temperature (1C)Thermal properties Aggregate Pur bitumen Thermal conductivity (Wm -1K-1) 2.59 0.199 Specific heat capacity (Jkg-1°K-1)
( )
37 . 630 512 . 1 ² 10 9 4 + + × − = − T T T Cpg( )
7 . 1834 441 . 2 ² 10 1 . 7 3 + + × = − T T T Cpb Specific volume (m3/kg)( )
4 9 10 4 10 5× − + × − = T T g υ ( )T =4×10⁻⁷T+9×10⁻⁴ b υmore important to ensure good bonding bet and aggregates during mixing operations at hi However, till now, no experiment bonding quality during manufacturing step. study we performed here allowed to study the manufacturing step.
Fisrt of all, the granular substrate previously was insulated and fixed to plate P 3 and Fig 4. This plate was equipped with a system. Then, the top side of the granular sub the plate P0. Plate P1 is placed at the subs upper side of this plate P1 contains the same system as plate P0. This allows heating of the substrate to ensure uniform tempera substrate sample. The bottom side of plate P a heater that allows heating of the upper side temperature (T2). A plate P2 located at t bitumen sample, and equipped with hea bitumen bottom side heating and achieves un T2. The bitumen sample was placed previous ring. When all temperatures are uniform in plate P1 is removed and the granular substra into contact with the hot bitumen samp establishment, the heat flux flows through better thermal contact leads to an important through the interface. The bitumen inte decreases whereas the substrate interface tem Because of the imperfect contact due to the a roughness of the substrate and the heat flu bitumen interface temperature is different interface temperature. We can then define th resistance as the temperature gap at the inter flux at the interface. A small value of TCR m between bitumen and aggregate.
All the experimental tests were carri following conditions: holding pressure: temperature: always higher than substrat asphalt manufacturing conditions, contact dur
Figure 3: Schematic view of the experimen contact establishment
between the bitumen t high temperature. t has measured the
. The experimental bonding quality in e sample described e P0 as shown in Fig. a hot oil circulating substrate is heated by ubstrate bottom. The me hot oil circulation f the bottom side of erature (T1) in the P1 is equipped with ide of the bitumen to t the bottom of the heaters, ensures the uniform temperature ously in an elastomer in each sample, the strate is suddenly put mple. After contact ugh the interface. A ant heat flux flowing nterface temperature emperature increases. e air trapped into the flux constriction, the ent to the substrate e the thermal contact terface over the heat means good contact arried out using the : 5 bars, bitumen rate temperature in duration : 60s.
ental system before
Figure 4: Schematic view contact establishment
DIRECT PROBLEM FOR
The samples were temperatures. Afterwards, th contact with the hot bitume measured by the sensors lo bitumen bottom. The sur assessment lead to a nonline (IHCP) due to the variatio temperature shown in tabl unknowns interfacial temp interfacial heat flux ϕ(t) following mathematical for the bitumen and substrate TC4.
The boundaries conditions history measured by the se information, temperatures h (TC1, TC2, TC3).
INVERSE ANALYSIS
There is many differ conduction problem (IHCP references [9, 10], [13-17], methods are used to solve t Two variants of the sequenti
( ) ( ) ( ) ( ) ( ) ² , ² , x t x T t t x T T C T p b b ∂ ∂ = ∂ ∂ λ ρ , 0<x ( ) ( )t x t x T a x b ϕ λ = ∂ ∂ − = , , f t t< < 0 ( ) ( )t x t x T a x g ϕ λ = ∂ ∂ − = , , 0 <t<tf ( ) ( ) ( ) ( ), ²( )², x t x T t t x T T C T p g g ∂ ∂ = ∂ ∂ λ ρ , l<x (x t) T( )t T =0, = 0 , 0<t<tf (x Lt) T ( )t T = , = L , 0<t<tf ( )x F( )x T ,0 = , 0≤x≤L ( ) ( )( )( ) t t l T t l T t TCR bs ss ϕ , , − =
w of the experimental system after
RMULATION
initially heated to the required , the aggregate was put suddenly into men. The temperature evolution was s located in the substrate and at the urface temperatures and heat flux inear inverse heat conduction problem tions of the thermal properties with able 2. For the nonlinear case, the mperatures Tss(l,t), Tb(l,t) and the t) need to be determined from the formulation of the direct problem in te regions between sensors TC5 and
s T0(t) and TL(t) are the temperature sensors TC5 and TC4. As additional s histories are given by other sensors
fferent ways to solve inverse heat P). Some of them can be found in ], [22, 23]. In this paper, two inverse e the problem defined by Eqs (1)-(8). ntial Beck’s method [9, 13], one using
l x<, 0<t<tf (1) (2) (3) L x< , 0<t<tf (4) (5) (6) (7) (8)
the interface heat flux estimation and the other one the direct TCR estimation are used to solve the problem.
Surface heat flux assessment
The solution of the boundary problem described by Eqs. (1)-(8) with temperatures and heat flux unknowns can be obtained by minimizing the mean-square deviation discrete functional, described by Eq. (9) under constraints. One assumed the IHCP has been solved up to time tn; the estimated heat flux qn and the temperature field Tin are known. Next, the time is advanced one step to tn+1 and an estimate qn+1 is calculated. Four temperature sensors are located at a different depths xk below the substrate surface. A temporary assumption is made that heat flux is constant over r future time steps. An estimate is sought of the value ϕn+1, constant over r future time steps that minimize the least squares error between the computed and measured temperatures at the sensors locations. The least squares function is expressed as:
( )
[
(
) (
)
]
2 1 1 1 1 , , , , , 1 1 = = + = = + + + = = − r k m j n l x n l x n k n j k n j n l x Y x t T x t t Jϕ ϕ ϕ (9)Where
Y
(
x
j,
t
n+k)
=
Y
jn+k andT
(
x
j,
t
n+k)
=
T
jn+kare respectively the measured temperature and estimate temperature at the sensors locations.T
jn+k is obtained by solving the direct heat conduction problem Eqs. (1)-(8). m is the number of sensors located in the substrate (TC1, TC2, TC3).The value of ϕn+1, constant over r future time steps, that minimizes J is sought,
( )
[
(
) (
)
]
( )
1 1 1 1 1 1 1 . , , , , , 2 0 + = + = + = = + = = + + + = + = ∂ ∂ − − = = ∂ ∂ 11 n l x n l x k n j r k m j n l x n l x n k n j k n j n l x n l x T t t x T t x Y J ϕ ϕ ϕ ϕ ϕ ϕ (10) The last term on the right of Eq. (10) is called sensitivity coefficient. Step function sensitivity coefficient can be written as:Expanding the temperature field at the first order in a Taylor series about an assumed heat flux ϕn,
(
)
(
) (
)
n k j n l x n l x n l x k n j n l x k n j T S T + ϕ =+1 = + ϕ = + ϕ =+1 −ϕ = + (12)Substituting Eq. (12) into Eq. (10), and solving for the desired heat flux,
The sensitivity coefficients
S
nj+kare the solution of the sensitivity equation formulated as follows:We deduce the temperature field
(
)
1 1 , + + = n j n j T x t T according to following relation:
(
1)
1(
) (
1)
1 1 + = + = = + + = + = + − n j n l x n l x n l x n j n l x n j T S T ϕ ϕ ϕ ϕ (21) Where n+1 jT are the obtained temperatures from the direct problem solving at abscissa
x
j and time stept
n+1 forq
n heat flux assume.Eq. (21) allows assessing bitumen and substrate surface temperatures. Using Eq. (13), the TCR can be found according to Eq. (8). For more detailed of this method references [6, 14, 24] can be consulted.
Direct Thermal contact resistance assessment
Eqs. (2) and (3) can be rewritten to introduce the unknown TCR directly. This procedure allows identification of the TCR whitout surface temperatures and heat flux assessment. The direct problem formulation becomes:
As described previously, the heat conduction problem is formulated in the least-square sense and consists of determining the optimal solution h that minimizes the function:
( )
[
( )
]
2 1 1 1 11 1
= = + = + + + = = − r k m j n l x k n j k n j n l x Y T h h J (30)The minimization procedure remains the same and step function sensitivity coefficient can be written as:
( )
1 1 + = + = + + ∂ ∂ = n l x n l x k n j k n j T S ϕ ϕ (11)(
) (
)
[
]
( )
1 1 1 1 = = + = = + = + + = + = − + = r k m j k n j r k m j k n j n l x k n j k n j n l x n l x S S t x T t x Y 1 1 2 1 1 1 , , , ϕ ϕ ϕ (13) ( ) ( )(
)
( ) ( ) ² , ² , x t x S t t x S T C T p b b ∂ ∂ = ∂ ∂ λ ρ , 0<x<l, 0<t<tf (14) ( ), 1 = ∂ ∂ − =l x b x t x S λ , 0<t<tf (15) ( ), 1 = ∂ ∂ − =l x g x t x S λ , 0<t<tf (16) ( ) ( )(
)
( ) ( ) ² , ² , x t x S t t x S T C T p g g ∂ ∂ = ∂ ∂ λ ρ , l<x<L, 0<t<tf (17) (x=0,t)=0 S , 0<t<tf (18) (x=L,t)=0 S , 0<t<tf (19) ( )x,0 =0 S , 0≤x≤L (20) ( ) ( )(
)
( ) ( ) ² , ² , x t x T t t x T T C T p b b ∂ ∂ = ∂ ∂ λ ρ , 0<x<l, 0<t<tf (22) ( ) ( ) ss bs l x b hT T x t x T − = ∂ ∂ − = , λ , 0<t<tf (23) ( ) ( ) ss bs l x g hT T x t x T − = ∂ ∂ − = , λ , 0<t<tf (24) ( ) ( )(
)
( ) ( ) ² , ² , x t x T t t x T T C T p g g ∂ ∂ = ∂ ∂ λ ρ , l<x<L, 0<t<tf (25) (x t) T( )t T =0, = 0 , 0<t<tf (26) (x Lt) T( )t T = , = L , 0<t<tf (27) ( )x F( )x T ,0 = , 0≤x≤L (28) ( ) ( )t ht TCR = 1 (29)( )
1 1 + = + = + + ∂ ∂ = n l x n l x k n j k n j h h T S (31)The corresponding sensitivity coefficients are obtained from the following sensitivity equation:
Similarly, we can deduce
h
xn=+l1:The TCR can be deduced according to Eq. (29).
RESULTS ANALYSIS AND DISCUSSION Repeatability of the experiment
We have conducted two tests for bitumen temperature of 80°C and substrate temperature of 30°C. The aim was to test the repeatability of measurements. Fig. 5 presents the obtained TCR results. We can note good agreement between the first and the second test for a long time. After 40 seconds small differences can be noted due probably to two dimensions effects that can occur on the insulated surfaces sides. For simplicity of figures the following notation was chosen: BiGj. This mean that the bitumen (B) was heated to temperature i and the granular substrate (G) was heat to temperature j. The discussion of the results is done in the next sections.
Figure 5: repeatability of measures conducts for B80G30
Methods comparison
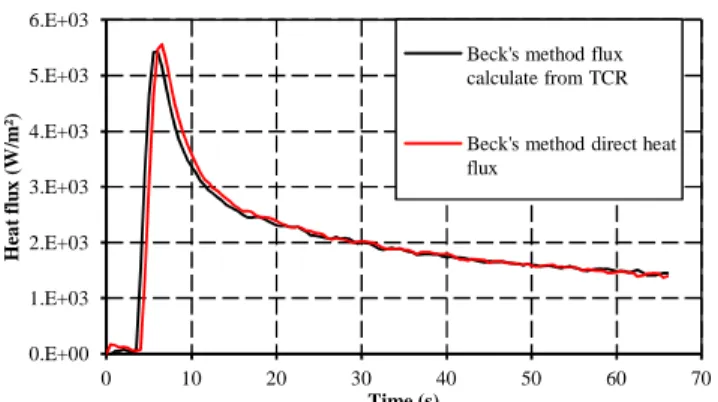
The first part of result analysis concerns the comparison of the methods described in the previous sections. For this comparison the substrate and the bitumen was heated respectively to 80°C and 30°C. The surface temperature and heat flux and the TCR were then computed. Figure 6 and figure 7 show respectively the thermal contact resistance and the surface heat flux evolution after the contact. All methods show good agreement between TCR and heat flux results. However, in the first seconds after contact figure 6 and figure 7 shows that Beck’s heat flux identification method TCR results are noisy compared to Beck’s direct TCR identification method results. This is due to the fact that the TCR assessment from surface heat flux and surfaces temperatures induced an amplification of the TCR noises because it combines the temperatures and heat flux noises.
Figure 6: TCR results assessed with heat flux identification and direct TCR identification methods
Figure 7: Heat flux results assessed with heat flux identification and direct TCR identification methods
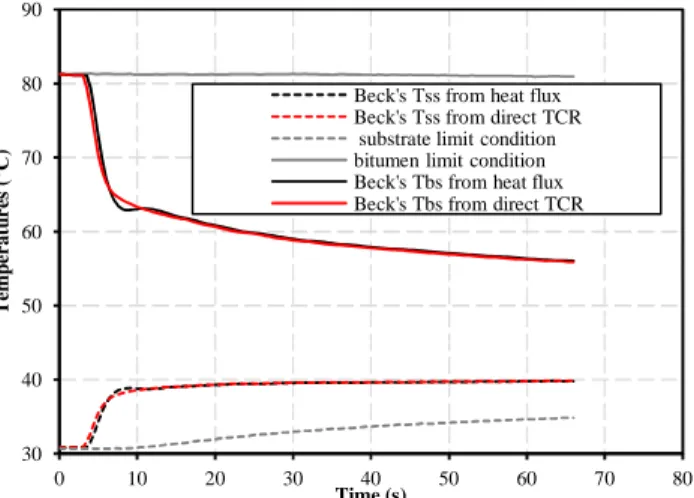
The corresponding surface temperature was computed and represented in figure 8. Weak differences are observed at the first time step as mentioned previously. Figure 8 shows the temperature versus time evolution at the surface of the bitumen and substrate and at the thermocouples location for the B80G30 case. 0.E+00 5.E-03 1.E-02 2.E-02 2.E-02 3.E-02 3.E-02 4.E-02 4.E-02 0 10 20 30 40 50 60 70 T C R m ²K /W Time (s) B80G30 1st test B80G30 2nd test 0.E+00 5.E-03 1.E-02 2.E-02 2.E-02 3.E-02 3.E-02 4.E-02 4.E-02 0 20 40 60 80 T C R ( K m ²/ W ) Time (s)
Beck's method flux identification
Beck's method direct TCR identification 0.E+00 1.E+03 2.E+03 3.E+03 4.E+03 5.E+03 6.E+03 0 10 20 30 40 50 60 70 H ea t fl u x ( W /m ²) Time (s)
Beck's method flux calculate from TCR
Beck's method direct heat flux ( ) ( )
(
)
( ) ( ) ² , ² , x t x S t t x S T C T p b b ∂ ∂ = ∂ ∂ λ ρ , 0<x<l, 0<t<tf (32) ( ) ss bs a x b T T x t x S − = ∂ ∂ − = , λ , 0<t<tf (33) ( ) ss bs a x g T T x t x S − = ∂ ∂ − = , λ , 0<t<tf (34) ( ) ( )(
)
( ) ( ) ² , ² , x t x S t t x S T C T p g g ∂ ∂ = ∂ ∂ λ ρ , l<x<L, 0<t<tf (35) (x=0,t)=0 S , 0<t<tf (36) (x=L,t)=0 S , 0<t<tf (37) ( )x,0 =0 S , 0≤x≤L (38)(
) (
)
[
]
( )
1 1 1 1 = = + = = + = + + = + = − + = r k m j k n j r k m j k n j n l x k n j k n j n l x n l x S S h t x T t x Y h h 1 1 2 1 1 1 , , , (39)Figure 8: Temperatures profiles results assessed with heat flux identification and direct TCR identification methods
Results analysis
From Fig. 6 result, the following analysis can be done: After the contact establishment quickly decrease of the TCR is observed. The air is expelled from bitumen-substrate interface causing a high TCR decreasing until a minimal value. Because of roughness of the substrate surface, there is an air layer at the interface between bitumen and substrate. This air gap acts as a resistance. During the first time, TCR depends of substrate roughness, surface tension of the liquid bitumen, wettability and contact angle of the surface, nature of the trapped air and pressure of liquid bitumen. At the end of this stage, the wetted surface and heat flux are maximum. Then TCR is minimum. The TCR is established just on the roughness peaks. Bitumen starts to cool down at these peaks and its cooling leads to its viscosity increasing.
The second step is characterized by the TCR growing. As the substrate’s initial temperature is smaller than the bitumen temperature, the contact induces bitumen surface temperature cooling. The bitumen cooling causes its thermal shrinkage which conducts to a slight increasing of the air entrapped in the microcavities at the interface and then increases the TCR value. The thickness of the viscous part of bitumen increases progressively and contracts from the substrate which increases at the same time the size of the interfacial air gap. We assumed that the TCR is totally established when the bitumen surface temperature becomes stationary. The profile of the bitumen surface temperature will be discussed in next section.
Effect of components temperatures
The study of the bonding quality was carried out for several heating cases. The substrate temperature varies from 30°C to 150°C and the bitumen temperature from 80°C to 160°C. Fig. 9 shows the TCR results computed by the Beck’s direct TCR identification method. According to Fig. 9, one can note that the increase of the components temperatures induces a decrease of the TCR value. The higher values of TCR are obtained for B80G30. In this case the bitumen is more viscous
and cannot penetrate into the micro-roughness of the aggregate. The smaller values of the TCR are obtained for B160G150. In this case bitumen is very liquid with low viscosity and this ensures good wettability of the substrate rough surface. In the cases which the substrate temperature is greater or equal to 110°C, the first time TCR values are not very different. However after a long time these values become different due probably to the difference of the thickness of entrapped air. In these experimental tests, the temperatures of some warm mixes are reproduced. We note that, the reduction of the temperature in the warm mixes can induce a loss of bonding quality.
As explain previously, the TCR is assumed to be established when the bitumen surface temperature is constant. These temperatures are represented on Fig. 10. Except B80G30 the others surface temperatures are stationary from 20 seconds and TCR are established.
Figure 9: TCR result assess by the Beck's direct TCR method for all bitumen and substrate temperature studied
Figure 10: Bitumen surface temperature evolution
Effect of additives
In warm asphalt mix manufacturing, road companies generally add some additives into the hot bitumen before
30 40 50 60 70 80 90 0 10 20 30 40 50 60 70 80 T em p er a tu r es ( °C ) Time (s)
Beck's Tss from heat flux Beck's Tss from direct TCR
substrate limit condition bitumen limit condition Beck's Tbs from heat flux Beck's Tbs from direct TCR
1.00E-04 5.10E-03 1.01E-02 1.51E-02 2.01E-02 2.51E-02 3.01E-02 3.51E-02 0 10 20 30 40 50 60 70 T C R ( K m ²/ W ) Time (s) B80G30 B120G30 B120G70 B160G70 B160G110 B160G150 B160G130 0 20 40 60 80 100 120 140 160 180 0 20 40 60 B it u m en s u rf ac e te m p er at u re ( °C ) Time (s) B80G30 B120G30 B120G70 B160G70 B160G110 B160G150 B160G150_ceca B160G150_Oleoflux B160G150_Greenseal B160G130
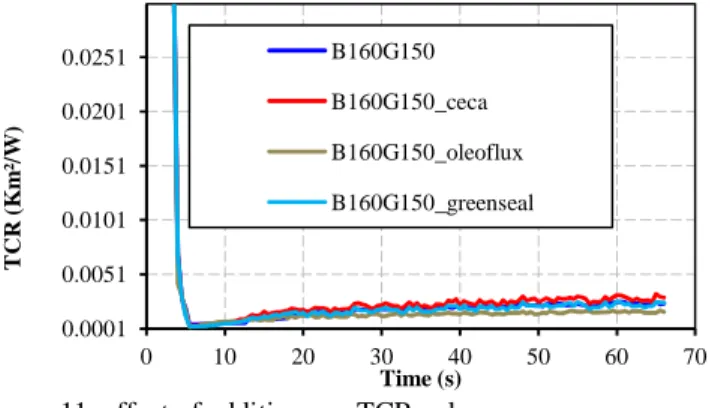
putting it into contact with aggregates. The additives role is to reduce bitumen viscosity and / or to improve bitumen spreading over the aggregates. Our study proposes to study the effects of some common additives (Ceca, Oleoflux and Greenseal) by TCR measurement. These additives are mixed with bitumen before putting the bitumen in the elastomer ring. They are totally soluble in the bitumen. The effects of the additives in terms TCR are shown in Fig. 11.
Figure 11: effect of additives on TCR value
The effect of additives was studied for a substrate temperature 150°C and bitumen temperature 160°C. For additives Ceca and Greenseal no significant reduction of TCR can be noted compared to the case B160G150 without additive. Indeed, studies conducted by Gonzalez et al [1] showed that the Ceca additive dosed at 0.5% did not change the bitumen viscosity while Greenseal additive modifies the bitumen viscosity even at 1% but his effect was not found in our study. In contrast, the Oleoflux additive reduces significantly the TCR value 1.24 10-3 Km²/W at 20s. This additive is known to modify highly the viscosity, adhesion properties and the mechanical properties of bitumen [3]. The presence of Oleoflux additive in the bitumen, improves the heat transfer rate by minimizing the effect of numerous microcavities filled by air thanks to its surfactant properties. We should mention that the TCR values depend on the roughness of the substrate surface and does not take into account the dynamics due to mixing operation. However, this experimental test has the benefic to assess the bonding quality at the manufacturing period. At 20s the TCR varies from 1.24 10-3 Km²/W (B160G150_oleoflux) to 9.37 10-3 Km²/W (B80G30). Although these resistances are important, they are consistent with our substrate surface roughness (Ra=75µm). We are now working on determining the thickness of the air layer trapped in the substrate roughness. The corresponding bitumen surface temperatures which characterized the TCR establishment are given by Fig. 10.
CONCLUSION
The objective of this paper was to present a bonding quality between bitumen and aggregates assessment method during the asphalt mix manufacturing operation. We proposed to assess the TCR between bitumen and aggregate and then to interpreted TCR as bitumen and aggregate bonding quality indicator in the asphalt mix manufacturing conditions. The results show that the increase of one of the components
temperature (bitumen or granular substrate) induces a decrease of the thermal contact resistance and good bonding between bitumen and aggregate in the asphalt manufacturing operation. The additives generally used by roads companies when components temperatures are reduced to ensure good wettability or low bitumen viscosity effect was studied. We found bonding improvement by the Oleoflux additive, the effect of others is not significant.
One of the main objectives was to make a comparison of the TCR results according to the chosen inverse method. Two methods are used and all of them show good agreement on TCR results. Only the induced noise is different. We suggest finally using Beck’s direct TCR identification method to assess the TCR.
ACKNOWLEDGMENTS
We express our gratitude to Nicolas Lefevre and Sébastien Buisson for their crucial participation in the adaptation of the apparatus.
REFERENCES
[1] J.A. Gonzalez Leon, S. Ligier, P. Caujolle, G. Barreto, Warm mix asphalts with chemical additives: properties and advantages, ENVIRAOD (2009).
[2] M. Mazé, F. Delfosse, S. F. Dumont, E. Crews, C. Giorgi, Développement en Europe du procédé Tempera/ Evotherm DAT, RGRA 874 (2009) 50-55.
[3] E. Beduneau, V. Gaudefroy, F. Olard, C. de la Roche, Enrobés chauds et semi-tièdes EBT : évaluation êrformantielle d’une grave-bitume. RGRA 880 (2009) 967-75
[4] F. Canestrari, F. Cardone, A. Graziani, F. A. Santagata, H. U. Bahia, Adhesive and cohesive properties of asphalt-aggregate systems subjecd to moisture damage, International Journal of Road Materials and Pavement design EATA (2010) 11-32,
[5] K. L. Vasconcelos, A. Bhasin, D. N. Little, Influence of reduced production temperatures on the adhesive properties of aggregates and laboratory performance of fine aggregate-asphalt mixtures. International Journal of Road Materials and Pavements Design 11 (2010) 47-64.
[6] R. Le Goff, G. Poutot, D. Delaunay, R. Fulchiron, E. Koscher, Study and modeling of heat transfer during the solidification of semi-crystalline polymers. International Journal of Heat and Mass Transfer 48 (2005), 5417-5430. [7] T. Loulou, E. A. Artyukhin, J.P. Bardon, Estimation of thermal contact resistance during the first stages of metal solidification process: I-experiment principle and modelisation. International Journal of Heat and Mass Transfer 42 (1999) 2119-2127.
[8] T. Loulou, E.A. Artyukhin, J.P. Bardon, Estimation of thermal contact resistance during the first stages of metal solidification process: II- experimental setup and results. International Journal of Heat and Mass Transfer 42 (1999) 2129-2142. 0.0001 0.0051 0.0101 0.0151 0.0201 0.0251 0 10 20 30 40 50 60 70 T C R ( K m ²/ W ) Time (s) B160G150 B160G150_ceca B160G150_oleoflux B160G150_greenseal
[9] P. Le Bot, Comportement thermique des semi-cristallins injectés application à la prédiction des retraits, PhD thesis Université de Nantes 1998.
[10] A.S. Boutonnet, Étude de la résistance thermique de contact à l’interface de solides déformables en frottement : application aux procédés de forgeage, PhD thesis, INSA Lyon 1998.
[11] H. Massé, E. Arquis, D. Delaunay, S. Quilliet, P.H. Le Bot, Heat transfer with mechanically driven contact resistance at the polymer-mold interface in injection molding of polymers, International Journal of Heat and Mass Transfer 47 (2004) 2015-2027.
[12] A. Bendada, A. Derdouri, M. Lamontagne, Y. Simard, Analysis of thermal contact resistance between polymer and mold in injection molding, Applied Thermal Engineering 24 (2004) 2029-2040.
[13] Y-C. Yang, W-L. Chen, A nonlinear inverse problem in estimating the heat flux of the disc in a disc brake system, Applied Thermal Engineering 31 (2011) 2439-2448
[14] Bransier, M. Raynaud, A new finite-difference method for the nonlinear inverse heat conduction problem. Numerical Heat Conduction, B 9 (1986) 27-42.
[15] F.C. Cavalcanti, Caractérisation de produit de l’état liquide à l’état solide, PhD thesis, INSA Lyon (2006).
[16] J. Beck, B. Blackwell, Inverse Heat Conduction: Ill-posed problems. Wiley Interscience, (1985)
[17] N. Özisik, Heat conduction, Second Edition, John Wiley & Sons, (1993).
[18] J.F. Masson, G.M. Polomark, Bitumen microstructure by modulated differential scanning calorimetry, Thermichimica Acta 374 (2001) 105-114.
[19] J. P. Planche, P. M. Claudy, J. M. Létoffé, D. Martin, Using thermal analysis methods to better understand asphalt rheology, thermochimica Acta 324 (1998) 223-227
[20] B. Bourouga, V. Goizet, JP. Bardon, Les aspects théoriques régissant l’instrumentation d’un capteur thermique pariétal à faible inertie. International Journal Thermal Science 39 (2000), 96-109
[21] X. A. Aduriz, C. Lupi, N. Boyard, J.-L. Bailleul, D. Leduc, V. Sobotka, N. Lefèvre, X. Chapeleau, C. Boisrobert, D. Delaunay, Quantitative control of RTM6 epoxy resin polymerisation by optical index determination, Composites science and technology 67(2007) 3196-3201
[22] O.M. Alifanov, Inverse Heat Conduction Problem, Springer, Berlin, 1994
[23] Y. Jarny, D. Maillet, Linear inverse heat conduction problem-two basic examples, Metti 5 Spring School June 2011, 1-18
[24] M.A. Martorano, J.D.T. Capocchi, Heat transfer coefficient at the metal-mould interface in the unidirectional solidification of Cu-8% Sn alloys, International Journal of Heat and Mass Transfer 43 (2000) 2541-2552.