HAL Id: hal-01512688
https://hal.archives-ouvertes.fr/hal-01512688
Submitted on 24 Apr 2017HAL is a multi-disciplinary open access
archive for the deposit and dissemination of sci-entific research documents, whether they are pub-lished or not. The documents may come from teaching and research institutions in France or abroad, or from public or private research centers.
L’archive ouverte pluridisciplinaire HAL, est destinée au dépôt et à la diffusion de documents scientifiques de niveau recherche, publiés ou non, émanant des établissements d’enseignement et de recherche français ou étrangers, des laboratoires publics ou privés.
Distributed under a Creative Commons Attribution - NonCommercial - ShareAlike| 4.0 International License
The Dynamic Surface Tension of Water
Ines Hauner, Antoine Deblais, James Beattie, Hamid Kellay, Daniel Bonn
To cite this version:
Ines Hauner, Antoine Deblais, James Beattie, Hamid Kellay, Daniel Bonn. The Dynamic Surface Tension of Water. Journal of Physical Chemistry Letters, American Chemical Society, 2017, 8 (7), pp.1599-1603. �10.1021/acs.jpclett.7b00267�. �hal-01512688�
The Dynamic Surface Tension of Water
Ines M. Hauner,
†,‡Antoine Deblais,
§James K. Beattie,
∥Hamid Kellay,
§and Daniel Bonn
*
,††van der Waals-Zeeman Institute, University of Amsterdam, 1098XH Amsterdam, The Netherlands
‡Chimie ParisTech, PSL Research University, CNRS, Institut de Recherche de Chimie Paris, 75005 Paris, France
§Laboratoire Ondes et Matière d’Aquitaine (UMR 5798 CNRS), University of Bordeaux, 351 cours de la Libération, 33405 Talence, France
∥School of Chemistry, University of Sydney, Sydney, New South Wales 2006, Australia
*
S Supporting InformationABSTRACT: The surface tension of water is an important parameter for many biological or industrial processes, and roughly a factor of 3 higher than that of nonpolar liquids such as oils, which is usually attributed to hydrogen bonding and dipolar interactions. Here we show by studying the formation of water drops that the surface tension of a freshly created water surface is even higher (∼90 mN m−1) than under equilibrium conditions (∼72 mN m−1) with a relaxation process occurring on a long time scale (∼1 ms). Dynamic adsorption effects of protons or hydroxides may be at the origin of this dynamic surface tension. However, changing the pH does not significantly change the dynamic surface tension. It also seems unlikely that hydrogen bonding or dipole orientation effects play any role at the relatively long time scale probed in the experiments.
T
he surface tension of any liquid is positive, which can be understood from the fact that on average a molecule on the surface has fewer neighbors and hence fewer attractive van der Waals interactions than a molecule in the bulk. It therefore costs energy to create new surfaces and indeed, reasonable estimates of the surface tensions of apolar liquids can be obtained in this way.1 For water, however, an analogous approach leads to a calculated surface tension that is roughly a factor of three smaller than the experimental one.1One usually attributes the high surface tension to missing hydrogen bonds at the surface, but it has turned out to be very difficult to calculate or simulate their contribution to the surface tension in both theory and simulations.2 One test of the hydrogen bond argument would be to make use of the fact that the relaxation (reorientation) time of hydrogen bonds in the bulk is on the order of a few ps.3Hence, if the reorientation time scale at the interface is similar, one would expect any relaxation of the surface tension to take place on this timescale. Here we study the surface relaxation of water and find that water exhibits a dynamic surface tension with a relaxation time that is on the order of 1 ms or larger, indicating that an essential ingredient is missing for understanding the value of the water surface tension.We study the formation and breakup of droplets of water emanating from an orifice (Figure 1). Drop formation has received much attention recently and it was shown that the breakup mechanism is universal for different liquids, meaning that the form of the breakup and its time dependence are uniquely determined by the forces acting on the liquid neck that separates the main drop from the orifice.4,5 For
low-viscosity liquids such as water, only surface tension forces drive the breakup of the liquid neck while inertial forces slow it down. This leads to a dynamics characteristic of a singularity at finite time, in which the neck diameter goes to zero as
σ ρ = ⎛ − ⎝ ⎜ ⎞ ⎠ ⎟ Dmin A (t t) 1/3 0 2/3 (1)
where Dmin is the width of the fluid neck at its minimum (Figure 1), A is a numerical prefactor,σ is the surface tension, ρ is the density, and t0is the breakup time. The (t0− t) term, in the following referred to asτ, is characteristic of the finite time singularity that occurs at t0, in which the deformation rate of the surface diverges. Consequently, if one knows the prefactor A, one can infer the surface tension from the drop formation dynamics in a situation where the breakup process creates freshly formed air−water interface at a diverging rate. The latter is easy to see from volume conservation; taking the liquid neck as a cylinder of height h, its constant volume is∼ Dmin2h so that
h∼ (t0− t)−4/3and consequently the area Dminh∼ (t0− t)−2/3
diverges at t0.
Determination of the Universal Prefactor. Despite the fact that the prefactor A should be universal and therefore independent of any initial conditions or the nature of the inviscidfluid itself, there is considerable uncertainty in the literature4−11as to what the value of A ineq 1should be. Most published experimental
Received: February 2, 2017 Accepted: March 16, 2017 Published: March 16, 2017
Letter
pubs.acs.org/JPCL
Derivative Works (CC-BY-NC-ND) Attribution License, which permits copying and redistribution of the article, and creation of adaptations, all for non-commercial purposes.
results were obtained from ultrarapid imaging and suggest prefactors of 0.9−1.1,10 1.111 or 1.14−1.36.12 An alternative approach based on measuring the electrical conductance of the filament yielded a prefactor as low as 0.2.8
A similar disagreement appears in the associated numerical simulations, where values between 1.26,111.4,10and 1.4613can be deduced from the presented drop breakup dynamics curves. In certain simulations, the presented asymptotics even seem to display a time dependence that is wholly inconsistent with there being a universal asymptotic dynamics.10 In addition, none of the existing experimental and numerical accounts explicitly gives a value for the prefactor. These remarkable discrepancies warrant an in-depth investigation of this fundamental hydrodynamics problem. This is beyond the scope of the present paper and will be addressed at in a separate study. In the present work we will first provide an unambiguous determination of the prefactor using different simple liquids and subsequently use the derived value for A as a reference for the determination of the water surface tension of a pristine water−air interface.
We follow the thinning dynamics using an ultra high-speed camera attached to a microscope to have both maximal temporal and spatial resolution. For liquids with different ratios σ/ρ, we arrive at good agreement witheq 1(Figure 2A) with a value of the prefactor A of 0.9± 0.01 (Figure 2B). For water, however, the identical experiment is not on the same line, and shows a systematic deviation. Previous experiments on water, helium, and mercury breakup do not agree on the prefactor.7−10The data of Chen et al., although noisier, appear
to agree with our data at least close to the breakup point, but deviate for longer times and the helium and mercury experiments give very different prefactors. From numerics,10,13 the prefactor was determined to be A∼ 1.4, which disagrees with most of the experiments. We therefore use the precise and universal prefactor obtained in our experiments on a series of other liquids of known surface tension. The surface tensions were verified independently on the liquids used in the snap-off experiments. Using this prefactor does not lead to the expected value of the surface tension of∼72 mN m−1, but rather to a surprisingly high value of∼90 mN m−1. This strongly suggests that the surface tension of a newly formed water surface on a time scale <1 ms is different from the equilibrium surface tension, implying that some surface relaxation must take place. This gives a bound on the characteristic time for the surface tension crossover (∼ ms) that is very different from that of the relaxation of the bulk hydrogen bonds (∼ ps). One possible mechanism that has been proposed and was suggested to lead to a similar time scale1,14is the establishment of an equilibrium distribution of OH− and H+ ions close to the interface. The (uncontested) positive sign of the surface potential of water implies that its surface charge correspondingly carries a net negative sign in equilibrium and at neutral pH.15−17The usual interpretation of this is that, on average, the OH−are closer to the surface than the H+ions, which implies the establishment of an OH−“adsorption” equilibrium at the surface.14However, at very low pH, the surface charge becomes positive due to the excess of H+present.17,18In principle, this could both account
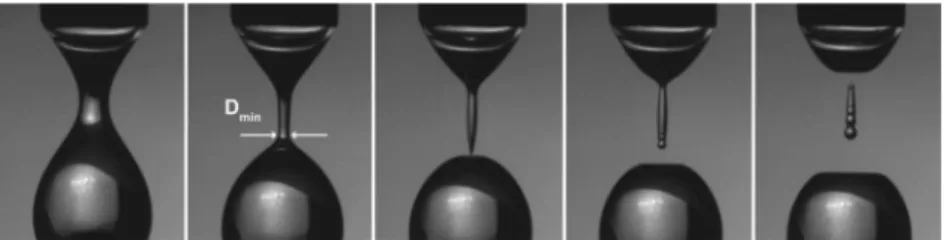
Figure 1.Pinch-off images at subsequent stages of the droplet pinch-off process. The minimum neck diameter is obtained from ultrarapid camera movies (54.000 fps) and subsequent image analysis. Time to pinch-off is 5 ms, 1 ms, 0 ms, −0.5 ms, and −1 ms (left to right). The experiments were performed with two different capillary sizes (240 μm and 2 mm); the drop size in the image is 2.25 mm.
Figure 2.Determination of the prefactor in eq1. (A) Linearfits of ultrarapid camera imaging data to the capillary-inertial law for inviscid fluids (Dmin
= Aτ2/3). By plotting the data in this way, a stringent test is obtained for the applicability of the scaling; the slope C of thefitted lines can then be
used to determine the prefactor A. (B) By plotting the slopes obtained from panel a versus (σ/ρ)1/2, we derive a prefactor A = 0.9± 0.01 (slope C =
A3/2(σ/ρ)1/2). Water, D
2O, and sodium chloride solution show a significant deviation from the theoretical prediction and are thus not taken into
consideration for the calculation of the universal prefactor. The presented data were obtained using a capillary of 240μm diameter.
The Journal of Physical Chemistry Letters Letter
DOI:10.1021/acs.jpclett.7b00267
J. Phys. Chem. Lett. 2017, 8, 1599−1603
for the higher value of the dynamic surface tension at short times and the existence of the characteristic time: if the OH− ions are depleted at early times, this would increase the surface tension, and the characteristic time is the time for establishing the adsorption equilibrium. In our case, the diffusion coefficient of OH−ions is∼10−9m2/s,19so that establishing the diffusion equilibrium over the typical diameter of thefluid neck of 1 μm takes ∼1 ms. In some molecular dynamics simulations,20 spectroscopic investigations,21 and studies on acid adsorp-tion,22−24it is suggested that H+ adsorption may also occur at the water−air interface indicating that the underlying mechanism could be even more complex. We therefore now investigate the effect of pH.
Ef fect of pH. Such a dynamic surface tension is well-known for surface-active agents, and, indeed, the same experiment as done here in the presence of surfactants shows that close to drop breakup, the surface tension is significantly higher than the equilibrium one, just as is observed here.25,26 If there is no adsorption barrier, the characteristic time follows from the adsorption dynamics asτ ∼ Γ2/Dc2, whereΓ is the equilibrium adsorption, c the bulk concentration, and D the diffusion coefficient of the surface-active species. Characteristic times are also found to be on the order of∼1 ms in surfactant adsorption experiments.27This suggests for our experiments that changing the bulk concentration c should have a strong influence on the relaxation time. In our experiment, we can easily change the bulk concentration of protons or hydronium ions by several orders of magnitude by adjusting the pH with either acid (HCl) or base (NaOH). However, the data show that neither of these additions changes the short-time value of the dynamic surface tension (Figure 2A). From the simple argument given above, one would have anticipated to retrieve the equilibrium surface tension upon addition of an excess of OH−ions (data at pH = 14, Figure 2). A relaxation time independent of the bulk concentration can be obtained if there is an adsorption barrier at the surface that is the rate-limiting step for the arrival of molecules from the bulk onto the surface. This is, for instance, frequently encountered for charged surfactants,28 where the charged surfactants at the surface constitute an electrostatic barrier for the adsorption of further charged molecules. In our case though, if the barrier is electrostatic, one would again expect a large decrease of the characteristic time upon changing
the pH, since the characteristic time in this case isτ ∼ κ2/D,28
with κ the Debye length that varies with the amount of electrolyte added. Thus, the data would only be consistent with the existence of an adsorption energy barrier that comes from a different origin. However, what the physical mechanism would be is unclear.
Ef fect of Salt Concentration. A related check of the ionic redistribution explanation is to see whether there is a characteristic time for the depletion of certain species from the interface. The obvious approach for studying dynamic depletion effects is to study salt solutions. Salts are strongly depleted from the aqueous interface, which in equilibrium increases the surface tension close to the values that are found here for the dynamic tension. In addition, large amounts of salt strongly screen any electrostatic interaction between the surface and the bulk and should therefore prevent adsorption of any charged moieties. Surprisingly, we could not detect any effect of the salt concentration on the surface relaxation behavior on short time scales (Figure 3B). The various salt solutions (Figure 3A) again behave very similarly to water with a similarly high prefactor compared to the simple liquids.
Discussion. Our ultrarapid camera experiments on droplet formation and breakup of different pure liquids therefore provide strong evidence for the existence of a high dynamic surface tension for water and various aqueous solutions on an approximately millisecond time scale. In the past, higher than equilibrium surface tension values for water have been reported on short time scales. However, they have all remained highly controversial due to methodological and analytical short-comings. As early as 1926, Schmidt and Steyer reported elevated values of 80−100 mN m−1for the surface tension of freshly formed water/air interfaces, that would relax to the equilibrium value within roughly 1 ms.29 Critics nevertheless stated that a viscosity effect in the constricted quartz capillary rather than the actual dynamic surface tension is measured by the falling meniscus method they employed.30A few years later, an improved technique, the “bell method”, yielded similar results, which, nevertheless, remained equally dubious due to the ambiguity related to the exact determination of the surface age.14,31 Finally, Kochura and Rusanov measured both the surface tension and the surface potential of water with the oscillating and the smooth jet method, respectively.14 These
Figure 3.Effect of salt. (A) Apparent prefactors obtained from pinch-off experiments. The derived prefactor appears to be independent of the salt concentration. (B) Pinch-off dynamics of aqueous solutions at early times. Water and brine display an almost identical surface relaxation mechanism with surface tension values of 90 mN m−1for the pristine interface. The data overlap since the increase in surface tension induced by the addition of salt is similar to the increase in density.
two independent techniques likewise suggested a dynamic water surface tension with initial values considerably above the equilibrium value and a similar relaxation time of ca. 0.5 ms. However, again, the suitability of the oscillating jet method for determining the surface tension of pristine surfaces on a submillisecond time scale has remained controversial: the associated hydrodynamics are incompletely understood which, in turn, entails considerable uncertainties in the complex analysis procedure.32 In contrast to the above-mentioned methodologies, our method of studying droplet breakup dispenses with the experimental shortcomings and analytical ambiguity. The experimental procedure is very robust, and the associated pinch-off dynamics is very well understood for inviscidfluids.
Taken together, we were able to unambiguously relate the drop breakup dynamics to the surface tension of a wide variety of pure liquids with the exception of pure, heavy, and salty water. For aqueous systems, a considerable and systematic deviation was found. The origin of the slow surface relaxation process, which a dynamic surface tension implies, remains, however, incompletely understood. Various theories have been proposed in the past to account for this phenomenon. A much-discussed idea18,33−35 is that ion adsorption processes in the first fraction of a millisecond after surface creation are directly responsible for the observed high surface tension. We have shown here that, for pure water, this indeed gives the correct order of magnitude. Yet our detailed measurements also show that the high surface tension is observed irrespective of salt and OH−/H+ concentration levels. This is only possible if bulk
diffusion or an electrostatic energy barrier at the surface are not the rate-limiting steps for OH−adsorption. An alternative and rather straightforward argument goes that the observed surface tension relaxation is merely due to traces of contaminant surfactants that are, in practice, very hard to avoid. However, it has been shown in both theory36and experiments25,26that, in drop breakup experiments, the diverging rate of surface formation makes the adsorption or even presence of surfactants irrelevant, at least close to breakup. Further, these contaminants can only reduce the surface tension. In addition, the characteristic time for adsorption of surfactants at low concentrations lies in the range of several milliseconds and should be even higher for very small contaminant concen-trations,37 which again shows that impurities should be irrelevant on our submillisecond time scale.
Another possible explanation, perhaps related to the collective nature of the dipole fluctuations, would be a slow reorientation dynamics near the surface. In bulk, dielectric relaxation is known to occur on a much, much faster time scale (∼ ps)3. Although it has been argued that close to surfaces the relaxation might be one or 2 orders of magnitude slower,38,39 this is still a very a long way from the observed characteristic relaxation time of ∼1 ms, even if one takes into account the possibility of a higher order water structure close to the surface.14 On the other hand, it also seems unlikely that the observed deviations for water and the various aqueous solutions are due to hydrodynamic effects. For instance, flows have been shown to dampen out the capillary wave fluctuations of the surface and hence to increase the tension.40However, if such an effect is present here, it would happen at nanometer length and picosecond or nanosecond time scales, and would hence not be observable in our experiment.40More importantly, it would also occur for the other liquids tested here, which have similar viscosities, surface tensions, and densities.
In conclusion, we are at present unable to offer a complete explanation for our results. In spite of this, the implications are rather large: the observed high dynamic tension should, for instance, be relevant for spray formation, jet destabilization, drop impact, and drop formation as there are very short time scale surface dynamics in all of these processes.
■
ASSOCIATED CONTENT*
S Supporting InformationThe Supporting Information is available free of charge on the
ACS Publications websiteat DOI:10.1021/acs.jpclett.7b00267. Details of employed experimental materials and methods (PDF)
■
AUTHOR INFORMATION Corresponding Author *E-mail:[email protected]. ORCID Ines M. Hauner:0000-0002-5694-3556 Author ContributionsD.B. and H.K. conceived the idea and the experiments. I.M.H., A.D., and H.K. performed the experiments. I.M.H., A.D., J.K.B., H.K., and D.B. interpreted the experimental results. I.M.H. and D.B. wrote the article with input from A.D., J.K.B., and H.K.
Notes
The authors declare no competingfinancial interest.
■
ACKNOWLEDGMENTSD.B. is very much indebted to S. Woutersen, Y. Nagata, and M. Bonn for very helpful discussions.
■
REFERENCES(1) Lyklema, J. Fundamentals of Interface and Colloid Science; Academic Press: London, 1995; Vol. 3, pp 68−70.
(2) Nagata, Y.; Ohto, T.; Bonn, M.; Kühne, T. D. Surface tension of ab initio liquid water at the water-air interface. J. Chem. Phys. 2016, 144 (20), 204705.
(3) Laage, D.; Hynes, J. T. On the Molecular Mechanism of Water Reorientation. J. Phys. Chem. B 2008, 112 (45), 14230−14242.
(4) Eggers, J. Nonlinear dynamics and breakup of free-surface flows. Rev. Mod. Phys. 1997, 69 (3), 865−930.
(5) Eggers, J.; Villermaux, E. Physics of liquid jets. Rep. Prog. Phys. 2008, 71 (3), 036601.
(6) Wagner, C.; Amarouchene, Y.; Bonn, D.; Eggers, J. Droplet Detachment and Satellite Bead Formation in Viscoelastic Fluids. Phys. Rev. Lett. 2005, 95 (16), 164504.
(7) Burton, J. C.; Rutledge, J. E.; Taborek, P. Fluid pinch-off in superfluid and normal4He. Phys. Rev. E 2007, 75 (3), 036311.
(8) Burton, J. C.; Rutledge, J. E.; Taborek, P. Fluid Pinch-Off Dynamics at Nanometer Length Scales. Phys. Rev. Lett. 2004, 92 (24), 244505.
(9) Burton, J. C., Ph.D. Thesis, University of Califronia Irvine, 2006. (10) Chen, A. U.; Notz, P. K.; Basaran, O. A. Computational and Experimental Analysis of Pinch-Off and Scaling. Phys. Rev. Lett. 2002, 88 (17), 174501.
(11) Brenner, M. P.; Eggers, J.; Joseph, K.; Nagel, S. R.; Shi, X. D. Breakdown of scaling in droplet fission at high Reynolds number. Phys. Fluids 1997, 9 (6), 1573−1590.
(12) Castrejón-Pita, J. R.; Castrejón-Pita, A. A.; Hinch, E. J.; Lister, J. R.; Hutchings, I. M. Self-similar breakup of near-inviscid liquids. Phys. Rev. E 2012, 86 (1), 015301.
(13) Day, R. F.; Hinch, E. J.; Lister, J. R. Self-Similar Capillary Pinchoff of an Inviscid Fluid. Phys. Rev. Lett. 1998, 80 (4), 704−707.
The Journal of Physical Chemistry Letters Letter
DOI:10.1021/acs.jpclett.7b00267
J. Phys. Chem. Lett. 2017, 8, 1599−1603
(14) Liu, M.; Beattie, J. K.; Gray-Weale, A. The surface relaxation of water. J. Phys. Chem. B 2012, 116 (30), 8981−8988.
(15) Farrell, J. R.; McTigue, P. Precise compensating potential difference measurements with a voltaic cell. J. Electroanal. Chem. Interfacial Electrochem. 1982, 139 (1), 37−56.
(16) Kochurova, N. N.; Rusanov, A. I. Dynamic surface properties of water: Surface tension and surface potential. J. Colloid Interface Sci. 1981, 81 (2), 297−303.
(17) Zimmermann, R.; Freudenberg, U.; Schweiß, R.; Küttner, D.; Werner, C. Hydroxide and hydronium ion adsorption - A survey. Curr. Opin. Colloid Interface Sci. 2010, 15 (3), 196−202.
(18) Beattie, J. K.; Djerdjev, A. M.; Warr, G. G. The surface of neat water is basic. Faraday Discuss. 2009, 141 (0), 31−39.
(19) Buffle, J.; Zhang, Z.; Startchev, K. Metal Flux and Dynamic Speciation at (Bio)interfaces. Part I: Critical Evaluation and Compilation of Physicochemical Parameters for Complexes with Simple Ligands and Fulvic/Humic Substances. Environ. Sci. Technol. 2007, 41 (22), 7609−7620.
(20) Vacha, R.; Horinek, D.; Berkowitz, M. L.; Jungwirth, P. Hydronium and hydroxide at the interface between water and hydrophobic media. Phys. Chem. Chem. Phys. 2008, 10 (32), 4975− 4980.
(21) Buch, V.; Milet, A.; Vácha, R.; Jungwirth, P.; Devlin, J. P. Water surface is acidic. Proc. Natl. Acad. Sci. U. S. A. 2007, 104 (18), 7342− 7347.
(22) dos Santos, A. P.; Levin, Y. Surface tensions and surface potentials of acid solutions. J. Chem. Phys. 2010, 133 (15), 154107.
(23) Randles, J. E. B.; Schiffrin, D. J. Surface tension of dilute acid solutions. Trans. Faraday Soc. 1966, 62 (0), 2403−2408.
(24) Weissenborn, P. K.; Pugh, R. J. Surface Tension of Aqueous Solutions of Electrolytes: Relationship with Ion Hydration, Oxygen Solubility, and Bubble Coalescence. J. Colloid Interface Sci. 1996, 184 (2), 550−563.
(25) Roche, M.; Aytouna, M.; Bonn, D.; Kellay, H. Effect of Surface Tension Variations on the Pinch-Off Behavior of Small Fluid Drops in the Presence of Surfactants. Phys. Rev. Lett. 2009, 103 (26), 264501.
(26) de Saint Vincent, M. R.; Petit, J.; Aytouna, M.; Delville, J. P.; Bonn, D.; Kellay, H. Dynamic interfacial tension effects in the rupture of liquid necks. J. Fluid Mech. 2012, 692, 499−510.
(27) Aytouna, M.; Bartolo, D.; Wegdam, G.; Bonn, D.; Rafaï, S. Impact dynamics of surfactant laden drops: dynamic surface tension effects. Exp. Fluids 2010, 48 (1), 49−57.
(28) Diamant, H.; Andelman, D. Kinetics of Surfactant Adsorption at Fluid−Fluid Interfaces. J. Phys. Chem. 1996, 100 (32), 13732−13742. (29) Schmidt, F.; Steyer, H. Neue Untersuchungen über die zeitliche Änderung der Spannung reiner Wasseroberflächen. Ann. Phys. 1926, 384 (5), 442−464.
(30) Defay, R.; Hommelen, J. R. I. Measurement of dynamic surface tensions of aqueous solutions by the oscillating jet method. J. Colloid Sci. 1958, 13 (6), 553−564.
(31) Wegener, P. P.; Parlange, J.-Y. Surface Tension of Liquids from Water Bell Experiments. Z. Phys. Chem. 1964, 43, 245.
(32) Franses, E. I.; Basaran, O. A.; Chang, C.-H. Techniques to measure dynamic surface tension. Curr. Opin. Colloid Interface Sci. 1996, 1 (2), 296−303.
(33) Beattie, J. K.; Djerdjev, A. M. The pristine oil/water interface: surfactant-free hydroxide-charged emulsions. Angew. Chem., Int. Ed. 2004, 43 (27), 3568−71.
(34) Winter, B.; Faubel, M.; Vácha, R.; Jungwirth, P. Behavior of hydroxide at the water/vapor interface. Chem. Phys. Lett. 2009, 474 (4−6), 241−247.
(35) Petersen, P. B.; Saykally, R. J. Is the liquid water surface basic or acidic? Macroscopic vs. molecular-scale investigations. Chem. Phys. Lett. 2008, 458 (4−6), 255−261.
(36) Craster, R. V.; Matar, O. K.; Papageorgiou, D. T. Breakup of surfactant-laden jets above the critical micelle concentration. J. Fluid Mech. 2009, 629, 195−219.
(37) Kochurova, N. N.; Rusanov, A. I. Relaxation of the surface properties of aqueous solutions of surfactants and the mechanism of adsorption. Russ. Chem. Rev. 1993, 62 (12), 1083.
(38) Striolo, A. From Interfacial Water to Macroscopic Observables: A Review. Adsorpt. Sci. Technol. 2011, 29 (3), 211−258.
(39) Balasubramanian, S.; Pal, S.; Bagchi, B. Hydrogen-Bond Dynamics near a Micellar Surface: Origin of the Universal Slow Relaxation at Complex Aqueous Interfaces. Phys. Rev. Lett. 2002, 89 (11), 115505.
(40) Derks, D.; Aarts, D. G. A. L.; Bonn, D.; Lekkerkerker, H. N. W.; Imhof, A. Suppression of Thermally Excited Capillary Waves by Shear Flow. Phys. Rev. Lett. 2006, 97 (3), 038301.