HAL Id: hal-00956292
https://hal.archives-ouvertes.fr/hal-00956292
Preprint submitted on 6 Mar 2014
HAL is a multi-disciplinary open access archive for the deposit and dissemination of sci-entific research documents, whether they are pub-lished or not. The documents may come from
L’archive ouverte pluridisciplinaire HAL, est destinée au dépôt et à la diffusion de documents scientifiques de niveau recherche, publiés ou non, émanant des établissements d’enseignement et de
Nuclear reactors’ construction costs: The role of
lead-time, standardization and technological progress
Michel Berthélemy, Lina Escobar Rangel
To cite this version:
Michel Berthélemy, Lina Escobar Rangel. Nuclear reactors’ construction costs: The role of lead-time, standardization and technological progress. 2013. �hal-00956292�
Interdisciplinary Institute for Innovation
Nuclear reactors’ construction
costs: The role of lead-time,
standardization and technological
progress
Michel Berthélemy
Lina Escobar Rangel
Working Paper 14-ME-01
October 9, 2013
CERNA, MINES ParisTech 60 boulevard Saint Michel
Nuclear reactors’ construction costs:
The role of lead-time, standardization
and technological progress
Michel Berthélemy∗, Lina Escobar Rangel† October 9, 2013
Abstract
This paper provides the first comparative analysis of nuclear reactor construction costs in France and the United States. Studying the cost of nuclear power has often been a challenge, owing to the lack of reliable data sources and heterogeneity between countries, as well as the long time horizon which requires controlling for input prices and structural changes. We build a simultaneous system of equations for overnight costs and construction time (lead-time) to control for endogeneity, using expected demand variation as an instrument. We argue that benefits from nuclear reactor program standardization can arise through short term coordination gains, when the diversity of nuclear reactors’ technologies under construction is low, or through long term benefits from learning spillovers from past reactor construction experience, if those spillovers are limited to similar reactors. We find that overnight construction costs benefit directly from learning spillovers but that these spillovers are only significant for nuclear models built by the same Architect-Engineer (A-E). In addition, we show that the standardization of nuclear reactors under construction has an indirect and positive effect on construction costs through a reduction in lead-time, the latter being one of the main drivers of construction costs. Conversely, we also explore the possibility of learning by searching and find that, contrary to other energy technologies, innovation leads to construction costs increases
Keywords: nuclear power cost; lead-time learning effect; standardization
∗Centre d’Economie Industrielle. École des Mines de Paris. 75006, Paris, France. E-mail:
michel.berthelemy@mines-paristech.fr
†Centre d’Economie Industrielle. École des Mines de Paris. 75006, Paris, France. E-mail:
1
Introduction
Many countries have asserted their interest in building nuclear power plants either to ensure security of energy supply, meet CO2 emission reduction
targets, or both. This is the case for China, the Czech Republic, India,
Poland, Turkey, the United Kingdom (UK) and the United States (US) (IAEA,
2012). Nevertheless, uncertainties surrounding construction costs of new
nuclear reactors, along with risks associated with changes in the regulatory framework, have raised doubts about the competitiveness of this technology in both developed and developing countries and led to difficulties for the financing of nuclear new-build projects (Nuttall and Taylor, 2009).
The construction costs of nuclear reactors are particularly important for the competitiveness of nuclear power for two reasons. Firstly, nuclear power is a base-load electricity source with a construction time of, on average, 7.4 years in OECD countries (See Table 4 in Section 4). As such, construction costs can represent between 60 to 80% of the levelized cost of nuclear power (IEA, 2010). Secondly, there is still a sense of agreement that building the first reactor of a new design will come with specific fixed costs. In that respect, the rationale for building this first reactor -and sometimes the associated subsidies- is motivated by the assumption that construction costs will decrease as the industry benefits from learning effects
These risks and uncertainties are reflected in recent construction experience in OECD countries. For instance, while the initial cost estimate made by the French nuclear utility Electricité de France (EDF) in 2009 for the EPR nuclear reactor in Flamanville (France) was close to e3 billion (i.e. 2000
Ke2010/MWe), the latest announcement indicates that the costs may have
nearly tripled, up to e8.5 billion (i.e., 5100 Ke2010/MWe) 1
, and similar costs are expected for the EPR construction in Finland. In turn, other countries such as the UK, which have been considering the adoption of this technology, are reluctant to do so precisely because the costs estimates have increased and there remain large uncertainties about the possibility for EDF to derive learning by doing benefits from its current reactor’s construction for future projects.
Despite the significance of construction costs for nuclear power competitive margins, the economic literature has so far failed to provide clear empirical evidence of the determinants of these costs and the existence of learning effects, mainly due to the lack of comparable and reliable data. In particular, data on construction costs for the French nuclear program were only published in 2012 (Cour des Comptes (2012)). Before this date, existing estimates (Grubler, 2010), were based on extrapolations of annual investment expenditures of EDF.
1
EDF Press Release 12/03/2012 (last accessed 10 June 2013): http://press.edf.com/press-releases/all-press-releases/2012/flamanville-epr-costs-revised-still-on-schedule-93875.html
Most of the existing econometric studies have used data on US construction costs and attribute the escalation in costs to the increase in complexity of new reactors. Many authors argue that the experience gained by nuclear vendors led to the design of bigger and more complex reactors that took longer lead-times to construct and required closer regulatory monitoring (Komanoff (1981), Zimmerman (1982), Rothwell (1986), Cantor and Hewlett (1988) and Cooper (2012)). In the case of the French nuclear program, Grubler (2010) argues in favour of a negative learning by doing effect, whereas Escobar-Rangel and Leveque (2012) find evidence of learning within specific reactor models.
It is also generally accepted that the heterogeneity in the nuclear fleet and the multiplicity of vendors and utilities did not create the gains of learning by doing. David and Rothwell (1996)argue that the lack of standardization in the nuclear US fleet entailed ≪ ballooning≫ of construction costs, although some positive learning effects are found by Cantor and Hewlett (1988) and McCabe (1996) for construction projects managed by utilities.
In this paper, we propose the first empirical investigation of the role of standardization and learning opportunities on nuclear reactors’ construction
costs, using historical cost data from the US and France. This choice is
motivated by the fact that these two countries have followed different paths in terms of industrial structure and technological diversity. For instance, while in the US several firms have acted as Architect-Engineer (A-E) and vendors of nuclear reactors, these roles have been the responsibility of the utility EDF and Areva (formerly Framatome) in France, respectively. Similarly, if the two countries have both built Pressurized Water Reactors (PWR), France has implemented fewer technological variations compared to the US. This means that by looking at French and US experience together one can benefit from more heterogeneity in the data in order to derive robust estimates.
Our empirical strategy follows those of Rothwell (1986) and Cantor and Hewlett (1988), where a simultaneous equation model is estimated for
construction costs and lead-time using US data. However, our analysis
tackles a number of other empirical shortcomings. Firstly, our study allows direct comparison of nuclear reactors’ overnight construction costs in the two countries using the access to data2
on engineering and other related expenditures for French reactors, which are not detailed in the Cour des Comptes (2012) report. Secondly, we use an IV approach, using the expected demand as an instrument for lead-time (Cantor and Hewlett, 1988), and also test the hypothesis that some of the benefits of standardization may have an indirect impact on cost through a reduction in lead-time. Thirdly, we consider two potential benefits of nuclear programs standardization: (i) standardization
2
These data on overnight construction costs have been made available to the authors by EDF. As such they differ slightly from the data available in the Cour des Comptes’ report where expenditure regarding engineering work, pre-operating expenses, etc. are presented at an aggregated level
can have short term benefits on costs reductions through reduced diversity of designs for reactors under construction, leading to coordination gains; and (ii) standardization may also allow long term benefits through learning by doing spillovers from similar units built previously. In order to capture these spillover effects we differentiate spillovers based on reactor models and A-E firms.
In addition, the literature and policy debate has so far essentially focused on the role of experience through the study of learning by doing effects, in nuclear construction cost reduction. However, considering the importance of public R&D expenditures on nuclear power, an equally important policy question would be the influence of learning by searching. For instance, for many energy technologies, learning by searching has been highlighted as an important driver of energy cost reduction.
In the nuclear power sector, evidence of a positive learning by searching effect has only been found using cost and innovation data from energy economics modelling tools (Jamasb, 2007). In that respect, to the best of our knowledge, there is no existing literature that has looked at this effect using existing cost data. Hence, our study is the first to bring together data on nuclear power overnight construction costs and knowledge capabilities data, using original data from nuclear reactors’ costs in the US and in France, and a measure of the stock of knowledge based on patent data.
Our results suggest that standardization of nuclear reactors programs is one of the main factors in limiting costs escalation and takes place at two levels. Firstly, standardization benefits are found to originate from coordination gains induced by the diversity of reactors under construction. However, this effect impacts costs indirectly through a reduction in lead-time, which has a strong and significant impact on costs. This result is also confirmed in other OECD countries with different market structure and technological paths.
Secondly, we find that learning by doing spillovers also relate to some long term benefits of standardization, considering that these spillovers are limited to nuclear models built by the same A-E firm. This highlights the importance of reactor design standardization and the role played by the A-E firm in reducing construction costs increases.
On the other hand, we show that contrary to other energy technologies (Erickson and Drennen, 2006) there is a negative effect of learning by searching on reactors’ overnight construction costs. This can be explained by the fact that innovation in nuclear power technologies has been driven by nuclear safety considerations (Berthélemy, 2012a), leading to safer but more expensive nuclear reactors.
These results suggest paths for future cost reductions through greater standardization of reactor technologies and more emphasis on the role of A-E firms in improving the competitiveness of nuclear power. In parallel, from a
policy perspective one may argue that lead-time will play a more important role under a liberalized electricity market, where higher discount rates may apply, meaning that the competitiveness of nuclear power will be more conditional on the standardization of nuclear programs.
The ensuing sections of this paper are organized as follows: in Section 2 we present our research hypotheses along with stylized facts on the development and cost experience of nuclear power in the US and France; Section 3 describes our empirical strategy and the results; Section 4 further investigates international experiences with nuclear power construction using a larger dataset on nuclear power lead-time; and finally, Section 5 concludes.
2
Main hypotheses, data and stylized facts
2.1 Main hypotheses on the relation between construction
costs and lead-times
The construction of nuclear reactors is a complex process and requires the coordination of several firms, subject to monitoring and regulation from a nuclear safety regulator prior to, during and after the construction stage. Typically, following or not a tender, an electricity generation firm (hereafter the utility) places an order for the construction of a nuclear reactor and selects a specific reactor design offered by a nuclear vendor. This construction is then managed by an A-E firm which supervises the construction and
coordinates the multiple firms involved in the project. This includes the
constructor, the Nuclear Steam Supply System (NSSS) manufacturer, the turbine manufacturer, as well as a number of subcontractors. The allocation of firms’ responsibilities may differ between projects and, for instance, the utility may decide to also be the A-E (as it is the case in France and sometimes in the US).
One consequence of the involvement of multiple firms in the project is that the objective functions of these firms may differ (Rothwell, 1986). In particular, the A-E firm will minimize costs, whereas the utility will aim to maximize the net present value of the project. This means that the lead-time of the project becomes a decision variable for the utility as, for instance, it can decide to spend more on construction costs in order to reduce the construction period and derive revenue sooner.
From an empirical point of view, the construction cost will be determined by these two objective functions and will be jointly determined with lead-time, leading to a simultaneity problem and lead-time to enter into the cost equation. The inclusion of lead-time in the cost equation can be further motivated by the fact that there exists additional fixed costs associated with longer construction
periods, for instance, as utilities are generally in charge of project financing and due to immobilized construction equipment and labour force.
Consequently, OLS estimators will be biased. One solution consists of using an instrument variable approach in order to regain consistency. Our empirical strategy follows this approach with national expected demand (EDemi) of
electricity in country c as an instrument for lead-time (Cantor and Hewlett, 1988), considering that future demand impacts the net present value of the project but does not influence current construction costs.
Our baseline model specification follows equations (1) and (2) where Xi
is a vector of independent variables which can impact both cost (CTi) and
lead-time (LTi) and will be further presented in the next sub-section:
CTi = α0+ α1LTi+ J X j=2 αjXij + υi (1) LTi = β0+ β1EDemi+ J X j=2 βjXij+ ǫi (2)
2.2 Data and hypotheses regarding the effects of
standardiza-tion and learning opportunities
Data have been collected from a variety of sources. As mentioned in
the introduction, overnight construction costs are collected from the Cour des Comptes (2012) report, and adjustments have been made to account for engineering costs using additional data from EDF. For the US, overnight construction costs data have been published in the online Appendix of Koomey and Hultman (2007).
However, the US costs data are still more detailed as they take place at the reactor level, whereas the French data have been published for pairs of reactors. This can be explained by the fact that the French nuclear program has been organized with the joint construction of two reactors on the same site. We tackle this shortcoming of the data by treating each pair of French reactors as one reactor, with the average capacity of the two and the date when the latest reactor’s construction is completed as corresponding variables.
In parallel, data on nuclear reactor technical characteristics are collected from the IAEA Power Reactor Information System (PRIS) database. This covers the size of the reactor in MWe (Capi), that can be used to test the
existence of economies of scale, the year when the construction of the reactor
information on nuclear reactor cooling systems and containment structures3
, in order to define different reactor models. Additional data on A-E firms and initial operators are collected for the US from the US Nuclear Regulatory Commission (NRC). For France, these data do not require any specific access as EDF has always acted as the A-E firm and is the sole utility to operate nuclear reactors.
Based on these reactor level data on technology characteristics and industrial structure, we consider three main channels through which the organization of the nuclear industry can reduce cost and/or lead-time: (i) the standardization of reactor models under construction; (ii) learning by doing opportunities from past reactors’ construction; and (iii) learning by searching based on the discounted stock of nuclear specific patents
2.2.1 Hypotheses on the role of nuclear programs standardization
A number of efficiency gains may be expected from the standardization of nuclear programs. One aspect of standardization explored in the literature (David and Rothwell, 1996) relates to a trade-off between the ability to learn from diversity in nuclear reactors versus learning from similar models . This dimension of standardization will be covered by the learning opportunities hypotheses, where learning may be conditional on the level of standardization. In parallel, one may also argue that standardization benefits can arise from the diversity of nuclear reactors under-construction. We expect that a country with low diversity in models of nuclear reactors under-construction could benefit from coordination gains during the construction period. This can be motivated by the fact that similar high-tech components will be built during the same period, such as steam generators or turbines, leading to economies of scale. Similarly, a low diversity in reactors under-construction also lowers technological uncertainty. To measure this potential benefit of standardization during the construction period, we compute a Herfindahl Hirschman Index (HHI) index based on the number of specific reactor models under-construction when the construction of reactor starts.
This index is defined according to equation (3) as the sum of the squares of the market shares of the M reactor models under-construction in country c and year t. To capture this expected benefit of standardization, we also control for the number of reactors under-construction (N P P.U Ci) as, for instance, a high
HHI could either correspond to a situation where only one reactor is under-construction or to a situation where multiple and similar reactors are being built.
3
Data about nuclear reactors cooling system and containment structure are detailed in the Appendix C
HHIc,t= M
X
m=1
s2mtc (3)
2.2.2 Hypotheses on learning by doing opportunities
Because nuclear reactors are complex units, the ability to derive learning effects may be conditional to the similarities between reactors models and the A-E which builds reactors. In that respect, we hypothesize that experience
spillovers can take place through two main channels: nuclear reactors
completed by the same A-E firm (ExpArqi) and nuclear reactors of the same
design completed (ExpM oi).
Furthermore, spillover might also be conditional on the A-E firm experience
with specific nuclear design (ExpArqM oi). One could argue that this
corresponds to the second potential benefit of standardization mentioned above, where the ability to derive learning by doing spillover is conditional on the standardization path followed by the nuclear industry, and this could be interpreted an indirect benefit of reactor standardization (David and Rothwell, 1996).
This more restricted level of learning by doing opportunities is defined following the traditional definition used in the literature (Irwin and Klenow, 1994). For instance, in equation (4) we consider that country level experience (ExoCi) can be disentangle into four level of learning spillovers: (i) The
experience of the A-E with the reactor model (ExpArqM oi), (ii) the experience
of the A-E with other models (ExpArqN oM oi), (iii), the experience of other
A-Es with the same model (ExpN oArqM oi) and (iv) the experience of other
A-Es with other models (ExpN oArqN oM oi)
ExpCi= ExpArqM oi+ ExpArqN oM oi+ ExpN oArqM oi+ ExpN oArqN oM oi (4)
2.2.3 Hypotheses on leaning by searching
In parallel to the learning by doing hypothesis, one standard hypothesis made in the energy economics literature is that learning by doing might not be the only source of learning. In particular, learning by searching is often found in many empirical studies dealing with the energy sector e.g., (Larsen and Sundqvist, 2005); (Erickson and Drennen, 2006) to contribute to cost reduction. In the case of nuclear power, the impact of innovation activity on cost remains an empirical question. On one hand, there exists evidence (Jamasb, 2007) that innovation may contribute to cost reduction. On the other hand, innovation in nuclear power essentially deals with safety improvements
because of the role of safety regulation. As such, innovation might lead to safer, but more complex and more expensive nuclear reactors.
As a proxy for nuclear innovation, we rely on a unique dataset on nuclear specific patents, using a discounted stock of priority patent applications. This discounted stock is set at the country level, reflecting the fact that innovation can originate both from R&D laboratories and nuclear vendors and can be understood to reflect national knowledge capabilities. We set the discount factor at 10%, a conservative parameter found in many studies on the dynamics of innovation (Peri, 2005).
2.2.4 Instrument and Control variables
As aforementioned, we also use the expected demand of electricity as an instrument for lead-time, using the three year trend in future electricity consumption, and we control for the possibility of structural breaks following two major nuclear accidents: Three Mile Island (TMI) in 1979 and Chernobyl in 1986. Because, the TMI accident took place in the US, we also investigate for the possibility that this accident has had a heterogeneous effect in the two countries, with country specific TMI dummy variables.
Finally, we collect data on prices for two major inputs to the construction of nuclear reactors: cement and labour force. These data are collected from the French National Statistics Institute (INSEE) and the US Census Bureau respectively for the two countries. All the definitions and descriptive statistics for our relevant variables are summarized in Table 1 below.
2.3 Stylized facts
Figure 1 below highlights the strong differences between the trend in overnight construction costs in France and in the US. In particular, we observe that over the entire time period the costs have more than doubled in France, from 920e/MWe in 1980 for the Tricastin 3 and 4 reactors up to 2200e/MWe in 2000 for the Chooz 1 and 2 reactors. In the US, this increase has been much more rapid with the cost almost increasing by a factor of 14 from 600e/MWe in 1972 for Turkey Point 3 up to 8500e/MWe in 1989 for the Shoreham reactor. One can also note that costs have been much more dispersed in the US. For instance, if we look at nuclear reactors completed in 1986 in the US, the costs range from 2000e/MWe for Catawba 2 and 6250e/MWe for the Hope Creek reactor. Since France and the US have experienced important differences in terms of industrial structure choices during this period, with more vertical integration and standardization of nuclear reactor designs for France, this figure provides initial suggestions that the French experience has been more successful in containing the escalation of construction costs. However, to
Table 1: Descriptive statistics
Variable Definition Mean Std. Dev. Min Max CT Cost in e2010/MWe 2282 1.639 599 8571
LT Construction time 8.578 3.507 4.3 23.3 Cap Size in MWe 992.390 201.854 478 1472.5 HHI.M o Standardization of
reac-tors under-construction
0.230 0.171 0.122 1 Know Discounted stock of
nu-clear patents
582.51 103.96 326.48 903.39 ExpArqM o Experience A-E model
(# reactors)
1.695 2.672 0 14 ExpArqN oM o Experience A-E diff
model(# reactors)
9.867 13.162 0 54 ExpN oArqM o Experience diff A-E
model (# reactors)
2.921 4.073 0 18 ExpN oArqN oM o Experience diff A-E diff
model (# reactors)
27.414 25.731 0 87 Arq.U tility Vertical integration A-E
with utility
0.382 0.487 0 1 Cement Cement cost index 88.019 31.571 36.8 186.556 Labour Labour cost index 247.568 168.027 87.439 921.968 EDem Future electricity
de-mand (3 year trend)
.043 .010 .017 .061 N P P.U C Reactors
under-construction
42.632 20.747 2 69
explain the determinants behind construction costs and establish causality one has to develop a structural econometric framework, which we do in the next section.
Figure 1: Nuclear reactors’ overnight construction costs in the US and France
Figure 2 below. In this figure we plot the construction time (in years) of nuclear reactors in the two countries. One can generally notice that we observe the same trend as in the previous figure presenting construction costs: construction
time has increased more rapidly in the US than in France. This can be
understood by the fact that long construction time will generate additional costs owing to immobilized equipment and labour force. This may also reflect complexity of nuclear design, leading both to more expensive reactors and longer construction times.
Figure 2: Nuclear reactors’construction lead-time in the US and France
The increase in lead-time still appears to be of a lower magnitude than the increase in cost. For instance, lead-time in the US ranges from 5 years for the Vermont Yankee reactor, up to 23.3 years for the Watts Bar 1 reactor, which represents a 5-fold increase.
Finally, Figure 3 below presents the timing of nuclear reactors construction (in MWe of new installed capacity) in France and in the US. Although the US nuclear program was initiated in the early 1960s, about 10 years before the French program we have excluded the turnkey reactors done in this first decade. The French nuclear program was initiated latter in the early 1970s as a reaction of the first oil shock.
Figure 3: Nuclear power installed capacity in MWe
variations over time. For instance, in the US the newly installed capacity dropped following the Three Mile Island (TMI) nuclear accident in 1979, which might be due to ensuing changes in safety regulation. Only two reactors have been completed in the US since 1990. Popular explanations for this change have been the counter oil shock of 1986, the liberalization of the US electricity market during the 1990s which shifted the allocation of construction risks from the consumers toward electricity producers, along with more stringent safety regulation.
In France, reactors were built essentially during the 1970s and the 1990s. Similarly to the case of the US, only two reactors have been completed since the early 1990s. However, the explanation for the lack of construction of new nuclear reactors might be somewhat different as the share of nuclear power in the French electricity mix had reached 75% by 2000, leading to lower incentives to build new reactors.
3
Model specifications and results: France versus the
US
3.1 Model specifications
The simultaneous system of equations used to study construction costs and lead-time follows a Cobb-Douglas functional form4
, taking into account the
4
This functional form that has been extensively used in the literature on nuclear construction costs e.g. Komanoff (1981); Cantor and Hewlett (1988), McCabe (1996)
endogeneity of lead-time using expected demand of electricity as an instrument and controlling for the effects of capacity and input prices. A set of explanatory variables to identify learning effects are included, as well as the HHI index for short term standardization and dummy variables to differentiate projects managed or not by the utility, to capture the effect of structural breaks due to major nuclear accidents and to control for temporal and country fixed-effects. Based on equations (1) and (2), the equations for the baseline model specification are as follows:
ln(CTi) = α0+ α1ln(LTi) + α2ln(Capi) + α3ln(Cement) + α4ln(Labour)+
α5ArqU tilityi+ α6ExpArqM oi+ α7ExpArqN oM oi+ α8ExpN oArqM oi+
α9ExpN oArqN oM oi+ α10HHI.M oi+ α11N N P.U C+
α12T mi.U S+ α13T mi.F R+ α14Country+ α15T rend+ υi (5)
ln(LTi) = β0+ β1ln(Capi) + β2ArqU tilityi+ β3ExpArqM oi+ β4ExpArqN oM oi
+ β5ExpN oArqM oi+ β6ExpN oArqN oM oi+ β7HHI.M oi
+ β8ln(EDem) + β9N P P.U C+ β10T mi.U S+ β11T mi.F R
+ β12Country+ β13T rend+ ǫi (6)
As aforementioned, our empirical strategy follows Rothwell (1986) struc-tural model which justifies the inclusion of lead-time in the cost equation as an endogenous variable. In his model, the utility chooses the construction lead-time to maximize the net present value of the plant and then the constructor minimizes the costs within this constraint. Moreover, Cantor and Hewlett (1988) argue that there are unobserved factors captured in the lead-times that are likely to affect the costs, such as the risks of changes in safety regulations during construction, or potential rise of hiring expenses due to long delays.
Recall that the HHI.M o measures the technological diversity in each country at the moment at which the construction of each reactor began. If this index is close to one, it means that in that year only one type of reactor was being built.
3.2 Results
The estimated output for equations (5) and (6) are presented in Tables 2 and 3 below, using four different model specifications. Estimation output of the cost and lead-time equations in Model 1 represents our baseline estimate. In this model, we make the hypothesis that learning by doing exists at the A-E firm level and for specific nuclear models. In Model 2, we consider the possibility of learning by searching in addition to standardization and learning
by doing. Model 3 focuses on the learning effects at the A-E firm level, and we aggregate the experience of the A-E firm regardless of the reactor model. Finally, Model 4 considers the experience at the reactor model level, regardless of the A-E firm.
The first result of our analysis refers to the importance of model specification in identifying significant learning effects in the construction of nuclear power plants. Previous studies account for the experience at the firm level as in Model 3 or at the technological level as in Model 4. However as we can see in Tables 2 and 3, the learning effects are positive and significant only when we take into account solely the experience of A-E firms with specific models of reactor (ExpArqM oi). After taking into account the effect
of ExpArqM oi on lead-time, the point estimate of our baseline model (1)
indicates that when this specific experience increases by 1%, costs are reduced by -0.142+1.933*0.009 = 0.124%.
In other words we find that, everything being equal, one can expect on average a 12.4% reduction in construction costs for the second unit of a reactor model built by the same A-E firm.
This result is in line with what is expected from the economic literature on learning effects and recent evidence (Escobar-Rangel and Leveque, 2012) on the French nuclear fleet and or confirmed using different model specifications as shown in Appendix A5
. From a policy perspective, it is important to highlight that the benefits that a firm can derive from standardization in terms of reduction in construction costs, after building the first reactor of a series, requires long term commitment precisely because the construction of a nuclear power plant is a lengthy project.
Regarding the learning effects in the lead-time equation, we find that experience in the construction of other models, either of the same firm (ExpArqN oM oi) or of others (ExpN oArqN oM oi), has a negative impact on
the construction periods which translates into an increase in the construction costs. This result shows that, due to the complexity of a nuclear reactor and the importance of A-E firms in construction projects, it is not possible to directly transfer previous knowledge and experience gained on the construction of any type of reactor to the new projects
This detrimental effect of model diversity also leads to short term benefits of standardization. The estimate for the HHI.M oi index suggests that an
increase in the diversity of models under construction in a given year (i.e. HHI smaller than 1), increases construction costs indirectly through lead-time,
5
For robustness tests we consider, in Appendix A, country specific time trends (with a quadratic term) in order to control, for instance, for time variant changes in safety regulation in France and the US. We also define the learning by doing variables as 1/(1+X) instead of ln(X) as both model specifications have been used in the literature (Joskow and Rose, 1985). Our results remain unchanged
Table 2: Estimation output of equations (1) and (2)
Model 1 Model 2
Cost Lead-time Cost Lead-time
ln(Capi) -0.769 *** 0.125 ** -0.624 *** 0.125 ** (0.192) (0.053) (0.182) (0.0531) ln(Cementi) 0.126 0.0882 (0.469) (0.424) ln(Labouri) -1.375 -0.771 (0.852) (0.806) ln(LTi) 1.933 *** 1.064 * (0.580) (0.622) ExpArqM oi -0.142 *** 0.009 -0.149 *** 0.009 (0.038) (0.011) (0.034) (0.011) ExpArqN oM oi 0.025 0.026 *** 0.029 0.026 *** (0.034) (0.009) (0.031) (0.009) ExpN oArqM oi 0.046 0.010 0.038 0.010 (0.039) (0.012) (0.035) (0.012) ExpN oArqN oM oi -0.068 0.141 *** -0.039 0.141 *** (0.096) (0.017) (0.087) (0.017) Knowi 1.416 *** (0.522) HHI.M oi 0.454 -0.566 *** 0.374 -0.566 *** (0.537) (0.160) (0.485) (0.160) N P P.U Ci 0.313 *** -0.071 ** 0.324 *** -0.071 ** (0.117) (0.034) (0.105) (0.034) ArqU tilityi -0.256 *** 0.009 -0.285 *** 0.009 (0.093) (0.028) (0.085) (0.028) ln(EDemi) -1.235 *** -1.235 *** (0.113) (0.113) T mi.U S -0.058 0.272 *** 0.115 0.272 *** (0.184) (0.0431) (0.179) (0.043) T mi.F R -0.015 -0.028 -0.064 -0.028 (0.246) (0.074) (0.223) (0.074) CH -0.077 0.058 * -0.030 0.058 * (0.123) (0.031) (0.113) (0.031) Constant 6.420 ** -2.347 *** -4.182 -2.347 *** (2.915) (0.448) (4.767) (0.448)
Country FE Yes Yes Yes Yes
Trend + trend2 Yes Yes Yes Yes
Obs. 128 128 128 128
Adj. R2
Table 3: Estimation output of equations (1) and (2)
Model 3 Model 4
Cost Lead-time Cost Lead-time
ln(Capi) -0.680 *** 0.121 ** -0.716 *** 0.102 ** (0.196) (0.052) (0.191) (0.048) ln(Cementi) 0.038 0.070 (0.480) (0.457) ln(Labouri) -1.183 -1.071 (0.883) (0.722) ln(LTi) 1.910 *** 1.808 *** (0.605) (0.499) ln(ExpArq) -0.049 0.030 *** (0.037) (0.010) ln.ExpN oArq -0.068 0.139 *** (0.098) (0.016) ln.ExpM o -0.055 0.018 ** (0.034) (0.008) ln.ExpN oM o -0.061 0.164 *** (0.093) (0.016) HHI.M o 0.599 -0.575 *** 0.619 -0.231 * (0.556) (0.158) (0.560) (0.139) ln.N P P.U C 0.332 ***-0.0751 ** 0.337 *** -0.076 ** (0.123) (0.033) (0.114) (0.030) Arq.U tility -0.319 *** 0.012 -0.253 *** -0.010 (0.095) (0.027) (0.082) (0.022) ln.Demand -1.228 *** -1.228 *** (0.111) (0.100) T mi.U S -0.102 0.285 *** -0.116 0.293 *** (0.193) (0.041) (0.198) (0.038) T mi.F R 0.051 -0.020 0.085 -0.228 *** (0.255) (0.073) (0.276) (0.069) CH -0.060 0.065 ** 0.004 0.046 * (0.129) (0.030) (0.124) (0.027) Constant 5.281 * -2.295 *** 5.067 * -2.313 *** (3.015) (0.443) (2.799) (0.396)
Country FE Yes Yes Yes Yes
Trend + trend2 Yes Yes Yes Yes
Obs. 128 128 128 128
considering that lead-time is found to have a strong and significant impact on costs.
This result can be explained by the fact that when the diversity of nuclear reactors is high, the nuclear safety authority has to assess the potential risks of different models of reactors which prevents rapid monitoring and licensing procedures, due to the heterogeneity in demand which could lead to supply chain constraints and construction delays. As such, it is rational to find that this short term effect impacts primarily the lead-time equation.
Given the nature of these three results, one may argue that the lack of standardization harms the competitiveness of nuclear power in two ways. Firstly, it reduces the potential gains in terms of costs savings in the long term, through learning by doing at the firm level. Secondly, it tends to increase the construction lead-times and therefore the construction costs in the short term. In addition, the results highlight positive and significant economies of scale. Indeed, we find that larger nuclear reactors take longer to build but are also cheaper per MWe. The net effect on cost can be derived from offsetting the direct effect on cost with the indirect effect on lead-time. For instance, Model 1 indicates a net impact of -0.769+(1.933*0.125)= -0.527. This coefficient can be interpreted as an elasticity, meaning that a 10% increase in size reduces construction costs by 5.27%.
With respect to the role of A-E firms, we also show that when a utility takes the A-E firm responsibility, construction costs are lower than when a project is managed by another firm. This result has been identified in previous studies (e.g. Cantor and Hewlett (1988) and McCabe (1996)) and it can be understood by the fact that a vertically integrated utility reduces potential asymmetric information problems between the utility and the firms involved in the construction of nuclear reactors, leading to cost reductions.
In Table 2 we also present the results for Model 2, which in addition to the variables in Model 1 includes the discounted stock of priority patent applications (Knowi) in order to capture the effect of innovation
on construction costs. The positive estimate found is contradictory to the pattern observed in many energy technologies, such as other renewable energy sources (Erickson and Drennen, 2006). This can be explained by the fact that innovation has been driven by the requirements of nuclear safety authorities (Berthélemy, 2012a), leading to improvements in the safety performance of existing reactors (Berthélemy, 2012b).
In other words, this highlights the long term trade-off faced by the nuclear power sector: on the one hand innovation is needed to reduce the externalities associated with nuclear accident risks; on the other hand this innovation hampers the competitiveness of nuclear power through an increase in construction costs.
One can also note that this result is contrary to the initial findings of Jamasb (2007) who relies on data extracted from energy modelling tools. Hence, from a methodological perspective this result stresses the necessity of looking at real cost data before drawing policy conclusions on energy technologies costs trajectories.
Finally, it is important to analyze the effect of the major nuclear accidents in our system of equations. As we can see in Table 3, the impact on the construction costs both in the US and in France due to TMI and Chernobyl (CH) came indirectly from an increase in lead-time. Logically, TMI primarily impacted the US where this reactor was located and had no significant impact on France. Chernobyl, which took place in the Ukraine, had a positive and significant impact, albeit at the 10% level, on lead-time in the two countries. This result suggests that closer monitoring from nuclear safety authorities following these accidents resulted in delays in the construction of the reactors installed afterwards.
4
Nuclear reactors lead-time: Insights from other
OECD countries
Given the close relationship between the construction costs and lead-time and the importance of the latter in nuclear power future deployment, in this section we further investigate the impact of capacity, experience and standardization on lead-time using a larger dataset on nuclear reactors from 6 OECD countries. Our aim is to gain some insights into the construction of other nuclear fleets for which cost information is not available, and to identify if the results from the US and the French experience also apply to other OECD countries which have followed different paths in terms of technological choices and industrial structure.
4.1 The role of lead-time under liberalized electricity markets
As shown in the previous section, the increase in construction lead-times has been one of the main drivers of the capital costs escalation in nuclear power both in the US and France. However, in addition to the effect on construction costs, an increase in lead-times also means a delay in revenues for the investors and an increase in the interim interest rates. This gives lead-time a stronger role in the competitiveness of nuclear power in liberalized electricity markets where revenues for nuclear reactors’ operators are derived from wholesale markets and not from rates of return regulation.
In addition, from a microeconomic perspective, private investors tend to employ higher discount rates than those used for public infrastructure. This
implies that one might prefer to build a CCGT gas plant that can be planned and built in 2 years and be willing to face the fossil fuel and carbon price risk, instead of waiting more than 7 years (in the best case scenario) to start recovering their investments (MacKerron, 2004). In addition, the uncertainty of longer construction periods increases the difficulty of financing new nuclear capacity in liberalized electricity market (Nuttall and Taylor, 2009); (Kessides, 2012) due to possible cost overruns.
Furthermore, in liberalized electricity markets the private option value that carbon-free nuclear power generation could bring, as a hedge against changes in gas or CO2 emissions, will most likely disappear because of the strong correlation between electricity, gas and carbon prices (F Roques and de Neufville, 2006).
Nuclear reactors lead-time can also have some macroeconomic implications, in particular if one also considers the pre-construction period necessary to receive the authorization to build a reactor, which means that a nuclear project can take between 10 to 15 years between the start of the planning process and the end of construction. In this sense, the risk of delays in the construction process might encourage a wait-and-see policy, as by the time the new nuclear power plant starts generating electricity it would be reasonable to expect alternative technologies to have reduced their costs and become more competitive.
4.2 Data and Model
The data used are also extracted from the Power Reactor Information System (PRIS) database developed by the IAEA . Similarly to the previous section, lead-time is computed as the difference in years between the construction and grid dates, and commercial reactors in 6 OECD countries are considered: the US, France, Canada, South Korea, Japan and the UK. Note that contrary to the previous section, we can make full use of the French data as, contrary to costs data, lead-time is available at the reactor level.
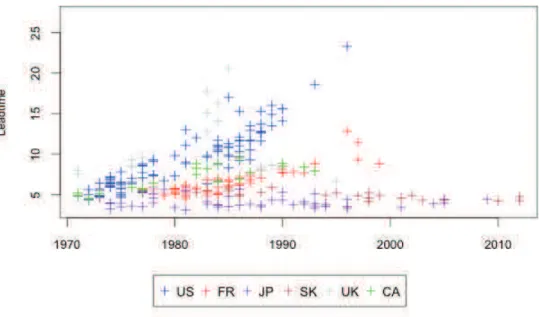
Figure 4 and Table 4 below highlight that the heterogeneity across our sample is substantial. This feature is understandable given the differences between countries and across years, in terms of labour productivity, regulatory licensing process, stage of development of construction techniques, etc. To capture these effects, we have included in our model a fixed effect for each country as well as a time trend and a quadratic term for the time trend.
In the next table, we present the means for the explanatory variables that we have chosen to use in our regression model. As we can see, differences in the lead-time means between the Western and Asian countries are substantial. For Japan and South Korea the construction of a new reactor took only 4 years
!
Figure 4: Nuclear reactors’ construction lead-time in OCDE countries
approximately, whereas in the US or in the UK took more than the double, even when the average size of the reactors is similar.
Table 4: Mean for the explanatory variables
Obs. LT ExpArqM o HHI Cap
(in year) (#reactors) (index) (in MWe)
France 58 6.45 9.13 0.472 1083 Canada 22 7.07 2.29 0.361 687 South Korea 23 4.90 4.04 0.672 895.3 Japan 50 4.10 3 0.341 919.1 U.K 17 8.63 4.80 0.861 645.1 U.S 98 9.27 2.10 0.152 972.4 All Countries 291 7.41 4.12 0.378 934.4
Table 4 presents the average of the explanatory variable used in the regression. Differences in the lead-time average between Western and Asian countries are substantial. For Japan and South Korea the construction of a new reactor took only approximately 4 years, whereas in the US or in the UK it took more than twice as long, even when the average size of the reactors was similar. Important heterogeneity can also be observed for short term HHI.M oi
and long term ExpArqM oi average level of standardization.
In Table 5 below we present the estimates similar to equation (4.6) in
and the structural break dummies as controls. Two model specifications are considered, the second one introduces time fixed effects. Other robustness tests can also be found in Appendix B6
.
Table 5: Regression results for lead-time with experience and the HHI index
(1) (2) Variables (ln LT ) (ln LT ) HHI.M oi -0.291 ** -0.472 *** (0.135) (0.182) ln Capi 0.395 *** 0.254 *** (0.052) (0.052) ExpArqM oi 0.019 -0.008 (0.032) (0.029) ln EDemi -16.970 *** -21.219 *** (2.866) (3.265) ln N P P.U Ci -0.020 -0.054 (0.033) (0.047) T mi.U S 0.432 ** 0.439 *** (0.044) (0.062) T mi.Abroad 0.139 *** 0.142 ** (0.054) (0.061) Cherno 0.188 *** 0.214 *** (0.029) (0.027) Constant 1.105 *** 1.977 (0.402) (0.440)
Country FE Yes Yes
Time FE No Yes
Trend + Trend2 Yes No
Obs. 286 286
Adj. R2 0.840 0.869
Note: Robust standard errors in parentheses
These estimates show that increasing the size of the reactor has a positive and significant effect on lead-time. On average we have found an increase of 3% when scaling up by 10%. This result confirms the importance of offsetting the scale effects in the cost equation, as although increasing the size of the reactor means lower costs per MWe, the net effect should take into account the increase in the lead-time.
This model also confirms the insights from the previous section in terms of our HHI diversity index. Recall that high values of this index mean more market concentration, which in our case corresponds to a more standardized nuclear fleet. On the basis of the analysis using the lead-time, there is strong and significant evidence that reducing the diversity of the nuclear fleet is one of the major differences between countries with longer lead-times and those
6
In Appendix B we consider the four learning spillovers channels used in Section 3 and also define them both as 1/(1 + X) and ln(X). The results remain unchanged
with shorter construction periods.
One can also notice the negative effect of the two major nuclear accidents on the construction lead-time. Both TMI and Chernobyl were found to be significant structural breaks, showing that these events have an influence beyond borders. As expected, the effect of TMI is stronger on the US compared to other countries.
5
Conclusion
In this paper we study the short and long term benefits of nuclear reactor standardization on the construction costs of nuclear reactors in the US and France between 1966 and 2002 using overnight construction costs data. Short term benefits are defined as the gains based on the diversity of nuclear reactors under construction, whereas long term benefits represent learning by doing spillovers from similar reactors. We build a system of equations to control for endogeneity between costs and lead-time, using the expected demand of electricity as an instrument for lead-time and control for input prices and the possibility of structural breaks following major nuclear accidents.
We show that short term gains from standardization have a positive impact on construction costs through a reduction in lead-time, the latter being one of the main drivers of construction costs in France and the US. This result is also confirmed for a range of other OECD countries with heterogeneous nuclear programs, and can be explained by the fact that the diversity of nuclear reactor models can lead to delays owing to supply line constraints or delays due to increased workload for the nuclear safety regulator. From a policy perspective, as liberalized electricity markets will tend to apply higher discount rates to nuclear new-build projects appraisal, we further argue that standardization of nuclear reactors will be a key criterion for the economic competitiveness of merchant nuclear reactors.
At the same time, we demonstrate that learning by doing spillovers are also conditional on the standardization of nuclear programs, considering that learning by doing spillovers only take place through reactors of the same model built by the same Architect-Engineer (A-E) firm. Regarding the role of the A-E firm, we also show that vertical integration of the utility and the A-E firm reduces construction costs, which can be explained by a reduction in the asymmetric information of the utility regarding costs.
Conversely, if we stress that lead-time contributes to construction costs reduction and has a stronger impact under liberalized electricity markets, this result may change for other determinants of construction costs. For example, we find evidence of economies of scale for construction costs, whereas from an investment perspective C Gollier and Walgenwitz (2005) show that Small
and Medium Reactors (SMRs) will generate a significant option value when electricity prices are uncertain. In other words, investors may have to trade-off the economic gains associated with economies of scale for large reactors with the option value of SMRs. This calls for more research on the optimal size of nuclear reactors.
In parallel, we also find that the discounted stock of patents in the nuclear industry increases construction costs, reflecting the fact that innovation increases the complexity of nuclear reactors. This result is in direct contrast to the pattern in other energy technologies where technical progress contributes to costs reductions, and can be explained by the importance of safety regulation in the nuclear power sector which improves safety performance (Berthélemy, 2012b), at the expense of increases in construction costs. This result is not without implications for the design of energy economics modelling tools, as the existing literature has shown that certain models’ calibration (Jamasb, 2007) implicitly assumes that nuclear construction costs benefit from innovation
effort. This result highlights the importance of building these models on
evidence based on actual cost data.
However, even if our results highlight the benefit of nuclear programs standardization and suggest that innovation effort contributes to costs increases, they do not answer the question of the optimal pace of technological change in nuclear power technologies. In other words, there exists a trade-off between reductions in costs permitted by standardization and potential gains from adopting new technologies with better operating and safety
performance. In addition, using patent data as a measure of innovation
captures incremental innovation but fails to consider the possibility of radical technological change. In that respect, nuclear power has been characterized by incremental innovations from initial reactor designs in the 1950s. Radical innovations such as 4th generation of nuclear reactors could, on the other hand, contribute to costs reductions.
It is also important to note that safety regulation can impact construction costs and lead-time through dimensions other than technological change. In particular, the scope of standardization partly depends on the evolution of the safety rules in each country. This is reported to be the case in the US where, according to Cooper (2010), the increase in safety regulations issued by the NRC grew substantially following TMI (e.g. from three safety guidelines in 1970 to 143 by 1978), limiting the ability of nuclear vendors to standardize nuclear reactors as they had to comply with changes in safety rules.
Hence, the US experience shows that safety regulation can have important consequences on the economic competitiveness of nuclear reactors. In that respect, standardization and safety regulation do not have to be per-se incompatible and one could argue that for a given level of safety effort, nuclear safety regulation should be designed in order to allow nuclear reactors to benefit
more from standardization gains.
This would necessitate institutional reforms. One possibility would be to reinforce nuclear reactor certification procedures through cooperation between national nuclear authorities, meaning that a nuclear reactor design can be certified jointly in several countries. This would represent a change from the current regulatory framework where each national safety authority issues design certification with its own specification requests and different timeframes.
References
Berthélemy, M. (2012a), Innovation, learning by doing opportunities and nuclear reactors’ performance. Unpublished manuscript.
Berthélemy, M. (2012b), What drives innovation in nuclear power technologies? an empirical study based in patent counts. Unpublished manuscript. C Gollier, D Proult, F. T. and Walgenwitz, G. (2005), ‘Choice of nuclear power
investments under price uncertainty: valuing modularity’, Energy Economics 27, 667–685.
Cantor, R. and Hewlett, J. (1988), ‘The economics of nuclear power: Further evidence on learning, economics of scale and regulatory effects’, Resources and Energy 10, 315–335.
Cooper, M. (2010), Policy challenges of nuclear reactor construction, cost escalation and crowding out alternatives. Unpublished manuscript.
Cooper, M. (2012), Nuclear safety and nuclear economics. Unpublished
manuscript.
David, P. and Rothwell, G. (1996), ‘Standardization, diversity and learning: Strategies for the coevolution of technology and industrial capacity’, International Journal of Industrial Organization 14, 181–201.
des Comptes, C. (2012), Les coûts de la filière électronucléaire, Technical report, Cour des Comptes.
Erickson, P. K. J. and Drennen, T. (2006), ‘Technological learning and renewable energy costs: implications for us renewable energy policy’, Energy Policy 34, 1645–1658.
Escobar-Rangel, L. and Leveque, F. (2012), Revisiting the cost escalation curse of nuclear power: New lessons from the french experience. Unpublished manuscript.
F Roques, W Nuttall, D. N. and de Neufville, R. (2006), ‘Nuclear power: a hedge against uncertain gas and carbon prices?’, The Energy Journal 24, 1– 24.
Grubler, A. (2010), ‘The cost of the french nuclear scale-up: A case of negative learning by doing’, Energy Policy 38, 5174–5188.
IAEA (2012), Country nuclear power profiles, Technical report, IAEA. IEA (2010), Projected costs of generating electricity: 2010 edition, Technical
report, IEA.
Jamasb, T. (2007), ‘Technical change theory and learning curves: Patterns of progress in electricity generation technologies’, The Energy Journal 28, 51– 71.
Kessides, I. (2012), ‘The future of the nuclear industry reconsidered: Risk, uncertainties and continued promise’, Energy Policy 48, 185–208.
Komanoff, C. (1981), Power Plant Cost Escalation Nuclear and Coal Cost, Regulation and Economics, Van Nostrand Reinhold Publishing.
Koomey, J. and Hultman, N. (2007), ‘A reactor-level analysis if busbar cost for the us nuclear plants 1970-2005’, Energy Policy 35, 5630–5642.
Larsen, G. K. A. M. K. and Sundqvist, T. (2005), ‘The impact of r&d on innovation for wind energy in denmark, germany and the united kingdom’, Ecological Economics 54, 227–71.
MacKerron, G. (2004), ‘Nuclear power and the characteristics of ’ordinariness’ - the case of uk energy policy’, Energy Policy 32, 1957Ð1965.
McCabe, M. (1996), ‘Principals, agents and the learning curve: The case of steam-electric power plant design and construction’, The Journal of Industrial Economics XLIV, 357–375.
Nuttall, W. and Taylor, S. (2009), ‘Financing the nuclear renaissance?’, European Review of Energy Markets 2, 187–202.
Peri, G. (2005), ‘Determinants of knowledge flows and their effect on innovation’, The Review of Economics and Statistics 87, 308–322.
Rothwell, G. (1986), ‘Steam-electric scale economies and construction lead times’, CalTech working paper 63.
Zimmerman, M. (1982), ‘Learning effects and the commercialization of new technologies: The case of nuclear power’, The Bell Journal of Economics 13, 297–310.
Appendix A
Robustness checks for the model of
costs and lead-times
Table 6: Alternative model specifications for Equations (5) and (6)
Model 5 Model 6
Cost Lead-time Cost Lead-time
HHI.M o 1.249 ** -0.400 *** 0.247 -0.444 ** (0.490) (0.141) (0.481) (0.185) ln ExpArqM o -0.153 *** 0.005 (0.041) (0.011) ln ExpArqN oM o 0.028 0.024 ** (0.035) (0.009) ln ExpN oArqM o 0.0461 0.014 (0.041) (0.011) ln ExpN oArqN oM o -0.095 0.152 *** (0.103) (0.017) Inv.ExpArqM o 0.335 *** -0.025 (0.067) (0.027) Inv.ExpArqN oM o -0.097 -0.007 (0.080) (0.032) Inv.ExpN oArqM o -0.150 * -0.016 (0.079) (0.032) Inv.ExpN oArqN oM o 0.181 -0.337 *** (0.245) (0.076) ln Know 1.291 ** (0.598) ln Cap -0.839 *** 0.117 ** -0.609 *** 0.174 *** (0.221) (0.050) (0.182) (0.061) ln N P P.U C 0.498 *** -0.101 ** 0.318 *** -0.040 (0.182) (0.043) (0.105) (0.040) Arq.U tility -0.255 *** -0.008 -0.292 *** 0.024 (0.096) (0.027) (0.087) (0.034) ln EDem -1.202 *** -1.467 *** (0.108) (0.125) ln LT 2.270 *** 1.133 * (0.820) (0.686) ln Cement 0.392 0.003 (0.538) (0.359) ln Labour -2.020 -0.710 (1.365) (0.808) T mi.U S -0.055 0.292 *** 0.075 0.300 *** (0.197) (0.041) (0.177) (0.049) T mi.F R -0.001 -0.053 -0.184 -0.004 (0.252) (0.071) (0.223) (0.089) CH -0.107 0.053 * -0.051 0.053 (0.140) (0.030) (0.122) (0.036) Constant 7.841 * -2.220 *** -3.776 -3.056 *** (4.597) (0.428) (5.726) (0.507)
Country FE Yes Yes Yes Yes
Country specific trend + trend2 Yes Yes No No
Trend + trend2
No No Yes Yes
Obs. 128 128 128 128
Adj. R2
Appendix B
Robustness checks for the model of
lead-times
Table 7: Alternative model specifications for lead-time in OECD countries
(1) (2) Variables (ln LT ) (ln LT ) HHI.M o -0.509 *** -0.458 ** (0.189) (0.200) ln Cap 0.225 *** 0.240 *** (0.051) (0.052) ln ExpArqM o -0.010 (0.031) ln ExpArqN oM o 0.0411 *** (0.013) ln ExpN oArqM o 0.0141 (0.018) ln ExpN oArqN oM o 0.080 * (0.041) Inv.ExpArqM o 0.0514 (0.111) Inv.ExpArqN oM o 0.003 (0.032) Inv.ExpN oArqM o 0.009 (0.048) Inv.ExpN oArqN oM o -0.238 (0.163) ln EDem -17.010 *** -21.240 *** (3.857) (3.387) T mi.Abroad 0.126 * 0.124 * (0.066) (0.069) T mi.U S 0.432 *** 0.448 *** (0.060) (0.062) CH 0.214 *** 0.214 *** (0.029) (0.027) Constant 2.111 *** 2.542 *** (0.450) (0.576)
Country FE Yes Yes
Time FE Yes Yes
Obs. 286 286
Adj. R2
0.876 0.872
Appendix C
Technical characteristics
Table 8: List of nuclear reactor models by manufacturer in France and the US
Model Manufacturer Number of reactors built B W (L-loop) DRYAMB Babcock
Wilcox 9 BWR-3 General Electric 1 BWR-41 General Electric 15 BWR-42 General Electric 4 BWR-5 General Electric 5 BWR-6 General Electric 4 CE (2-loop) DRYAMB Combustion Engineering 13 COMB CE80 DRYAMB Combustion Engineering 2
CP0 Areva 6 CP1 Areva 18 CP2 Areva 10 N4 Areva 4 P4 Areva 8 P’4 Areva 12
W (2-loop) DRYAMB Westinghouse 3 W (3-loop) DRYAMB Westinghouse 8 W (3-loop) DRYSUB Westinghouse 4 W (4-loop) DRYAMB Westinghouse 21 W (4-loop) DRYSUB Westinghouse 1 W (4-loop) ICECND Westinghouse 9