HAL Id: hal-02978978
https://hal.telecom-paris.fr/hal-02978978v4
Preprint submitted on 8 Feb 2021
HAL is a multi-disciplinary open access
archive for the deposit and dissemination of
sci-entific research documents, whether they are
pub-lished or not. The documents may come from
teaching and research institutions in France or
abroad, or from public or private research centers.
L’archive ouverte pluridisciplinaire HAL, est
destinée au dépôt et à la diffusion de documents
scientifiques de niveau recherche, publiés ou non,
émanant des établissements d’enseignement et de
recherche français ou étrangers, des laboratoires
publics ou privés.
NEURO-STEERED MUSIC SOURCE SEPARATION
WITH EEG-BASED AUDITORY ATTENTION
DECODING AND CONTRASTIVE-NMF
Giorgia Cantisani, Slim Essid, Gael Richard
To cite this version:
Giorgia Cantisani, Slim Essid, Gael Richard. NEURO-STEERED MUSIC SOURCE SEPARATION
WITH EEG-BASED AUDITORY ATTENTION DECODING AND CONTRASTIVE-NMF. 2021.
�hal-02978978v4�
NEURO-STEERED MUSIC SOURCE SEPARATION WITH EEG-BASED AUDITORY
ATTENTION DECODING AND CONTRASTIVE-NMF
Giorgia Cantisani
#, Slim Essid
#, Ga¨el Richard
##
LTCI, T´el´ecom Paris, Institut Polytechnique de Paris, France
[email protected]
ABSTRACT
We propose a novel informed music source separation paradigm, which can be referred to as neuro-steered music source separation. More precisely, the source separation process is guided by the user’s selective auditory attention decoded from his/her EEG response to the stimulus. This high-level prior information is used to select the desired instrument to isolate and to adapt the generic source sepa-ration model to the observed signal. To this aim, we leverage the fact that the attended instrument’s neural encoding is substantially stronger than the one of the unattended sources left in the mixture. This “contrast” is extracted using an attention decoder and used to inform a source separation model based on non-negative matrix fac-torization named Contrastive-NMF. The results are promising and show that the EEG information can automatically select the desired source to enhance and improve the separation quality.
Index Terms— Audio source separation, Auditory attention de-coding, Polyphonic music, EEG
1. INTRODUCTION
Every day we are surrounded by a multitude of sounds that are mixed in the so-called auditory scene. The latter may be very complex as it is composed of sound sources of different nature (e.g., speakers, sirens, musical instruments), which also carry spatial information (location, environment geometry, room reverberation). Neverthe-less, our auditory system is naturally able to process such concurrent sounds and isolate the sources of interest. This is known as the cock-tail party problem [1, 2] and has been studied mostly concerning the perception of speech in noisy or multi-speakers settings.
Even if the cognitive mechanism behind this capability is not yet fully understood, human’s selective attention has been proven to have a determinant role in it [3]. Auditory attention decoding (AAD) aims at determining which sound source a person is “focusing on” by just analysing the listener’s brain response. Previous AAD studies based on continuous electrocorticography (ECoG) [4, 5] and elec-troencephalographic (EEG) [6, 7] signals have shown that the neural activity tracks dynamic changes in the audio stimulus and can be successfully used to decode selective attention to a speaker. Simi-larly, in [8, 9], the AAD problem is recast as the task of decoding the attention to a specific musical instrument playing in an ensemble. In these works, a feature representation of the attended stimulus is re-constructed from the multi-channel EEG/ECoG recordings through a multi-channel Wiener-filter. This reconstruction filter, often referred to as temporal response function (TRF), is learned on a training set
This project has received funding from the European Union’s Horizon 2020 research and innovation program under the Marie Skłodowska-Curie grant agreement No. 765068
via a minimum mean squared error criterion. In [4] it was shown that the reconstructed representations were highly correlated with the salient time-frequency features of the attended speaker’s voice and were only weakly correlated with the unattended speaker ones. The authors of [9] verified a similar contrast for musical stimuli. In prac-tice, the attended source’s neural encoding is substantially stronger than the one of the unattended sources left in the mixture.
The main limitation of most AAD paradigms is their use of the separate “clean” audio sources. In fact, the ground truth feature rep-resentations are correlated with the ones predicted with the neural data to determine the attended source [5, 6, 9]. This condition is never met in realistic scenarios (e.g., intelligent hearing aids) where only mixtures are available. In such scenarios, an audio source sepa-rationstep, where single audio sources are extracted from their mix-ture, is needed. This limitation is strongly intertwined with a spec-ular aspect of audio source separation, whose process can be helped by any prior knowledge one may have about the sources [10]. In this case, the approach is referred to as informed audio source separation and was proven to enhance the separation process, especially for mu-sic and complicated mixtures. For instance, it has been shown that score [11], pitch [12], lyrics [13] and the motion of sound sources [14] lead to better music separation.
A few works have been proposed in the last years that relate speech source separation with AAD, but most of the time, the two tasks are tackled independently. Either the separated sources are used as clean sources to decode attention, or the EEG is used to decode which source needs to be enhanced. This has been imple-mented in multi-channel scenarios using beamforming [15, 16] and in single-channel scenarios using neural networks [17, 18]. How-ever, performing the speaker separation and source selection steps independently is sub-optimal, and during the last year, a few works have been proposed to overcome this issue [19, 20]. In [19], the authors propose an adaptive beamformer that reduces noise and in-terference but, at the same time, maximizes the Pearson correlation between the envelope of its output and the decoded EEG. In [20], instead, a speech separation neural network is informed with the de-coded attended speech envelope. Nevertheless, none of these works considers music audio signals.
As a natural continuation of the work done in [9] on AAD for music, we propose a new informed music source separation paradigm, which can be referred to as neuro-steered music source separation. The additional information brought by the EEG is ex-ploited to better adapt a generic source separation model to the observed signal. More precisely, the knowledge derived from an AAD step is used to inform an NMF-based source separation model named Contrastive-NMF. At test time, a pre-trained AAD model is updated within the C-NMF estimation loop to adapt to the test signal. The attended source is automatically selected and enhanced.
2. METHODS
2.1. Non-negative matrix factorization (NMF)
Non-negative matrix factorization (NMF)has been a very popular music source separation technique which proved to be powerful when properly informed by auxiliary data about the sources [21].
Let us consider the problem of single-channel source separation of a linear mixture x given by the sum of J sources sj: x(t) =
PJ
j=1sj(t). Given the magnitude or power spectrogram of such a
mixture X ∈ RM ×N+ , consisting of M frequency bins and N
short-time Fourier transform (STFT) frames, NMF decomposes it as X ≈ WH; where the columns of W ∈ RM ×K+ are interpreted as non-negative audio spectral patterns expected to correspond to different sources and the rows of H ∈ RK×N+ as their activations. K is the
number of spectral patterns. W and H estimates can be obtained by minimizing the divergence with the mixture reconstruction.
At this point, the separation problem reduces to the assignment of each of the k components to the corresponding source j. After the assignment, the soft mask of source j can be estimated using the fol-lowing element-wise division: (WjHj)/(WH). Finally, source j
is reconstructed by multiplying element-wise the soft-mask with the complex spectrogram of the mixture followed by an inverse STFT.
As music is often given by a repetition of a few audio patterns, the activations’ sparsity can be easily imposed using an `1
regular-ization term on the activations [21]. The same sparsity assumption is often desirable for the spectral patterns as there is only a low prob-ability that two given sources are highly activated in the same set of frequency bins [22]. The cost function is then:
C(W, H) = D(X|WH) | {z } audio factorization + µkHk1+ βkWk1 | {z } sparsity W, H ≥ 0. (1)
2.2. A novel NMF variant: Contrastive-NMF (C-NMF) Prior knowledge can be fed to the model in multiple ways, e.g., using hard or soft constrains, regularizers, pretrained dictionaries, or forc-ing the elements of W or H to follow a given distribution [21]. In general, when one has access to another modality which is synchro-nized with the audio (e.g., video, motion capture data, score), one can, for instance, suppose that the activations in the two modalities are equal (hard constraint) or similar (soft constraint) [23].
In our case, this approach is not relevant as the audio features one can reconstruct from the EEG are often very deteriorated, mak-ing it hard to use them directly. At the same time, these recon-structions are “good enough” to discriminate the attended instrument from the unattended one. This information can be used as a “con-trast” to guide the separation. In our previous work [9], we showed that the representations built from the EEG are highly correlated with the salient time-frequency features of the attended instrument and are only weakly correlated with the unattended instrument ones.
Let us consider a mixture x(t) given by the linear mixing of the attended source sa(t) and some interference sources su(t). Let Wa
be a sub-dictionary containing a selection of columns of W repre-senting source sa(t) and Sabe their activations. Sacan be roughly
approximated from the time-lagged EEG response R. The assump-tion is that Sais likely to be more correlated with the activations of
the attended source Hathan with the ones of the unattended source
Huderived from the audio factorization. This contrast is translated
into a new cost function as follows:
C(W, H) = D(X|WH) | {z } audio factorization + µkHk1+ βkWk1 | {z } sparsity + − δ(kHaSTak 2 F− kHuSTak 2 F) | {z } contrast W, H, Sa≥ 0 khk:k = 1, ksk:k = 1. (2)
While decomposing the audio spectrogram, the cost function is attempting to maximize the similarity of the EEG-derived activations with the audio-derived ones for the target source and minimize it for the interferes. After the decomposition, the components are already clustered into the target and interference sources, thanks to the con-trast. The rows of H and Sa(hk:and sk:respectively) are
normal-ized to have unit `2norm in order to minimize the effect of a scale
mismatch between the modalities. The update rule is derived using a heuristic gradient decomposition1and is reported in the pseudo-code
of Alg 1. 1 is a matrix of ones whose size is given by context.
input : X, R, µ ≥ 0, β ≥ 0, δ ≥ 0, γ ∈ [0, 1] output: Wa, Ha 1 W, H, g initialization 2 H ← diag(kh1:k−1, ..., khk:k−1)H . normalization 3 W ← W diag(kh1:k, ..., khk:k) . re-scaling 4 Λ = WH 5 repeat 6 Sa← gTR 7 Sa← diag(ks1:k−1, ..., ksk:k−1)Sa 8 repeat 9 P ← [−HaSTaSa, HuSTaSa]T 10 H ← H ⊗W T(X⊗Λ−1)+δP− WT1+µ+δP+ 11 H ← diag(kh1:k−1, ..., khk:k−1)H 12 W ← W diag(kh1:k, ..., khk:k) 13 Λ = WH 14 W ← W ⊗(Λ −1⊗X)HT 1HT+β 15 Λ = WH 16 until convergence; 17 update g 18 until convergence; 19 return Wa,Ha
Algorithm 1: Contrastive NMF pseudo-code
The general idea of discriminating sources according to some criterion is not new in NMF-based audio source separation. In [24, 25] the basis matrices are learned to be as much discriminative as possible and to have unique spectral templates. In [26], the cross-coherence of the bases is added to the cost function. In [27] instead, the NMF variables are optimized so that each basis is classified into one source. However, all these methods refer to fully supervised or semi-supervised scenarios, where the basis functions are learned in a training phase. A max-margin framework for unsupervised NMF was introduced by [28], where the projections are learned to max-imize an SVM classifier’s discriminative ability. Within this work, instead, the projections are learned by an unsupervised NMF to max-imize the discrimination ability of a pretrained AAD system that can be further fine-tuned in the NMF estimation process.
1Detailed derivation of the update rule at https://hal.
2.3. Stimulus Reconstruction
The attended source activations Sarelating to a given set of spectral
templates Waare reconstructed from the EEG using the TRF
back-ward model commonly used in the AAD framework [7]. In practice, each component Sa,k is reconstructed independently from the
oth-ers using a multichannel Wiener filter gk, which is learned through
an MMSE criterion on a training set of solos of the same instru-ment. This results in the following normalized reverse correlation gk = (RRT+ γI)−1
RST
a,kwhere RRT is the auto-correlation of
the EEG signals across all time-lags and channels and RST a,kis the
cross-correlation of Sa,kand the EEG data, I is the identity matrix
and γ ∈ [0, 1] is the Ridge regularization parameter. The time-lags are defined by the temporal context [τmin, τmax] where one expects
to see the stimulus effect in the EEG. Thus, the TRF backward model g = [g1, ..., gk] is a (#EEG channels ×#time lags × K)-tensor composed by the set of multi-channel Wiener filters, one for each component of Sa.
3. EXPERIMENTS
The goal is to separate a target instrument from a given music mixture. Along with the audio signal, we have access to the EEG recorded from the subject while she/he was listening to the given mixture and attending to the target instrument. The activations of the target instrument are reconstructed from the multi-channel EEG using a pre-trained TRF backward model. Those are used to guide the mixture’s factorization and cluster the components into the re-spective sources. At the same time, the TRF function is updated within the NMF estimation loop to adapt to the observed signal.
The experiments are designed to evaluate if the EEG information is helping the separation process and verify that the improvement is given by the EEG and not by the cost function’s discriminative capacity. Therefore, we compared three different models:
1. Blind NMF (NMF);
2. Contrastive NMF + Random activations (C-NMF-r); 3. Contrastive NMF + EEG-derived activations (C-NMF-e).
Since NMF is entirely unsupervised, the components need to be clustered and assigned to each source after the factorization. In the baselines, the components are clustered according to their Mel-frequency cepstral coefficient (MFCC) similarity. In the case of the C-NMF-e, the EEG information automatically identifies and gath-ers the target instrument components. In the second baseline, the meaningless side information consists of random activations sam-pled from a Gaussian distribution.
3.1. Data
The data used is a subset of the MAD-EEG dataset [29], which collects well-synchronized musical stimuli and corresponding 20-channel EEG responses. The signals were recorded from 8 subjects while listening to a song and attending to a specific instrument. Each subject listened to a set of stimuli, consisting of 4 repetitions of the same 6-second-long music excerpt. Each attended instrument was previously heard in solo, as part of a training phase.
The dataset contains many stimuli variants in terms of musical genre, type and number of instruments in each mixture, spatial ren-dering, and attended instrument during the listening test. We chose to use only the pop duets of the dataset (12 mixtures in total, which were listened by multiple subjects) as the separation task is too easy
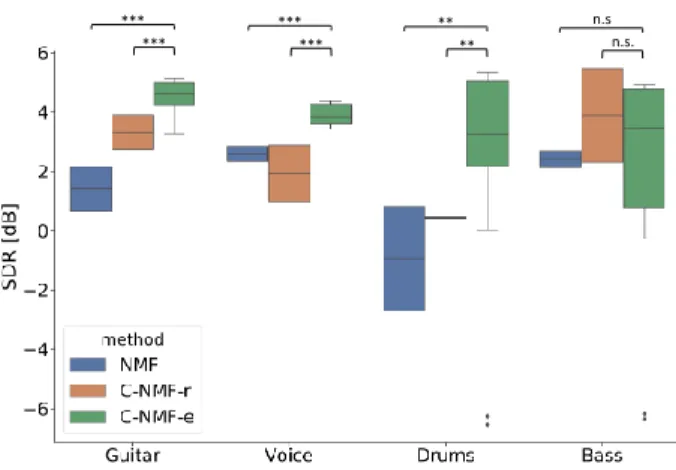
*** *** *** *** ** ** n.s n.s.
Fig. 1. SDR expressed in dB for different instruments and meth-ods. ”***” denotes high (p < 0.001), ”**” good (p < 0.01), ”*” marginal (p < 0.05) and ”n.s.” no (p > 0.05) statistical significance for a non-parametric Wilcoxon test on the linear SDR.
for the classic ones. The idea is to test only complicated mixtures, where additional information may help the NMF in the separation process. Pop mixtures of the dataset consist of real music composi-tions for which we can access the isolated sources. The instruments that can occur are voice, Bass, Drums, and electric Guitar.
The EEG electrodes were placed according to the 10-20 interna-tional montage system and referenced to the left mastoid in a unipo-lar setting. The sampling frequency was 256Hz. The 50 Hz power-line interference was removed using a notch filter, and EOG/ECG artifacts were detected and removed using independent component analysis (ICA). For more details about the data, please refer to [29].
3.2. Hyper parameter tuning
For each model, hyper-parameter values were decided through a grid-search using an holdout example mixture.
For all models, the best number of components to represent each instrument is 16 × J , e.g. K = 32 for duets. For each method, NMF is run for 400 iterations while the TRF model is updated every 100 iterations. An `1regularization term is imposed both on W and H to
ensure sparsity: µ = β = 1 is the best solution for the two baselines, while for our model, it is µ = β = 10. We found the best weight of the contrast term to be δ = 104. The Kullback-Leibler diver-gence was found to work better than the Euclidean and Itakura-Saito ones. For each method, the initialization of W and H is obtained by applying a blind NMF to the mixture for 200 iterations.
A good initialization of the TRF functions was learned from a training set of solos (different from the ones used in the test mix-tures) and corresponding EEG recordings for each subject and in-strument. The Ridge parameter is set to be γ = 0.1 and the consid-ered temporal context is [0, 250]ms post-stimulus.
4. RESULTS
The models are evaluated using standard metrics in music source separation, i.e. Signal-to-Distortion Ratio (SDR), Signal-to-Interference Ratio (SIR) and Signal-to-Artifacts Ratio (SAR) expressed in dB and computed using the BSSEval v4 [30]. To assert the statistical signif-icance of our model’s improvement over the baselines, we opted for
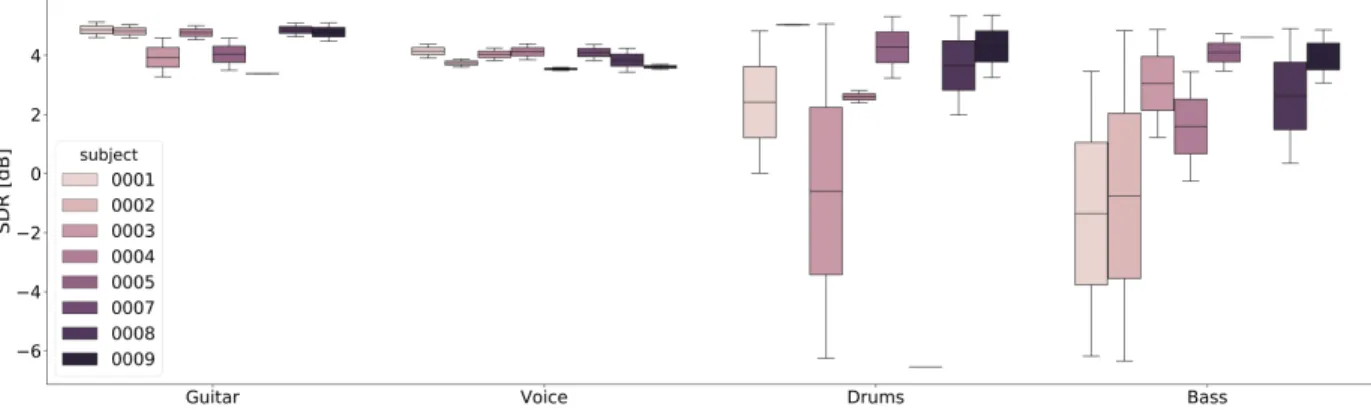
Fig. 2. SDR expressed in dB for the EEG-informed NMF. Different nuances of pink indicate different subjects.
Guitar Vocals Drums Bass SDR Mono Stereo
SDR SIR SAR SDR SIR SAR SDR SIR SAR SDR SIR SAR Guitar 4.6 5.0 NMF 1.4 1.5 7.2 2.6 2.1 8.5 -1.0 -2.2 5.4 2.4 4.5 8.1 Vocals 3.8 4.3 C-NMF-r 3.3 2.6 8.5 1.9 6.2 -1.0 0.4 5.5 -6.8 3.9 2.9 17.0 Drums 3.2 5.0 C-NMF-e 4.6 6.8 7.5 3.8 6.6 5.8 3.3 6.5 11.3 3.5 1.3 13.2 Bass 4.0 0.3
Table 1. (Left): SDR, SIR and SAR separation results for the three tested models and each instrument in the test set. (Right): SDR results of the proposed method are split for stereo and mono tests. The metrics are shown in dB and all values are medians over the test set.
a non-parametric Wilcoxon test on the linear values of the metrics. The considered significance levels are 0.1%, 1% and 5%.
The results we obtain are promising and show that the contrast derived from the EEG can improve the separation quality. In Figure 1, one can compare the SDR obtained for different methods and in-struments in the dataset, while in Table 1, one can see the median values of the complete set of metrics. For all the instruments ex-cept for the Bass, our model performs significantly better than both the blind NMF and C-NMF-r (p < 0.001 for Guitar and vocals; p < 0.01 for the Drums, non-parametric Wilcoxon test). Consid-ering the Bass only, the difference among the methods is not statis-tically significant (p > 0.05, non-parametric Wilcoxon test). Even if the improvement is not systematic for all the instruments, the for-mulation of the proposed NMF gives an automatic clustering of the components and the identification of the target source also for the Bass. This is already an asset with respect to the baselines, which need an additional step of clustering of the components and cannot automatically identify the target source.
The high variance experienced when separating the Bass and the Drums is due to the high variance experienced across different sub-jects. In Figure 2, we can see the performances in terms of SDR for the method C-NMF-e. Different nuances of pink indicate different subjects. It is immediate to see that the attention task may be more or less difficult for different subjects, and this is evident for instru-ments like the Bass and the Drums, which are notably more difficult to be tracked, especially for non-professional musicians. Singing voice and Guitar seem to work notably better in this sense. One ten-tative explanation is that the voice is a particular type of instrument for which the attention is radically different from the other ones as it also involves semantic cues. Moreover, all subjects involved in the experiments except two, play Guitar as a hobby.
The stimuli were played to the subjects with two possible spatial renderings: one where both instruments are in the center, denoted as mono modality, and one where the instruments are spatialized,
denoted as stereo. In Table 1 on the right, we see the results for these two different cases. Intuitively, the stereo setting should help the subject in focusing on the target instrument as it makes it eas-ier to localize it, leading to a better reconstruction of its activations and finally giving a better separation. This seems to be true for the singing voice, Guitar, and Drums. However, this finding need fur-ther validation as the difference cannot be considered statistically significant (p > 0.05, non-parametric Wilcoxon test) as the num-ber of test examples is limited, and the variability is high. For the Bass, it seems instead that the spatial cues make the attention task harder, maybe adding some ambiguities. The Bass performance on the stereo setting confirms that it is the most challenging instrument to be spatially localized due to his low-frequency signals. This may add ambiguities and make it harder to focus on it. On the contrary, the Drums, whose signals are mostly impulsive and thus easier to localize, are the instruments for which the stereo listening helps the most the attention task.
5. CONCLUSIONS
We proposed a novel paradigm to inform a source separation model using the selective attention of the listener decoded from his/her EEG response to the stimulus. To this aim, we exploited the fact that the attended instrument’s neural encoding is substantially stronger than the one of the unattended sources left in the mixture. This “contrast” is extracted using a pre-trained attention decoding model and used to inform a source separation algorithm named Contrastive-NMF. At the same time, the decoding model is updated within the NMF estimation loop to adapt to the test signal. We obtain promising results, showing that the EEG information can automatically select the desired source to enhance and improve the separation quality.
The proposed C-NMF is particularly promising as it can be generalized and used with temporal activations derived from other modalities than the EEG (e.g., video, score, motion capture data).
6. REFERENCES
[1] B. G. Shinn-Cunningham, “Object-based auditory and visual attention,” Trends in cognitive sciences, vol. 12, no. 5, 2008. [2] A. S. Bregman, Auditory scene analysis: The perceptual
orga-nization of sound. MIT press, 1994.
[3] J. B. Fritz, M. Elhilali, S. V. David, and S. A. Shamma, “Au-ditory attention—focusing the searchlight on sound,” Current opinion in neurobiology, vol. 17, no. 4, 2007.
[4] N. Mesgarani, S. V. David, J. B. Fritz, and S. A. Shamma, “Influence of context and behavior on stimulus reconstruction from neural activity in primary auditory cortex,” Journal of neurophysiology, 2009.
[5] N. Mesgarani and E. F. Chang, “Selective cortical represen-tation of attended speaker in multi-talker speech perception,” Nature, vol. 485, no. 7397, 2012.
[6] J. A. O’sullivan, A. J. Power, N. Mesgarani, S. Rajaram, J. J. Foxe, B. G. Shinn-Cunningham, M. Slaney, S. A. Shamma, and E. C. Lalor, “Attentional selection in a cocktail party environ-ment can be decoded from single-trial EEG,” Cerebral Cortex, vol. 25, no. 7, 2014.
[7] M. J. Crosse, G. M. Di Liberto, A. Bednar, and E. C. Lalor, “The multivariate temporal response function (mTRF) toolbox: a MATLAB toolbox for relating neural signals to continuous stimuli,” Frontiers in human neuroscience, vol. 10, 2016. [8] M. S. Treder, H. Purwins, D. Miklody, I. Sturm, and
B. Blankertz, “Decoding auditory attention to instruments in polyphonic music using single-trial EEG classification,” Jour-nal of neural engineering, vol. 11, no. 2, 2014.
[9] G. Cantisani, S. Essid, and G. Richard, “EEG-based decoding of auditory attention to a target instrument in polyphonic mu-sic,” in IEEE Workshop on Applications of Signal Processing to Audio and Acoustics (WASPAA), 2019.
[10] A. Liutkus, J.-L. Durrieu, L. Daudet, and G. Richard, “An overview of informed audio source separation,” in IEEE 14th International Workshop on Image Analysis for Multimedia In-teractive Services (WIAMIS), 2013.
[11] S. Ewert, B. Pardo, M. M¨uller, and M. D. Plumbley, “Score-informed source separation for musical audio recordings: An overview,” IEEE Signal Processing Magazine, vol. 31, no. 3, 2014.
[12] T. Virtanen, A. Mesaros, and M. Ryyn¨anen, “Combining pitch-based inference and non-negative spectrogram factorization in separating vocals from polyphonic music.” in SAPA@ INTER-SPEECH, 2008.
[13] K. Schulze-Forster, C. Doire, G. Richard, and R. Badeau, “Weakly informed audio source separation,” in IEEE Workshop on Applications of Signal Processing to Audio and Acoustics (WASPAA), 2019.
[14] S. Parekh, S. Essid, A. Ozerov, N. Q. Duong, P. P´erez, and G. Richard, “Guiding audio source separation by video object information,” in IEEE Workshop on Applications of Signal Pro-cessing to Audio and Acoustics (WASPAA), 2017.
[15] S. Van Eyndhoven, T. Francart, and A. Bertrand, “EEG-informed attended speaker extraction from recorded speech mixtures with application in neuro-steered hearing prostheses.” IEEE Trans. Biomed. Engineering, vol. 64, no. 5, 2017.
[16] A. Aroudi and S. Doclo, “Cognitive-driven binaural beam-forming using EEG-based auditory attention decoding,” IEEE/ACM Trans. on Audio, Speech, and Language Process-ing, vol. 28, 2020.
[17] C. Han, J. O’Sullivan, Y. Luo, J. Herrero, A. D. Mehta, and N. Mesgarani, “Speaker-independent auditory attention decod-ing without access to clean speech sources,” Science advances, vol. 5, no. 5, 2019.
[18] N. Das, J. Zegers, T. Francart, A. Bertrand et al., “EEG-informed speaker extraction from noisy recordings in neuro-steered hearing aids: linear versus deep learning methods,” BioRxiv, 2020.
[19] W. Pu, J. Xiao, T. Zhang, and Z.-Q. Luo, “A joint auditory attention decoding and adaptive binaural beamforming algo-rithm for hearing devices,” in IEEE International Conference on Acoustics, Speech and Signal Processing (ICASSP), 2019. [20] E. Ceolini, J. Hjortkjær, D. D. Wong, J. O’Sullivan, V. S.
Raghavan, J. Herrero, A. D. Mehta, S.-C. Liu, and N. Mes-garani, “Brain-informed speech separation (BISS) for enhance-ment of target speaker in multitalker speech perception,” Neu-roImage, 2020.
[21] E. Vincent, T. Virtanen, and S. Gannot, Audio source separa-tion and speech enhancement. John Wiley & Sons, 2018. [22] O. Yilmaz and S. Rickard, “Blind separation of speech
mix-tures via time-frequency masking,” IEEE Trans. on signal pro-cessing, vol. 52, no. 7, 2004.
[23] N. Seichepine, S. Essid, C. F´evotte, and O. Capp´e, “Soft non-negative matrix co-factorization.” IEEE Trans. Signal Process-ing, vol. 62, no. 22, 2014.
[24] F. Weninger, J. L. Roux, J. R. Hershey, and S. Watanabe, “Dis-criminative NMF and its application to single-channel source separation,” in 15th Annual Conference of the International Speech Communication Association, 2014.
[25] D. Kitamura, N. Ono, H. Saruwatari, Y. Takahashi, and K. Kondo, “Discriminative and reconstructive basis training for audio source separation with semi-supervised nonnegative ma-trix factorization,” in IEEE International Workshop on Acous-tic Signal Enhancement (IWAENC), 2016.
[26] E. M. Grais and H. Erdogan, “Discriminative nonnegative dictionary learning using cross-coherence penalties for single channel source separation.” in Interspeech, 2013.
[27] H. Chung, E. Plourde, and B. Champagne, “Discriminative training of NMF model based on class probabilities for speech enhancement,” IEEE Signal Processing Letters, vol. 23, no. 4, 2016.
[28] B. V. Kumar, I. Kotsia, and I. Patras, “Max-margin non-negative matrix factorization,” Image and Vision Computing, vol. 30, no. 4-5, 2012.
[29] G. Cantisani, G. Tr´egoat, S. Essid, and G. Richard, “MAD-EEG: an EEG dataset for decoding auditory attention to a target instrument in polyphonic music,” in Speech, Music and Mind (SMM), Satellite Workshop of Interspeech, 2019.
[30] E. Vincent, R. Gribonval, and C. F´evotte, “Performance mea-surement in blind audio source separation,” IEEE Trans. on audio, speech, and language processing, vol. 14, no. 4, 2006.