CoRoT Measures Solar-Like
Oscillations and Granulation in Stars
Hotter Than the Sun
Eric Michel,1* Annie Baglin,1Michel Auvergne,1Claude Catala,1Reza Samadi,1 Frédéric Baudin,2Thierry Appourchaux,2Caroline Barban,1Werner W. Weiss,3 Gabrielle Berthomieu,4Patrick Boumier,2Marc-Antoine Dupret,1Rafael A. Garcia,5 Malcolm Fridlund,6Rafael Garrido,7Marie-Jo Goupil,1Hans Kjeldsen,8Yveline Lebreton,9 Benoît Mosser,1Arlette Grotsch-Noels,10Eduardo Janot-Pacheco,11Janine Provost,4
Ian W. Roxburgh,12,1Anne Thoul,10Thierry Toutain,13Didier Tiphène,1Sylvaine Turck-Chieze,5 Sylvie D. Vauclair,14Gérard P. Vauclair,14Conny Aerts,15Georges Alecian,16Jérôme Ballot,17 Stéphane Charpinet,14Anne-Marie Hubert,9François Lignières,14Philippe Mathias,18 Mario J. P. F. G. Monteiro,19Coralie Neiner,9Ennio Poretti,20José Renan de Medeiros,21 Ignasi Ribas,22Michel L. Rieutord,14Teodoro Roca Cortés,23Konstanze Zwintz3
Oscillations of the Sun have been used to understand its interior structure. The extension of similar studies to more distant stars has raised many difficulties despite the strong efforts of the international community over the past decades. The CoRoT (Convection Rotation and Planetary Transits) satellite, launched in December 2006, has now measured oscillations and the stellar granulation signature in three main sequence stars that are noticeably hotter than the sun. The oscillation amplitudes are about 1.5 times as large as those in the Sun; the stellar granulation is up to three times as high. The stellar amplitudes are about 25% below the theoretic values, providing a measurement of the nonadiabaticity of the process ruling the oscillations in the outer layers of the stars.
T
he discovery of global oscillations in the Sun (1, 2) opened the way to solar seismology, that is, to sounding the Sun’s interior, measuring, for instance, the depth of its convection zone and its rotation at dif-ferent depths and latitudes (3). High-precision photometry from space has long been consid-ered the best way to extend these techniques to other main sequence stars of moderate mass where such oscillations are expected. How-ever, the first attempts were ambiguous (4, 5), casting some doubt on the theoretical esti-mates of intrinsic amplitudes and questioning to what extent the oscillations might be hid-den by stellar granulation. We present here the detection of solar-like oscillations in three stars observed by the CoRoT (Convection Rotation and Planetary Transits) (6) space mission, andwe characterize their amplitudes and the gran-ulation signature.
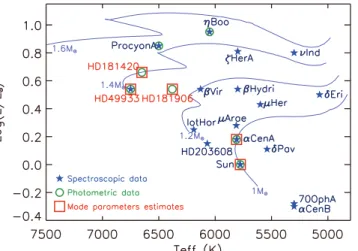
Detecting and measuring solar-like oscil-lations in main sequence stars other than the Sun is challenging. Tracking the variations in the light from a star to one part per million (ppm) requires high accuracy on individual measure-ments. It also requires long uninterrupted se-quences of observations to enhance the statistics of the measurements without being polluted by the spurious frequency components induced by data gaps. Solar-like oscillations have been de-tected from the ground in radial velocity in several stars (Fig. 1). However, ground-based observations are hampered by diurnal inter-ruptions, weather instabilities, and the annual motion of the Earth. As a result, all existing data sets suffer more or less severely from a
limited time base and large gaps in the data, which hamper the measurement of mode char-acteristics. In addition, radial velocity observa-tions are strongly biased toward low-effective temperature stars (and slow rotators), for they require many narrow spectral lines, and toward subgiant and giant stars, which show oscillations of the same nature as the Sun and other main sequence stars but with larger intrinsic ampli-tudes. On the other hand, photometric detection of solar-like oscillations has not been possible from the ground because of the higher sensitiv-ity to atmospheric scintillation, and the previous space projects detected only power excess so far [for Procyon and beta Hydri with WIRE (Wide-Field Infrared Explorer) (7, 8) and eta Boo with MOST (Microvariabilité et Oscillations
REPORTS
Fig. 1. HR diagram fea-turing stars for which mode structure has been observed in photometry (red squares), a power excess has been de-tected in photometry (green circles), and a detection has been performed in radial ve-locity (blue stars). Stellar evo-lutionary tracks are taken from (20), for solar chem-ical composition. Red giant pulsators (~6 objects) are out of the upper right corner of the figure.
1Laboratoire d’Etudes Spatiales et d’Instrumentation Astro-physique (LESIA), Observatoire de Paris, CNRS (UMR 8109)-Université Paris 6 Pierre et Marie Curie-8109)-Université Paris 7 Denis Diderot, Place Jules Janssen, F- 92195 Meudon, France. 2Institut d'Astrophysique Spatiale (IAS), Université Paris-Sud 11, CNRS (UMR 8617), Bâtiment 121, F-91405 Orsay, France. 3Institute for Astronomy, University of Vienna, Tuerkenschanz-strasse 17, A-1180 Vienna, Austria.4Laboratoire Cassiopée, Observatoire de la Côte d'Azur, CNRS (UMR 6202), BP 4229, F-06304 Nice Cedex 04, France. 5Laboratoire Astrophy-sique Interactions Multi-échelles (AIM), Commisariat àl’Energie Atomique/DSM (Direction des Sciences de la Matiére)-CNRS-Université Paris 7 Denis Diderot, CEA, IRFU (Institut de Re-cherche sur les Lois Fondamentales de l’Univers), SAp (Service d’Astrophysique), F-91191 Gif-sur-Yvette Cedex, France.6 Astro-physics Mission Division, Research and Scientific Support Depart-ment, European Space Agency (ESA), European Space Research and Technology Center, SCI-SA, Post Office Box 299, Keplerlaan 1 NL-2200AG, Noordwijk, Netherlands.7Instituto de Astrofísica de Andalucía (CSIC) C/ Camino Bajo de Huétor, 50 E-18008 Granada, Spain.8Danish AstroSeismology Centre (DASC) Institut for Fysik og Astronomi Aarhus Universitet Bygning 1520, Ny Munkegade DK-8000 Aarhus C, Denmark.9Laboratoire Gal-axies, Etoiles, Physique et Instrumentation (GEPI), Observatoire de Paris, CNRS (UMR 8111), Place Jules Janssen, F-92195 Meudon, France.10Institut d'Astrophysique et de Géophysique Université de Liège, Allée du 6 Août 17, B-4000 Liège, Bel-gique.11Instituto de Astronomia, Geofisica e Ciencias Atmo-sfericas, Rua do Matao, 1226/05508-090 Sao Paulo, Brazil. 12
Queen Mary University of London, Mile End Road, London E1 4NS, UK.13School of Physics and Astronomy, University of Bir-mingham, Edgbaston B15 2TT, UK.14Laboratoire d'Astrophy-sique de Toulouse-Tarbes, Université de Toulouse, CNRS (UMR 5572), 14 Avenue Edouard Belin, F-31400 Toulouse, France. 15Instituut voor Sterrenkunde, Departement Natuurkunde en Sterrenkunde, Katholieke Universiteit Leuven, Celestijnenlaan 200 D, B -3001 Leuven, Belgium.16Laboratoire Univers et Théories (LUTH), Observatoire de Paris, CNRS (UMR 8102), Université Paris 7 Denis Diderot, 5 Place Jules Janssen, F-92190 Meudon, France.17Max Planck Institut für Astrophysik, Karl-Schwarzschild-Strasse 1, Postfach 1317, D-85741 Garching, Germany.18Laboratoire Hippolyte Fizeau, Observatoire de la Côte d’Azur, CNRS (UMR 6525), Université Nice Sophia-Antipolis, Campus Valrose, F-06108 Nice Cedex 2, France. 19Centro de Astrofisica da Universidade do Porto, Rua das Estrelas, 4150-762 Porto, Portugal.20Istituto Nazionale di Astrofisica-Osservatorio Astronomico di Brera Via Emilio Bianchi 46, 23807 Merate (LC), Italy.21Departamento de Física, Uni-versidade Federal do Rio Grande do Norte, 59072-970, Natal RN, Brasil.22Institut de Ciencies de l'Espai (CSIC-IEEC) Cam-pus UAB Facultat de Ciències, Torre C5-parell, 2a pl 08193 Bellaterra, Spain.23Instituto de Astrofísica de Canarias, and Departamento de Astrofísica, Universidad de La Laguna, 38207 La Laguna, Tenerife, Spain.
*To whom correspondence should be addressed. E-mail: Eric.Michel@obspm.fr
24 OCTOBER 2008 VOL 322 SCIENCE www.sciencemag.org 558
Stellaires) (9)]. For alpha Cen A, WIRE (10) detected the characteristic comblike pattern of the oscillations, which could be analyzed with
the help of complementary velocity data (11). However, alpha Cen A is very close to the Sun in terms of its global characteristics. The results here are based on light curves obtained with CoRoT over 60 days for HD49933 and 156 days for HD181420 and HD181906, three main se-quence F stars noticeably hotter than the Sun (Fig. 1 and table S1).
The CoRoT satellite was launched on De-cember 2006 in an inertial polar orbit at an altitude of 897 km. The instrument is fed by a 27-cm diameter telescope. During each run, it simultaneously provides light curves (variations in stellar flux with time) from 10 bright stars (5.5 <mV< 9.5) dedicated to seismic studies, while 12,000 fainter stars (11.5 <mV< 15.5) are monitored to search for transits due to planets (6). The sampling rate is 1 s for an integration time of 0.794 s. Pointing stability reaches a precision of 0.15′′ root mean square. The duty cycle was higher than 93%; the missing data correspond essentially to the time spent in the South Atlantic magnetic anomaly where the per-turbations due to energetic particles have not, as yet, been effectively corrected. These gaps, about eight per day, from 5 to 15 min each, have been linearly interpolated (with a 2000-s boxcar on each side of the gap to prevent the introduction of any spurious high frequencies) before we computed the Fourier power spectra, to mini-mize the aliases of the low-frequency components due to the window. We used synthetic spectra to check that this procedure has no noticeable in-fluence on the measured mean values.
For each of the three stars, the Fourier power density spectra (Fig. 2) show three components that can be understood as (i) a flat white-noise component essentially due to photon counting noise, (ii) a stellar background component (es-sentially granulation in this frequency domain) following a Lorentzian profile B/[1+(Cn)2] as suggested in (12), and (iii) the stellar oscilla-tion spectrum with its comblike pattern char-acterized by the large separationD (13).
Although dedicated analyses are under way to extract individual mode frequencies and pro-files for each star, we measure here the con-tributions of these three components. We follow the method proposed in (14) and illustrated in Fig. 2, and we convert these instrumental values into intrinsic bolometric maximum amplitude per radial mode [Abol(l = 0)] and bolometric maxi-mum power spectral density Bbol(15). We apply the same analysis to the solar SOHO/VIRGO/ PMO6 (Solar and Heliospheric Observatory/
Variability of Solar Irradiance and Gravity Os-cillations) data (16). The amplitudes of the three stars are larger than in the Sun by a factor of ~1.5 (Fig. 3).
Theoretical predictions suggest that veloc-ity amplitudes follow a scaling law in (L/M)a witha ~ 0.7 (L and M standing for luminosity and mass), in broad agreement with the exist-ing velocity measurements (17). In the adiabatic approximation (18), this would give photomet-ric amplitudes scaling as (L/M)a(T
eff)1/2, where Teffis effective temperature. As shown in Fig. 3 (see also Table 1), the measured values for the three stars are of the same order but significantly lower (by 24T 8% globally) than the theoretical values. The measurement of this systematic de-parture from the adiabatic case, which is not ob-served in velocity, tells us about the exchange of energy between convection and oscillations in the outer part of the convection zone. This process is responsible for the existence, and the specific amplitudes and lifetimes, of the oscillations. Both radial velocity and photometry measurements are sensitive to the oscillation momentum induced by this energy exchange; the photometric amplitudes are in addition more sensitive to the details of this process, via radiation-matter interaction. These measurements offer the possibility of testing theo-retical models of the nonadiabatic effects of the processes governing the oscillations and illustrate the complementary interest of photometry and radial velocity measurements (when they are pos-sible), which probe the oscillations differently.
The spectral signature of granulation is ex-pected to reveal time scales and distance scales characteristic of the convection process in dif-ferent stars (12, 19). Our data show (fig. S1 and Table 1) that (i) the maximum bolometric power density (Bbol), associated with the number of eddies seen at the stellar surface and the border/ center contrast of the granules, is higher for the three stars than for the Sun by a factor up to 3; and (ii) the characteristic time scale for granulation (C) associated with the eddy turnover time increases slightly withTeff(up to 30% higher than the Sun).
References and Notes
1. A. Claverie, G. R. Isaak, C. P. McLeod, H. B. van der Raay, T. Roca Cortes, Nature 282, 591 (1979).
2. G. Grec, E. Fossat, M. Pomerantz, Nature 288, 541 (1980). 3. D. Gough, J. W. Leibacher, P. Scherrer, J. Toomre, Science
272, 1281 (1996).
4. J. M. Matthews et al., Nature 430, 51 (2004). 5. D. G. Guenther et al., Astrophys. J. 635, 547 (2005). 6. A. Baglin et al., in The CoRoT Mission, Pre-Launch Status,
Stellar Seismology and Planet Finding, M. Fridlund, A. Baglin, J. Lochard, L. Conroy, Eds. (ESA SP-1306, ESA Publications Division, Noordwijk, Netherlands, 2006), pp. 33–37.
7. H. Bruntt et al., Astrophys. J. 633, 440 (2005). 8. C. Karoff, H. Bruntt, H. Kjeldsen, T. Bedding, D. L. Buzasi,
Commun. Asteroseismol. 150, 147 (2007). 9. D. B. Guenther et al., Commun. Asteroseismol. 151, 5
(2007).
10. J. Schou, D. L. Buzasi, in Proceedings SOHO 10/GONG 2000 Workshop: Helio- and Asteroseismology at the Dawn of the Millennium, P. L. Pallé, A. Wilson, Eds. (ESA SP-464, ESA Publications Division, Noordwijk, Netherlands, 2001), pp. 391–394.
A
B
C
Fig. 2. Instrumental power spectral density. (A) For HD49933; a moving mean is applied with a 4-mHz boxcar (black); yellow curve: same spectrum highly smoothed (4 timesD boxcar); green curve: mean level of the granulation + white noise com-ponents; red curve: mean white noise component level alone; blue curve: oscillation mean power den-sity contribution alone. (B) Same for HD181420. (C) Same for HD181906.
Fig. 3. Maximum bolometric amplitudes per radial mode measured (red) for HD49933, HD181420, HD181906, and for the Sun. Theoretical values are also given (blue). Error bars on amplitudes are standard deviation estimates associated with the accuracy of the measurements (red), and with the error estimate onTeff(blue).
Table 1. Parameters obtained in the present analysis, with standard deviation estimates.
Star Abol (l = 0)(ppm) Bbol (ppm2/mHz) C (s) D (mHz) HD 49933 4.02T 0.57 1.97T 0.53 1967T 431 86T 2 HD 181420 3.82T 0.40 2.41T 0.31 1936T 206 77T 2 HD 181906 3.26T 0.42 1.12T 0.20 1650T 0276 88T 2 Sun PMO6 2.39T 0.17 0.85T 0.06 1440T 86 135T 2
www.sciencemag.org SCIENCE VOL 322 24 OCTOBER 2008 559
11. S. T. Fletcher, W. J. Chaplin, Y. Elsworth, J. Schou, D. Buzasi, in Proceedings SOHO 18/GONG 2006/HELAS I, Beyond the Spherical Sun, K. Fletcher, M. Thompson, Eds. (ESA SP-624, ESA Publications Division, Noordwijk, Netherlands, 2006), published on CDROM, p. 27.1. 12. J. W. Harvey, Proceedings Future Missions in Solar, Heliospheric and Space Plasma Physics, E. Rolfe, B. Battrick, Eds. (ESA-SP 235, ESA Publications Division, Noordwijk, Netherlands, 1985), pp. 199-208. 13. The large separation (D) refers to the first order regular
spacing in frequency between consecutive overtone eigenfrequencies, responsible for the characteristic comb-like pattern of the oscillation spectrum. 14. H. Kjeldsen et al., Astrophys. J. 635, 1281 (2005).
15. Materials and methods are available as supporting material on Science Online.
16. C. Frohlich et al., Sol. Phys. 170, 1 (1997). 17. R. Samadi et al., Astron. Astrophys. 463, 297 (2007). 18. H. Kjeldsen, T. R. Bedding, Astron. Astrophys. 293, 87 (1995). 19. F. Baudin, R. Samadi, T. Appourchaux, E. Michel, in The
CoRoT Mission, Pre-Launch Status, Stellar Seismology and Planet Finding, M. Fridlund, A. Baglin, J. Lochard, L. Conroy, Eds. (ESA SP-1306, ESA Publications Division, Noordwijk, Netherlands, 2006), pp. 403–407. 20. Y. Lebreton, E. Michel, Astrophys. Space Sci. 316, 167 (2008). 21. The CoRoT space mission, launched on December 2006,
was developed and is operated by CNES (Centre National d’Etudes Spatiales), with participation of the Science
Program of ESA, ESA’s RSSD (Research and Scientific Support Department), Austria, Belgium, Brazil, Germany, and Spain. We acknowledge the access to data from the VIRGO instrument aboard SOHO, the mission of international collaboration between ESA and NASA.
Supporting Online Material
www.sciencemag.org/cgi/content/full/322/5901/558/DC1 SOM Text
Fig. S1 Table S1 References
9 July 2008; accepted 10 September 2008 10.1126/science.1163004
A Large Excess in Apparent Solar
Oblateness Due to Surface Magnetism
Martin D. Fivian,1* Hugh S. Hudson,1Robert P. Lin,1,2H. Jabran Zahid1,3The shape of the Sun subtly reflects its rotation and internal flows. The surface rotation rate, ~2 kilometers per second at the equator, predicts an oblateness (equator-pole radius difference) of 7.8 milli–arc seconds, or ~0.001%. Observations from the Reuven Ramaty High-Energy Solar Spectroscopic Imager satellite show unexpectedly large flattening, relative to the expectation from surface rotation. This excess is dominated by the quadrupole term and gives a total oblateness of 10.77T 0.44 milli–arc seconds. The position of the limb correlates with a sensitive extreme ultraviolet proxy, the 284 angstrom limb brightness. We relate the larger radius values to magnetic elements in the enhanced network and use the correlation to correct for it as a systematic error term in the oblateness measurement. The corrected oblateness of the nonmagnetic Sun is 8.01T 0.14 milli–arc seconds, which is near the value expected from rotation.
M
otions within the interior of the Sun affect the location of the photosphere, so the precise measurement of the shape of the solar limb is a long-standing astro-metric objective (1). The shape also relates to Le Verrier’s 1859 observation of an anomalous perihelion precession of Mercury (only some 43′′ per century), which could be preciselycal-culated in Einstein’s theory of general relativity (2). A discrepancy from the predictions of this theory would point to either a need for a new theory or else to a distortion of the Sun’s in-ternal gravity not reflected in the surface ro-tation. The two leading possibilities for such a gravitational field would be a rapidly rotating core left over from the early stages of star
formation—perhaps on an oblique axis—or a strong magnetic field (3).
The modern era of measurements of the solar oblateness began in the 1960s with Dicke’s Princeton Solar Distortion Telescope (4) and other ground-based telescopes (5–8). Dicke’s initial results (4) implied that the Sun was much more oblate than the surface rotation predicts. More recent observations have tended to show smaller values, closer to the 7.8 milli–arc sec pre-dicted by the surface rotation (3), but the uncer-tainties in the measurements have remained relatively large. The theoretical estimate is dif-ficult because of the differential nature of solar rotation, both in latitude and in radius. The ground-based data also hinted at time variations in the oblateness (6). Including the two data points (1997 and 2001) from the Michelson-Doppler Imager (9) on board the Solar Heliospheric
Ob-1
Space Sciences Laboratory, University of California– Berkeley, Berkeley, CA 94720, USA.2Physics Department, University of California–Berkeley, Berkeley, CA 94720, USA. 3
Institute for Astronomy, University of Hawaii, Manoa, HI 96822, USA.
*To whom correspondence should be addressed. E-mail: mfivian@ssl.berkeley.edu W S E N -100 -50 0 50 100
05-Aug 09-Aug 13-Aug 17-Aug 21-Aug 25-Aug Date (2004) N W S E N 7 7.5 8 8.5 0 20 40 60 80 100 120 140 Orbit counts N W S E N -50 -20 0 20 50 A B C
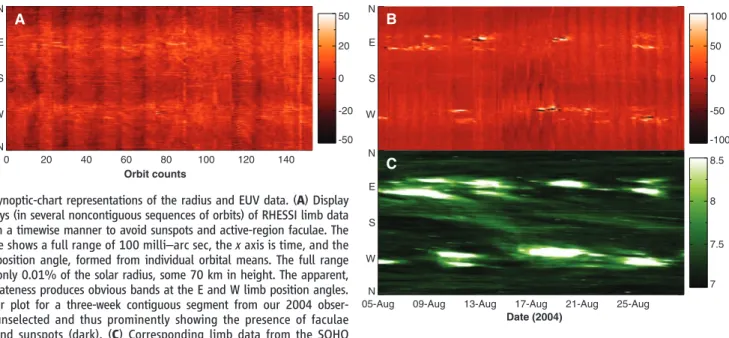
Fig. 1. Synoptic-chart representations of the radius and EUV data. (A) Display of ~10 days (in several noncontiguous sequences of orbits) of RHESSI limb data selected in a timewise manner to avoid sunspots and active-region faculae. The color scale shows a full range of 100 milli–arc sec, the x axis is time, and the y axis is position angle, formed from individual orbital means. The full range shown is only 0.01% of the solar radius, some 70 km in height. The apparent, excess oblateness produces obvious bands at the E and W limb position angles. (B) Similar plot for a three-week contiguous segment from our 2004 obser-vations, unselected and thus prominently showing the presence of faculae (bright) and sunspots (dark). (C) Corresponding limb data from the SOHO
observations in the EUV 284 Å band (18), which shows the locations of faculae and other kinds of magnetic activity. The contours of this synoptic map determine the data fraction for our masking analysis, as detailed in the SOM.
24 OCTOBER 2008 VOL 322 SCIENCE www.sciencemag.org 560