R
ETIREMENT AND CLAIMING:
AN INCREASING DIVIDEAnne-Lore Fraikin, University of Liège (Faculty of Law, Tax Institute and HEC-Liège) and UNU-MERIT/Maastricht University1
Alain Jousten, University of Liège (Faculty of Law, Tax Institute, and HEC-Liège), IZA and NETSPAR
01/09/2019 Abstract
The paper describes employment and retirement trends of employees aged 55 to 64 using a representative administrative panel dataset covering the years 2004 to 2010. It decomposes retirement and benefit claiming trends into four subcategories in order to analyze the possible dissociation of both phenomena. Our results show that numerous forms of early benefit claims in Belgium come along with continued benefit accrual – pointing at the importance of such a decomposition for labor market and fiscal analysis of delayed retirement. Though based on Belgian data, the analysis is highly relevant for other countries as situations of simultaneous work and benefit claiming are becoming increasingly common.
1 Fraikin acknowledges financial support through a FNRS/FRESH Doctoral Dissertation Fellowship. This paper
uses data from the European Union Labour Force Survey (Eurostat, European Union) under contract 122/2015 and from the Crossroads Database for Social Security (CBSS) under contract F 6/40/5 – MCF/FC. Eurostat and CBSS have no responsibility for the results and conclusions which are the authors’ only. Comments welcome at [email protected].
INTRODUCTION
Faced with population ageing and projected deficits of pay-as-you-go-financed public pension systems, numerous countries are facing hard policy choices. Ultimately, the necessary reforms boil down to a combination of three measures: increased contributions (or tax) financing, lowered benefits, or increases in the effective retirement age. Belgium is clearly no exception to these wider trends. To this date, Belgium has one of the lowest average effective retirement ages in the OECD – in spite of several decades of reforms to its (early-)retirement programs. In the period 2012-2016, the OECD average retirement age for men was 65.3, for women 63.6 (European Commission (DG-EMPL), 2018). Though up from the record lows of 58.3 and 56.4 in the mid-1990’s, Belgium still underperforms as compared to the OECD average with an average retirement age for men of 61.7 and 60.2 for women in the period from 2012 to 2016 (OECD, 2017).
Retirement reforms in Belgium have been of different types. On the one hand, access to early labor force exit routes outside the pension system has been tightened. On the other, efforts have been made to reduce the incentives for early claiming of old-age pension (OAP) benefits. Jousten and Lefèbvre (2016) report that there has been a steady upward trend in the activity rates of the elderly since the mid-1990’s, which can be traced back to the same wave of policy measures.
In the literature and the public debate, the transition from work to inactivity is often summarized into one single decision: “retirement”. “Retirement” is frequently equaled to jointly stopping to work and first claiming (early-) retirement benefits. Increasingly, however, individuals face more complex choice sets, that sometimes lead them to – optimally or not – disjoin labor market retirement from benefit claiming. For example, Coile et. Al. (2002) illustrates that substantial incentives might exist that could lead people to optimally disjoin the retirement and claiming decisions in the context of the US Social Security system. MacInnis (2009) reminds that retirement and benefit claiming are two separate decisions that individuals often approach simultaneously. Most importantly, social security reforms have the potential to affect both decisions differently – possibly disjoining them.
Research that focuses solely on a single binary decision regarding retirement yields an incomplete and biased view of how the social security system influences individual behavior and public finances. For example, the possibility of claiming social security benefits while working influences labor market decisions, if only through income effects. Also, from a public finance point of view, periods of claiming social security benefits generate immediate costs through benefit payouts (e.g., social assistance benefits) but may also generate substantial future fiscal costs (e.g., if periods of claiming complete the earnings history for pension purposes).
Distinguishing retirement2 from claiming and recognizing both short-and long-run fiscal costs of benefit claims are two issues of prime policy importance in Belgium. The country has a highly complex landscape of labor force exit and benefit claiming options – that are not always fine-tuned. Also, the ubiquitous nature of partial or full labor force exit options – even at rather young ages – renders the short-run but also the long-run fiscal stakes particularly high. To further accentuate the fiscal (and incentive) stakes, most Belgian social security benefits are associated with uninterrupted pension accruals combined with an absence of contribution payments. This is in sharp contrast to many other
social security systems in Europe and beyond (e.g., Germany and the US) where the strict application of a Bismarckian insurance logic ensures that benefit accrual is conditional on contribution payment.3
The present paper contributes in two ways to the literature. First, we analyze employment and retirement trends in Belgium using a detailed administrative panel dataset covering the period between 2004 and 2010, and we decompose these trends into four subcategories, disjoining work and claim statuses. Secondly, we analyze and compare the determinants of the retirement and the social security benefits claiming decisions. The aim of the paper is to describe the evidence of the combined retirement and claiming patterns and their evolution to pave the groundwork for more refined future analysis of individual incentive and fiscal cost considerations as outlined above.
The paper is structured as follows. The next section provides an overview of the Belgian social security system. Section 3 defines our classification of the population into four categories according to their retirement and benefit claiming status and summarizes the key characteristics of the datasets used in the analysis. Section 4 presents employment and retirement trends in Belgium from 2004 to 2010. Section 5 introduces the empirical strategy for section 6, that contains the analysis of the determinants of retirement and claiming. Finally, section 7 concludes.
THE BELGIAN SOCIAL SECURITY LANDSCAPE
The Belgian social security system is divided into three major regimes for the wage-earners, the civil-servants and the self-employed. In this paper, we focus on the first pillar pensions4 of the wage-earner regime, that has both the largest enrollment and represents the largest budgetary item in public old-age spending. The other two public pension regimes are sufficiently different not to consider them in the present paper: First, the scheme for civil servants (resp. self-employed) is characterized by higher (resp. lower) average benefits. Second, the financing of the three schemes differs substantially, with all (resp. a more substantial share of) budgetary funds stemming from general government revenues for civil servants (resp. self-employed).
Following the work of Jousten and Lefèbvre (2013) we describe the four main retirement pathways available to wage earners: the old-age pension (OAP), the unemployment insurance (UI), the disability insurance (DI) and the conventional early retirement (CER). Additionally, we take a closer look at the system of time credits (TC), as it sometimes allows partial or total withdrawal from the labor force.5 We describe each program and its reforms between 2004 and 2010.
The old-age pension (OAP)
The Belgian statutory old-age pension (OAP) system is essentially a pay-as-you-go system that is financed by tax-deductible employer and employee contributions as well as public transfers.6 The old-age pension amount is a function of the averold-age lifetime indexed wold-age: it varies between 60 percent
3 In Germany, as well as in large parts of Central and Eastern Europe, contribution payment by an individual or
on his behalf is required for periods of activity or covered inactivity. In the US, benefit accrual is linked to earnings only, simply excluding periods on other types of (replacement) income from pension accrual.
4 There exist three pillars in the Belgian pension system: the first one is composed of legal pensions, the second
one includes employer-provided private pension plans and the third one consists of private retirement savings.
5 In addition, social assistance benefits and pensions, as well as workplace accident and professional disease
benefits exist – but only play a less prominent role in the retirement debate.
6 For all social security branches combined, including pensions, health, unemployment, time credit, etc. the share
(single rate) and 75 percent (dependent spouse rate for one-earner married couples) of the average wage. It is subject to an absolute ceiling and a set of minima – the latter is only accessible for workers with a career longer than 30 years and is adjusted by the ratio of the number of years of career over 45 (full career condition). Other derived pension benefits exist, such as a pension for surviving spouses older than 45 and a social assistance pension that is granted on the basis of age, residence and nationality.
The statutory eligibility age and career requirements have been modified profoundly over the last decade. A major pension reform in 1997 has progressively increased the statutory eligibility age (resp. the career requirements) for women from 60 to 65 (resp. 40 to 45) in order to equalize the rules between men and women.7 The early eligibility age is set at 60 for both men and women and the career requirement for early retirement increased from 20 to 35 years from 1997 to 2005.8
Working and receiving old-age pension benefits is possible, though partial pension receipt is not. A pension bonus consisting of a lump sum amount for each day of continued work after age 62 or after a career of more than 44 years was introduced in 2007 and abolished in 2015.
Other retirement pathways
We describe the 3 main retirement pathways, other than the old-age pension.
First, unemployment insurance (UI) benefits are available to wage-earners who lose their job and have contributed to the social security system for a minimum number of years. Benefits are in general not time-limited, and can in principle be payable until reaching the old-age pension statutory eligibility age. The old age unemployment (OAU) program was introduced in 1985. It allows older workers to benefit from two key features: (i) a waiver of job search, and (ii) an unemployment supplement for seniority. In 2004, the minimum age for the waiver of job search was raised to 58 with a career of at least 20 years while the seniority supplement was still available at age 50. There also exists a special unemployment status for part-time workers and for temporary unemployed workers (such as manual workers).
Second, the disability insurance (DI) provides disability benefits to individuals who can prove a minimum of 66 percent loss of their earning capacity for at least 12 consecutive months.
Third, the conventional early retirement (CER) system provides another type of benefits to wage earners leaving the labor market. Upon satisfying lay-off, career and claiming age conditions, conventional early retirement beneficiaries are entitled to a two-tiered early retirement benefit: an unemployment benefit paid through the unemployment insurance scheme that is combined with a company supplement paid by the last employer. Although the eligibility criteria are high, conventional early retirement benefits are the most generous replacement benefits compared to the unemployment and disability benefits. The eligibility age of the conventional early retirement, which is generally lower than the early entitlement age of the old-age pension scheme, has undergone substantial reforms. In response to the growing proportion of older workers retiring through conventional early retirement, the
7 The statutory eligibility age (resp. career requirements) of women increased from 60 to 61, 62, 63, 64 and 65
(resp. 40 to 41, 42, 43, 44 and 45) in 1997, 2000, 2003, 2006 and 2009, respectively.
8 The career requirement for the early eligibility of the old-age pension increased from 10 to 20, 22, 24, 26, 28,
30, 32, 34 and 35 years in 1997, 1998, 1999, 2000, 2001, 2002, 2003, 2004 and 2005, respectively. Additionally, the early eligibility age and career requirements were increased during the period 2013-2019. In 2019, the early eligibility age is set at 63 with at least 42 years of career.
eligibility criteria were tightened over the years.9 In 2004, the conventional early retirement was accessible to workers aged more than 58 with at least 25 years of career or workers aged more than 60 with at least 20 years of career. In 2008, these eligibility criteria were tightened and the conventional early retirement became accessible at age 58 with at least 35 (resp. 30) years of career for men (resp. women) and at age 60 with at least 30 (resp. 26) years of career for men (resp. women). In 2010, the career condition at age 58 increased to 37 (resp. 33) years for men (resp. women).
Finally, another retirement pathway consists in first reducing one’s working hours at older ages. The time credit (TC) program allows for part time work and the receipt of a partial replacement income paid by the unemployment insurance system until the individual reaches the old-age pension statutory eligibility age. At older ages, there exist two types of time credit plans: one that allows for one half of work interruption and the other that allows for one-fifth of work interruption. While the latter is rather generally accessible as of age 55, the former requires many specific conditions including a specific number of years of career and type of job.
These benefits are (at most) payable until reaching the old-age pension statutory eligibility age – upon which participants are rolled over into the old-age pension system. Until 2012, periods where no contributions were paid, including periods of unemployment, illness, disability, conventional early retirement, time credit, could be included in the pension calculation as assimilated periods at the same rate as the last wage received.
KEY CONCEPTS AND DATA
Disjoint retirement and benefit claiming
In the literature and the public debate, the transition from work to inactivity at the end of a working life is often summarized into a single decision: retirement, that involves both stopping to work and starting the claim of some form of retirement benefits. While such a view on transitions might have been appropriate in the past, this is not necessarily the case anymore when individuals face complex incentives generated by modern-day social protection programs.
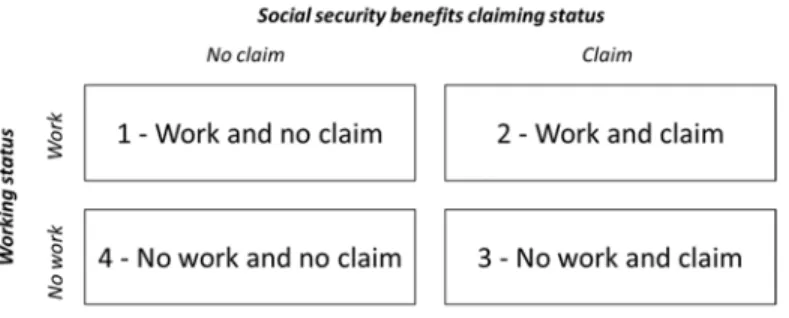
The Belgian social security system clearly generates an environment where retirement and old-age pension benefits claiming are no longer necessarily synchronized, be it optimally or in the facts. First, there is a wide array of pathways from work into retirement, some of which allow for a period of social security benefits receipt, included in the old age pension calculation at the rate of the last wage received. Second, some types of benefits are either explicitly or implicitly allowing situations of benefit receipt that is combinable with (continued or new) streams of work income. As a result, four possible categories emerge (with the associated transitions in between): (1) work and no claim, (2) work and
claim, (3) no work and claim, (4) no work and no claim.
1. The first category, work and no claim, comprises individuals who work (full or part-time) without receiving any type of social security benefits on the basis of their own earnings records. It also includes workers who receive derived pension benefits, such as the survivor pension or those workers whose spouse receive the dependent spouse pension benefits.
9 In this paper, we do not consider the numerous exceptions of eligibility rules for the CER that exist for workers
2. The second category, work and claim, includes individuals who work (mostly part-time10) and receive social security benefits based on their own earnings records at the same time. For instance, older workers can claim time credit benefits or receive benefits from temporary or part-time unemployment insurance, part-time conventional early retirement, part-time disability insurance, partial workplace injury, partial professional disease benefits, etc. Pensioners who receive old-age pension benefits can also work, subject to an earnings limit.
3. The third category, no work and claim, contains individuals who do not work and receive social security benefits based on their own earnings record. These social security benefits include the old-age pension but also programs that serve as early retirement programs such as the disability insurance, the conventional early retirement and the unemployment insurance.11 Individuals in this category can also combine benefits based on their own earnings records with the survivor pension or the dependent spouse benefits of the other spouse.
4. The fourth and last category, no work and no claim, includes people who neither work nor claim any social security benefits based on their own earnings records. It includes individuals who are financially dependent on their spouse or benefit from derived pension rights such as the survivor pension or the dependent spouse benefits through their partner’s earnings record.
Figure 1: The four categories of work and claim status
When introducing this classification, the idea is clearly not a pure accounting one. This type of grouping of individuals matters for real world policy problems. First, for researchers and policymakers interested in labor markets, it is key to know the characteristics of workers to gauge how labor might respond to policy changes. For example, when considering policies targeting a reduced tax wedge on labor, it is essential to understand what type of jobs are being created: are these new pure full-time jobs, or are they part-time jobs that allow for the claim of social security benefits. If the latter, the beneficial effect of extra workers are likely somewhat lower than in the first case and any possible self-financing effects of labor tax wedge reforms might be severely hampered.12
Second, for researchers interested in the long term financial sustainability of the pension system or the broader social protection system, the distinction between retirement and claiming also matters. For example, while time credit schemes and partial pension arrangements might induce some people to work longer, they may also have large fiscal costs if benefits are not adjusted in (at least) an actuarially fair way. Indeed, benefit claiming is often not only associated with current fiscal costs but also with
10 Most workers who work full-time in the work and claim category are receiving temporary unemployment
benefits or work injury benefits. They represent approximately 18.2 percent of total workers in the category work and claim.
11 Older workers can also receive social assistance benefits or pensions and work injury or professional disease
benefits.
12 The analysis of Capéau et al (2018) on the self-financing nature of recent labor tax reforms in Belgium could
differed fiscal liabilities, as periods on benefits do count towards the pension history, be it at the last wage or a lower lump-sum amount. In fact, differed fiscal costs can easily outweigh current costs because of non-linear accrual of future pension entitlements.13
The data
We use a detailed administrative panel dataset retrieved from the Datawarehouse Labor Market
and Social Protection of the Belgian Crossroad Bank for Social Security that combines data from
various social security institutions and the national registry.14 This dataset initially contains quarterly information for the years 2004 to 2010 on the labor market status and personal characteristics of 150,000 individuals aged between 50 and 63 in 2004.
We collapse the data into one single observation per year and per individual, using the information of the last quarter of each year, and we consider person-year observations as independent observations. We select individuals who were aged between 55 and 63 in 2004 and we follow them until 2010 or until they turn 64 years old. Each subsequent year, we add a cohort of individuals aged 55 at the end of that year and we follow them until 2010. Since contractual wage-earners workers represent the majority of workers in Belgium and because of the sheer complexity and differences between the working regimes in Belgium, we focus our attention on individuals with an attachment to this regime only.15 Therefore, we drop individuals who were never identified as contractual wage-earner in their career, workers who were identified as self-employed or civil servant in their first observation year, and the observations of workers who transferred to these regimes thereafter. We keep individuals who were claiming unemployment insurance, conventional early retirement and disability insurance in their first observation year as these programs are only accessible to wage-earners.16 Finally, we only keep pensioners who were working as contractual wage-earners or receiving benefits from a program accessible to contractual wage-earners the year prior to their retirement. Our final sample is composed of 75,862 individuals and 382,181 observations for years ranging from 2004 to 2010 and ages ranging from 55 to 64.17 In Figure 1, we report the key characteristics of sampled individuals as they appear in the first year they are observed.
Figure 1: Main characteristics of sampled individuals in the first year of observation
13 For example, as a result of pension accrual for periods of inactivity, individuals may pass some hurdles in
terms of minimum pension eligibility.
14 This dataset was initially created for the EMPOV project (Employment and Poverty in a Changing Society),
financed by the Belgian Science Policy Administration (BELSPO research project TA/00/45)
15 Contractual wage-earners include private and public sector contractual employees. Individuals with mixed
careers, i.e. that currently belong or have been affiliated with the civil servant or the self-employed regime in addition to their wage earner status are also included.
16 We also keep individuals who only benefit from a survivor’s pension, the dependent spouse benefits of the
other spouse, and those who depend financially on their working spouse if they were identified as contractual wage-earner at least once in their career. Civil servants often have a wide array of opportunities for benefits claiming or retirement, it seems unlikely that a civil servant would end up as dependent of the other spouse. Moreover, self-employed individuals would most probably have kept their company registered even after they retire and would thus still be identified as self-employed and not as dependent of the other spouse.
17 Because of the structure of the data, we do not have access to every age for every year of observation. We are
missing information on individuals aged 55 in 2009 and 2010, 56 in 2010, 64 and 65 in 2004 and 65 in 2005. Thus, in the next section, we keep the number of observations constant for these missing cases, based on the closest year observable of the same age. We do this in order to present figures that are constituted of the same number of cohorts for each year and age.
Note: Authors’ own calculations using CBSS dataset
In section 5, we use two subsets of the initial sample we have defined above. First, for the determinants of retirement, we restrict the sample to workers in the category work and no claim and
work and claim in their first year of observation and we follow them until they retire or until they exit
the initial sample. Secondly, for the determinants of claiming, we restrict the sample to the category
work and no claim in their first year of observation and we follow them until they start claiming social
security benefits or until they exit the initial sample. We disregard the first year of observation of individuals (year 2004 or age 55) in order to identify the transfer from employment to non-employment or non-claim to claim. We obtain a sample of 101,127 observations for the determinants of retirement and a sample of 66,581 observations for the determinants of claiming.
In the next section, we look at the employment and the retirement trends and we report their decomposition into our four categories from both an age and a year perspective.
EMPLOYMENT, RETIREMENT AND CLAIMING Trends in employment and retired proportions
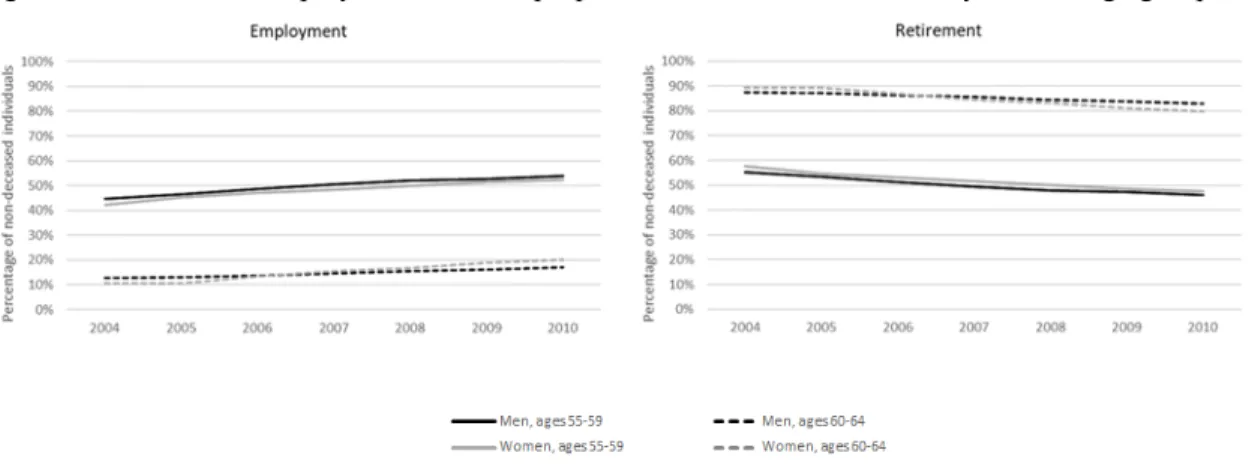
The Belgian labor market has undergone profound changes over the last three decades (Jousten and Lefèbvre, 2016). The employment rate of older men was declining until the mid-1990’s, after which it started to rise again, most importantly for the age group 55 to 59. The employment rate of women follows a long-term upward trend and has been growing faster than men’s employment rates. Figure 3 summarizes the evolution from 2004 to 2010 of the proportion of employed and retired older men and women, as retrieved from our dataset, and confirm these trends for the age groups18 of 55 to 59 and 60 to 64.19 Accordingly, the proportion of retired individuals in both age groups have been decreasing during the same observation period.
Many studies have identified the impact of institutional changes on the employment rate of older Belgian workers (see i.e. Pestieau and Stijns, 1999; Dellis et al, 2004; Jousten and Lefebvre, 2013; 2019). Jousten and Lefèbvre (2016) note that these labor market changes can be traced back to a wave of policy measures targeted at tightening early access to retirement that started in the late nineties.
18 In our dataset, the age of individual is defined as the age he or she will be at the end of a certain year. 19 Most of financially dependent women were not sampled for this analysis, this explains why the employment
rates of men and women are similar.
Female 31,794 (41.9%) Male 44,068 (58.1%) Walloon region 22,968 (30.3%) Flemish region 46,529 (61.3%) Brussels 6,365 (8.4%) Married 53,050 (69.9%) Unmarried 22,812 (30.1%) Type of household TOTAL 75,862 Region Sex
Figure 2: Evolution of employed and retired proportions from 2004 to 2010 – by sex and age groups
Source: Authors’ own calculations using CBSS dataset
Decomposition of employment rates
In Figure 3, we present at the decomposition of employment rates by age and social security claiming status. We find that the share of women in the group work and claim is slightly higher than for men: 21 (resp. 18) percent of working women (resp. men) aged 55 to 59 are claiming some type of benefits. Predictably, the proportion of workers decreases continuously with age – particularly at age 60, mostly because of transfers to the old-age pension at its early eligibility age. We observe that the retirement hazard rate through the old-age pension at the early eligibility age is relatively lower for workers in the group work and no claim: 32.8 percent (resp. 29.9 percent) of men (resp. women) in the group work and no claim transfer to the old-age pension at age 60 compared to 71.2 percent (resp. 46.4 percent) of men (resp. women) in the group work and claim. Moreover, on average, the retirement hazard rates of men and women in the group work and no claim is lower than in the group work and claim, as workers in the latter group have a higher tendency to transfer to early retirement programs such as the unemployment insurance, the conventional early retirement or the disability insurance.
Figure 3: Decomposition of employment by claiming status, by age and sex, period average 2004-2010
Source: Authors’ own calculations using CBSS dataset
In Figure 4, we decompose the group work and no claim into full-time and part-time working contracts. Full-time work is the main contract type for men aged 55 to 64. Yet, the proportion of men who work part-time increases from 6.5 percent at age 55 to 14 percent at age 64. In contrast, part-time jobs are much more common among older women as 57.7 percent of working women are identified as working part-time at age 55, a share that rises to 65.5 percent at age 64. Using labor force survey data, Jousten and Lefèbvre (2016) found a similar result, and impute it partly to a pre-existing larger stock of
part-time workers at younger ages - hence less an issue of increased transitions from full to part time employment later in life rather than the legacy of previously taken decisions. Indeed, we find that approximately 1.2 percent of women aged 55 to 64 transfer from full-time to part-time work.
Figure 4: Decomposition of work and no claim by work intensity, by age and sex, period average 2004-2010
Source: Authors’ own calculations using CBSS dataset
Next, we take a closer look at the decomposition of the category work and claim. Before the age of 60, men in this group are mostly claiming time credit and part-time unemployment benefits. Starting at age 60, workers can combine work and the receipt of old-age pension benefits, and this claim becomes the most important claim with 28.7% of total claims at age 64. The situation is roughly the same for women except for the fact that the time credit claim before age 60 and the combination of work and old-age pension benefits are relatively more important.
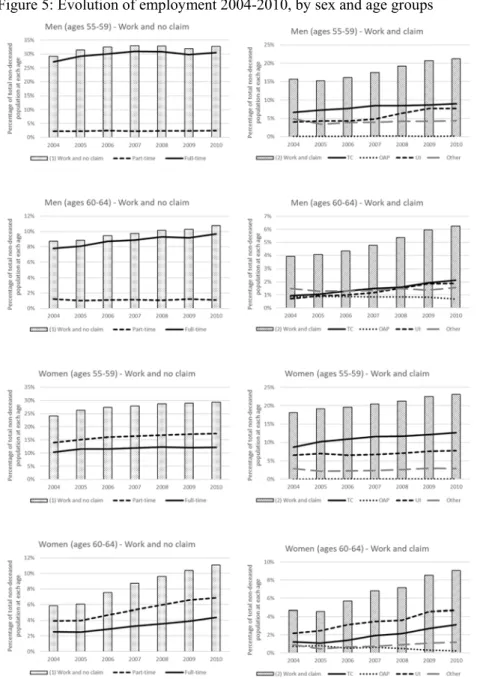
Figure 5 presents the details of the evolution of the employment rates between 2004 and 2010 by age groups, sex and according to the claiming status. We first observe that the share of workers in the group work and claim has increased20 at a faster pace than the share of workers in the group work and no claim for both sexes and age groups, although the share of workers in the former group remains
lower. We also note that the share of workers in the category work and no claim who are in part-time jobs has increased faster than the share of workers in full-time jobs, except for men aged 60 to 64. Finally, we find that 61 percent of the increase in employment rates of men aged 55 to 59 was caused by the group work and claim and only 39 percent by the group work and no claim. In contrast, the increase in employment rates of men aged 60 to 64 and of women aged 55 to 59 was caused in similar proportion by both work categories. At last, 45 percent of the increase in employment rates of women aged 60 to 64 was caused by the category work and claim.
The decomposition of work patterns and their evolution over time paint a less favorable picture than the mere aggregate employment trends of Figure 3: not only have employment levels changed but also the types of employment. Thus, our results coincide with the findings of Aliaj et. al. (2016) that total employment in Belgium has increased over time but average hours per worker has decreased because of a rise in part-time work arrangements.
From a fiscal point of view, part-timers and even more importantly workers in the group work
and claim contribute less to financing social security than full-timers do. Indeed, while part-timers and
workers in group work and claim in most cases work less hours, the latter group also represents an
20 The increase in the category work and claim was mostly caused by increases in the time credit and part-time
additional financial burden as the benefits they receive will be credited at the same rate as their last wage in the pension calculation – hence creating differed fiscal liabilities in addition to the current ones due to benefit payouts. Thus, when assessing the financial sustainability of the pension system, it is important to decompose the employment rates by claiming status. In our case, part-time workers and workers in the work and claim group make up approximately 40.6 percent of total employment of men aged 55 to 59; and 41.1 percent of total employment of men aged 60 to 64. Most importantly, the same proportion is approximately 83.5 percent of employed women aged 55 to 59 and 95.5 percent of employed women aged 60 to 64 – clearly non-negligible features both for labor markets and pension system sustainability. Figure 5: Evolution of employment 2004-2010, by sex and age groups
Decomposition of retirement rates
In this section, we first look at the decomposition of the no work categories by age and by social security benefits claiming status. Predictably, the proportion of men and women in the group no work
and claim increases with age and jumps at age 60 – a reflection of reaching the old-age pension early
eligibility age. The group no work and no claim remains a marginal phenomenon in Belgium – mostly confined to women who depend financially on their husband and transfer to the old-age pension as soon as they reach the statutory eligibility age of the old-age pension.
Figure 6: Decomposition of category no work by age and sex, period average 2004-2010
Source: Authors’ own calculations using CBSS dataset
Men in the group no work and claim mostly claim unemployment insurance and conventional early retirement benefits before age 60: the former claim exceeding the latter until age 57, after which the reverse is true from age 58 to 60 (the age at which the conventional early retirement becomes available). Women in the group no work and claim mostly claim unemployment benefits before age 60. Conventional early retirement claims are not as important for women as for men, partially because women are generally less likely to satisfy the strict career conditions and partially because the systems were directed towards industries with a predominantly male labor force. For both sexes, old-age pension claims start to increase from age 60 onwards but 78.9 (resp. 65.4) percent of men’s (resp. women’s) claims between ages 60 to 64 are constituted of early retirement programs such as the unemployment, the conventional early retirement and the disability insurance.
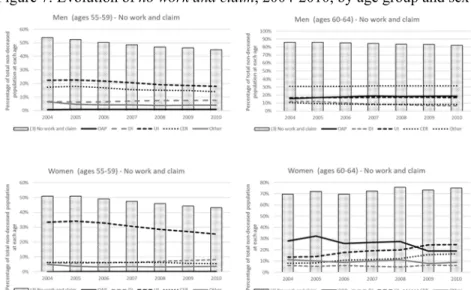
Figure 9 introduces the time dimension in the groups in no work and claim for our two age groups.21 We summarize a few salient features. The proportion of retired men in the group no work and
claim decreases over time for men in both age groups. This decline is partly caused by a reduction in
the use of unemployment insurance and conventional early retirement schemes for the age group of 55 to 59 – in line with the 2004 reform that increased the old-age unemployment eligibility age to 58 and the 2008 reform that increased the conventional early retirement eligibility age to 60 and imposed stricter career conditions. Regarding women aged 55 to 59, we also observe a decrease in the proportion of women in the group no work and claim caused by a decrease in the use of unemployment insurance while the disability insurance claims have increased– in line with results of Jousten and Lefèbvre (2016)). Finally, we observe the impact of the 1997 reform that increased the statutory eligibility age of women to 64 in 2006 and 65 in 2009 as the old-age pension claims of women aged 60 to 64 drop in 2006 and 2009, while the unemployment insurance, disability insurance and conventional early retirement claims increase between 2004 and 2010.
Figure 7: Evolution of no work and claim, 2004-2010, by age group and sex
Source: Authors’ own calculations using CBSS dataset EMPIRICAL STRATEGY
The decomposition of employment and retirement rates presented in the previous section suggests that Belgian workers follow very different retirement pathways. In the rest of the paper, we take a closer look at the determinants of retirement and claiming decisions.
Determinants of retirement
We use a probit model to estimate the probability of retiring.22 More specifically, we define the retirement decision as the transfer from the group work and no claim or work and claim to the group no
work and claim.23 Therefore, we use a subsample that is constituted of individuals who were in the group
work and no claim or work and claim in their first observation year and we drop them after they retire.24 We obtain a total of 101,127 observations.We use the following model:
𝑅𝑒𝑡𝑖𝑟𝑖𝑛𝑔 𝛽 𝛽 𝑐𝑙𝑎𝑖𝑚𝑖𝑛𝑔 𝛽 𝑝𝑎𝑟𝑡 𝑡𝑖𝑚𝑒 𝛽 𝑋 𝛽 𝑌 𝛽 𝑎𝑔𝑒 𝑖
𝛽 𝑦𝑒𝑎𝑟 𝑗 𝑢
Where 𝑅𝑒𝑡𝑖𝑟𝑖𝑛𝑔 is a dummy indicating if the individual i retires in year t, 𝑐𝑙𝑎𝑖𝑚𝑖𝑛𝑔 and 𝑝𝑎𝑟𝑡 𝑡𝑖𝑚𝑒 are dummies indicating whether the individual was claiming social security benefits or working part-time in t-1.25 𝑋 is a vector of individual and spousal characteristics including the sex, the marital status, the total years of career as a contractual wage-earner26, the region of residence and
22 We choose not to use panel methods such as random effects because we find little individual heterogeneity,
which, in addition, is plausibly correlated with the explanatory variables in our model. Moreover, we find too little variation within individual to use a fixed effect model.
23 We leave aside transfers to and from the fourth group as it represents only a minority of transfers.
24 Since we look at transfers from one state to another, we leave aside the first observation for each individual,
(2004 or age 55)
25 We use the information on labor market characteristics in the last quarter of each year. 26 These include years spent on replacement income and are regardless of the salary received.
the employment status of the partner (1 if the partner is employed, regardless of the claiming status). 𝑌 is a vector of eligibility status for social security programs: the early eligibility of the OAP, the statutory eligibility of the OAP and the conventional early retirement.27 We include dummies for the age and years to capture age-based focal points28 and time trends. We cluster the standard errors at the individual level.
Determinants of claiming
We use a probit model to estimate the probability of claiming social security benefits.22 We define the claiming decision as the transfer from the group work and no claim to the groups work and
claim or no work and claim.23 Therefore, we use a subsample that is constituted of individuals who were in the group work and no claim in their first observation year and we drop them after they start claiming social security benefits.24 We obtain a total of 66,565 observations. We use the following model:
𝐶𝑙𝑎𝑖𝑚𝑖𝑛𝑔 𝛽 𝛽 𝑝𝑎𝑟𝑡 𝑡𝑖𝑚𝑒 𝛽 𝑋 𝛽 𝑌 𝛽 𝑎𝑔𝑒 𝑖 𝛽 𝑦𝑒𝑎𝑟 𝑗 𝑢
Where 𝐶𝑙𝑎𝑖𝑚𝑖𝑛𝑔 is a dummy variable indicating whether the individual i starts claiming social security benefits in the group work and claim or in the group no work and claim in year t and
𝑝𝑎𝑟𝑡 𝑡𝑖𝑚𝑒 indicates whether the individual was working part-time in year t-1.25 𝑋 and 𝑌 are similar to the model used for the analysis on the determinants of retirement. We also include dummies for the age and years to capture age-based focal points28 and time trends. We cluster the standard errors at the individual level.
We run the same regression using a dependent variable that takes the value 1 if the individual transfers to the group work and claim, and 0 otherwise. Therefore, in this second regression, we look at the determinants of transferring from category work and no claim to work and claim.
RESULTS
In this section, we present the regression results we obtained from probit estimations on the determinants of retirement and benefits claiming.
Determinants of retirement
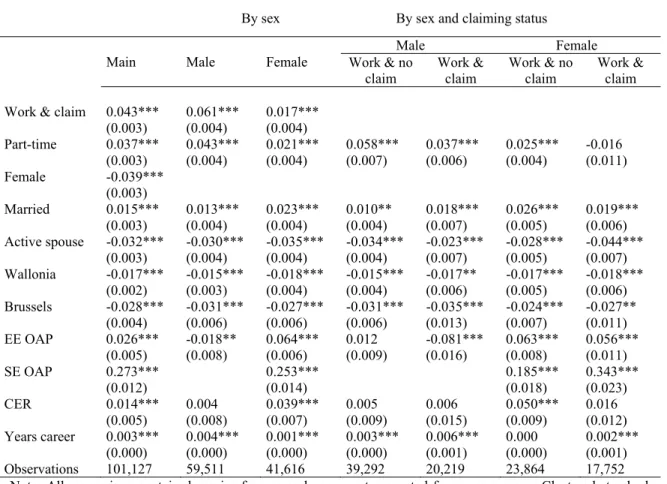
In Table 1, we present the average marginal effects from the total subsample and the results differentiated by sex and claiming status in year t-1. Being in the group work and claim and working part-time in year t-1 has a positive and significant impact on the retirement probability in year t for both men and women, but the effect is stronger for men than for women. Only the retirement probability of women in the group work and claim is not influenced by working part-time, possibly because of the correlation between the work and claim group and the part-time indicator. These results confirm what we observed in the previous section, workers in the group work and claim are more likely to exit the labor force earlier than workers in the group work and no claim. Moreover, we also find that workers in part-time contracts are more likely to exit the labor force earlier than workers in full-time contracts. These results are of prime importance for analyses on retirement behavior and short or long-run fiscal projections of benefit claims.
27 See the section on the Belgian social security landscape for details on these eligibility criteria 28 See Seibold (2017)
Being a female decreases the probability of retirement. Being married significantly increases the retirement probability of men and women, most importantly for the latter. In accordance with the literature on joint retirement29, having an active spouse decreases the probability of retirement for both men and women, and the effect is stronger for women in the category work and claim and men in the category work and no claim. We find that living in Wallonia or Flanders decreases the retirement probability. An additional year of career as a contractual wage-earner increases the probability of retirement for both sexes. Lastly, we find that the retirement probability increases with age (possibly because of correlation with health) and decreases over the years, in line with the wave of reforms that has tightened access to the unemployment insurance and to the conventional early retirement programs. Our eligibility variables for the early and statutory old-age pension (EE OAP and SE OAP) and the conventional early retirement (CER) have the expected positive sign and are significant for women (being eligible for the statutory old-age pension has a particularly strong effect for women), but it is not the case for men. Interestingly, we note that being eligible for the early old-age pension significantly decreases the retirement probability of men in the group work and claim. Finally, even when we account for these eligibility variables, we still find that age dummies at specific ages (58, 60, 64 and 65) have a stronger impact on the retirement probability than other ages.
Table 1: Determinants of retirement
By sex By sex and claiming status
Main Male Female
Male Female
Work & no
claim Work & claim Work & no claim Work & claim Work & claim 0.043*** 0.061*** 0.017***
(0.003) (0.004) (0.004) Part-time 0.037*** 0.043*** 0.021*** 0.058*** 0.037*** 0.025*** -0.016 (0.003) (0.004) (0.004) (0.007) (0.006) (0.004) (0.011) Female -0.039*** (0.003) Married 0.015*** 0.013*** 0.023*** 0.010** 0.018*** 0.026*** 0.019*** (0.003) (0.004) (0.004) (0.004) (0.007) (0.005) (0.006) Active spouse -0.032*** -0.030*** -0.035*** -0.034*** -0.023*** -0.028*** -0.044*** (0.003) (0.004) (0.004) (0.004) (0.007) (0.005) (0.007) Wallonia -0.017*** -0.015*** -0.018*** -0.015*** -0.017** -0.017*** -0.018*** (0.002) (0.003) (0.004) (0.004) (0.006) (0.005) (0.006) Brussels -0.028*** -0.031*** -0.027*** -0.031*** -0.035*** -0.024*** -0.027** (0.004) (0.006) (0.006) (0.006) (0.013) (0.007) (0.011) EE OAP 0.026*** -0.018** 0.064*** 0.012 -0.081*** 0.063*** 0.056*** (0.005) (0.008) (0.006) (0.009) (0.016) (0.008) (0.011) SE OAP 0.273*** 0.253*** 0.185*** 0.343*** (0.012) (0.014) (0.018) (0.023) CER 0.014*** 0.004 0.039*** 0.005 0.006 0.050*** 0.016 (0.005) (0.008) (0.007) (0.009) (0.015) (0.009) (0.012) Years career 0.003*** 0.004*** 0.001*** 0.003*** 0.006*** 0.000 0.002*** (0.000) (0.000) (0.000) (0.000) (0.001) (0.000) (0.001) Observations 101,127 59,511 41,616 39,292 20,219 23,864 17,752
Note: All regressions contain dummies for age and years, not presented for space reasons. Clustered standard errors are in parentheses. We omit the variable SE OAP for men because it is set at 65. The table reports the average marginal effects. *** p<0.01, ** p<0.05, * p<0.1
Determinants of claiming
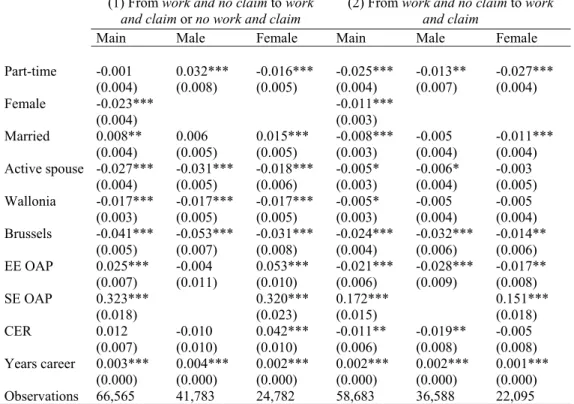
In Table 2, we present the average marginal effects of the total subsample and the results differentiated by sex using our two dependent variables: (1) claiming in the categories work and claim or no work and claim and (2) claiming in the category work and claim.
Using our first dependent variable, we find that working part-time significantly increases the claiming probability of men30, but it significantly decreases the claiming probability for women. If we look at our second dependent variable, that of claiming in the group work and claim, working part-time in the previous period significantly decreases the claiming probability for both men and women.
We find that being a female significantly decreases the claiming probability with both dependent variables. Interestingly, being married significantly increases (resp. decreases) the claiming probability of women but not of men using our first (resp. second) dependent variable. Having an active spouse significantly decreases the claiming probability using the first claiming dependent variable but this is only true if we look at claiming in the work and claim group only. Living in Wallonia or Brussels (as compared to living in Flanders) decreases the claiming probability when we look at the first claiming dependent variable. The same is true for living in Brussels once we consider claims in the group work
and claim but we do not find any significant difference between living in Flanders or in Wallonia.
Finally, we find that an additional year of career significantly increases the probability of claiming for men and women and for both dependent variables.
Being eligible for the early old-age pension and the conventional early retirement does not influence the claiming probability of men. However, we observe that being eligible for the early pension, statutory pension and the conventional early retirement significantly increases the probability of claiming of women using the first dependent variable. With our second dependent variable, we find that being eligible for the early old-age pension (and the conventional early retirement for men) significantly decreases the claiming probability of men and women. This could be caused by the fact that these individuals would prefer transferring to the generous early retirement programs in the group no work
and claim rather than choosing to stay on the labor force in the group work and claim.
30 It is plausible that this effect is influenced by the same factors as in the analysis on the determinants of
Table 2: Determinants of claiming
(1) From work and no claim to work
and claim or no work and claim (2) From work and no claim to work and claim
Main Male Female Main Male Female
Part-time -0.001 0.032*** -0.016*** -0.025*** -0.013** -0.027*** (0.004) (0.008) (0.005) (0.004) (0.007) (0.004) Female -0.023*** -0.011*** (0.004) (0.003) Married 0.008** 0.006 0.015*** -0.008*** -0.005 -0.011*** (0.004) (0.005) (0.005) (0.003) (0.004) (0.004) Active spouse -0.027*** -0.031*** -0.018*** -0.005* -0.006* -0.003 (0.004) (0.005) (0.006) (0.003) (0.004) (0.005) Wallonia -0.017*** -0.017*** -0.017*** -0.005* -0.005 -0.005 (0.003) (0.005) (0.005) (0.003) (0.004) (0.004) Brussels -0.041*** -0.053*** -0.031*** -0.024*** -0.032*** -0.014** (0.005) (0.007) (0.008) (0.004) (0.006) (0.006) EE OAP 0.025*** -0.004 0.053*** -0.021*** -0.028*** -0.017** (0.007) (0.011) (0.010) (0.006) (0.009) (0.008) SE OAP 0.323*** 0.320*** 0.172*** 0.151*** (0.018) (0.023) (0.015) (0.018) CER 0.012 -0.010 0.042*** -0.011** -0.019** -0.005 (0.007) (0.010) (0.010) (0.006) (0.008) (0.008) Years career 0.003*** 0.004*** 0.002*** 0.002*** 0.002*** 0.001*** (0.000) (0.000) (0.000) (0.000) (0.000) (0.000) Observations 66,565 41,783 24,782 58,683 36,588 22,095
Note: All regressions contain dummies for age and years, not presented for space reasons. Clustered standard errors are in parentheses. We omit the variable SE OAP for men because it is set at 65. The table reports the average marginal effects. *** p<0.01, ** p<0.05, * p<0.1
CONCLUSION
The paper identifies the different retirement and claiming pathways used by Belgian workers. Nowadays, individuals face much more complex incentives for retirement generated by modern social protection programs, which sometimes lead them to – optimally or not – disjoin retirement from benefit claiming.
We present the employment and retirement trends of Belgian workers aged from 55 to 64 and from 2004 to 2010 using a detailed administrative dataset on contractual workers. We decompose the population into four subgroups and propose a descriptive analysis of their composition: (i) work and no
claim, (ii) work and claim, (iii) no work and claim and (iv) no work and no claim.
We argue that such a classification is essential and should be explored using a microsimulation model to quantify the importance both from a labor market and a public finance perspective. For example, the contribution of part-time workers (with and without partial benefit claim) in terms of hours of work and in terms of financing social protection is likely noticeably smaller than the one of full-time worker without any active benefit claim. Such considerations even go one step further from a public finance perspective, as numerous forms of early benefit claims in Belgium come along with continued benefit accrual – adding a second intertemporal dimension to the public finance considerations. Our results indicate that older men in part-time contracts or in the group work and claim make up approximately 40 percent of the total of older workers, whereas for women the figure even surpasses 80
percent. These numbers are sufficiently large to make them highly relevant for both questions relating to the outcomes the labor market and to challenges in pension system sustainability.
Our results show that employment rates for both men (especially between ages 55 and 59) and women are overall increasing while the proportion of retired individuals has decreased. Indeed, we find that the proportion of individuals claiming benefits from the conventional early retirement and unemployment insurance have decreased, in line with the wave of reforms that has tightened their eligibility criteria. More importantly, once we decompose the increase in employment rates, we note that the situation is not as encouraging as it seems. Indeed, an important part of the increase in employment rates is attributable to increase in part-time work (mostly for women) and in the group work
and claim (caused by increases in time-credit and part-time unemployment claims). We also find that
the proportion of both men and women in the group work and claim has increased faster than in the group work and no claim. Most importantly, we find that individuals in the group work and claim (resp. individuals in part-time working arrangements) have a higher probability to retire compared to workers in the group work and no claim (resp. workers in full-time working arrangements). Moreover, we find that eligibility for early and statutory old-age pension and for the conventional early retirement does not have a large effect on the retirement probability of men but has a positive and strong impact on the retirement probability of women (especially the statutory eligibility age for the old-age pension). Finally, we find that working part-time decreases the probability of transferring to the group work and claim. We also note that being eligible for the early old-age pension decreases the probability of claiming benefits.
Our results point at the added value of decomposing the employment and retirement trends into subcategories when performing fiscal projections of social security systems. While the case is particularly strong in Belgium with its double cost associated with benefit claims (direct and differed fiscal costs), this approach is also highly relevant for other countries as situations of simultaneous work and claim are becoming increasingly common in other countries too, hence affecting both the financing and the expenditure side of social security programs.
Also, this richer matrix classification in terms of both retirement and claiming status provides a basis for a better understanding of recent labor market trends. Increasingly common situations where employed are already claiming some form of (early-)retirement benefit and where pension beneficiaries are continuing to work after age 65 are often associated with part-time work – rendering the borders between work and retirement ever blurrier.
BIBLIOGRAPHY
Aliaj, A., Flawinne X. , Jousten A., Perelman S. & Shi L. (2016), “Old‐
Age Employment and Hours of Work Trends: Empirical Analysis for Four European Countrie s”, IZA Discussion Paper 9819
Capéau, B., Decoster, A., Maes, S., & Vanheukelom, T. (2018), “Betaalt de taxshift zichzelf terug?”,
Leuvense Economische Standpunten (Short).
Coile, C. (2004), “Retirement Incentives and Couple's Retirement Decisions”, Topics in Economic
Analysis & Policy, Vol. 4, No. 1.
Coile, C., Diamond, P., Gruber, J., & Jousten, A. (2002), “Delays in claiming social security benefits”,
Journal of Public Economics, 84, pp. 357-385.
Dellis, A., R. Desmet, A. Jousten, and S. Perelman (2004), “Micro‐ Modeling of Retirement in Belgium”, In Social Security Programs and Retirement around the World: Micro‐Estimation, edited by J. Gruber and D. Wise, Chicago: University of Chicago Press, pp. 41–98.
European Commission (DG-EMPL) (2018), “The 2018 Pension Adequacy Report: Current and future income adequacy in old age in the EU”, Luxembourg: Publications Office of the European Union.
Gustman, A. L., & Steinmeier, T. L. (2004), “Social security, pensions and retirement behaviour within the family”, Journal of Applied Econometrics, Vol. 19, No. 6, pp. 723-737.
Hurd, M. D. (1989), “The joint retirement decision of husbands and wives”, Social Security Bulletin, Vol. 59, No. 1, pp. 29-32.
Jousten, A., & Lefbvre, M. (2013), “Retirement Incentives in Belgium:Estimations and Simulations Using SHARE Data”, De Economist, pp. 253-276.
Jousten, A., & Lefebvre, M. (2016), “Older men's labor force participation in Belgium”, NBER Working Papers 24669, National Bureau of Economic Research.
MacInnis, B. (2009), “Social security and the joint trends in labor supply and benefits receipt among older men”, Center for Retirement Research at Boston College, Working paper 2009-22. Pestieau P, Stijns J (1999), “Social security and retirement in Belgium”, In: Gruber J, Wise D (eds)
Social security and retirement around the world: micro-estimation, University of Chicago Press,
Chicago, pp. 37-71.
OECD (2017), Pensions at a Glance 2017: OECD and G20 Indicators. Paris: OECD Publishing.
Seibold, A. (2017), “Reference Dependence in Retirement Behavior: Evidence from German Pension Discontinuities”, mimeo, London School of Economics.