DOI:10.25082/HE.2020.01.004
RESEARCH ARTICLE
Simulation of the photochemical ozone production coming from
neighbourhood: A case applied in 150 countries
Modeste Kameni Nematchoua
Abstract: The main objective of this research is to Evaluate, analyse, to compare and discuss the pho-tochemical ozone production coming from one neighbourhood initially located in Belgium. Which the same neighbourhood design is applied in 150 countries, by applying four parameters adapted to each country such as: energy mix, local climate, building materials and occupants’ mobility. In addition, this research evaluates the induced environmental costs of the neighbourhood over a life cycle of 100 years in some countries located on the five continents. The results show that in the case of sustainable neighbourhoods, the photochemical ozone production is 14.3% higher in the Low than High income countries. Photovoltaic panel has a significant effect on the photochemical ozone production; indeed, it allows to reduce between 5-10% of this one. By 2030, if each of the 150 studied countries, increases up to 30% the renewable energy rate in its own energy mix, to the current examples of countries such as: Denmark, Finland, Sweden, Switzerland, Costa Rica, DRC, Nepal, Tajikistan . . . , so, Photochemical Ozone Production will decrease from 32% to 45% depending on the region. An average of 56% of photochemical ozone potential (POP) is produced during the operational phase of the neighbourhood.
Keywords: simulation, ozone, inventory, eco-neighbourhood, countries, environmental impact
1
Introduction
Since 1960, the world population has grown rapidly, so that today, this population is estimated around seven billion people. This population will reach 9 billion by 2030. As a result, a strong pressure of the human on the environment, generating global warming of the planet. Human activity alters the composition of the atmosphere and causes the destruction of the ozone layer[1].
Unlike other gases, ozone is not emitted directly by natural processes or by human activities. It results solely from photochemical reactions. The stratospheric contain-ing 90% of the total amount of ozone is the main reser-voir of the troposphere ozone[1]. Ozone is a secondary pollutant, which means that it is not directly produced by automobile traffic, industry, etc., but rather that it is formed, under the action of solar radiation, on the basis of several “precursor” pollutants.
Received: March 12, 2020 Accepted: March 24, 2020 Published: March 30, 2020 Correspondence to: Modeste Kameni Nematchoua. Beneficiary of an AXA Research Fund postdoctoral grant, Research Leaders Fellowships, AXA SA 25 avenue, Matignon 75008, Paris, France & LEMA, Ar Gen Co Department, University of Li`ege, Belgium & Department of Architectural Engineering, Pennsylvania State University, USA & Indoor Environmental Quality Lab, School of Architecture, Design and Planning, University of Sydney, Australia; Email:kameni.modeste@yahoo.fr
Citation: Nematchoua MK, Simulation of the photochemical ozone production coming from neighbourhood: A case applied in 150 countries. Health Environ, 2020, 1(1): 38-47.
Copyright: © 2020 Modeste Kameni Nematchoua. This is an open access article distributed under the terms of theCreative Commons Attribution License, which permits unrestricted use, distribution, and reproduction in any medium, provided the original author and source are credited.
Since the beginning of the 20th century, the ozone con-tent of the troposphere has increased, mainly for transport reasons. However, it is seen that the speed and rate of increase vary from one region of the world to another[2]. Globally, troposphere ozone acts differently on the en-vironment and human health than stratospheric ozone, which protects us from ultraviolet radiation[3]. Indeed, it is the same molecule, but, its impacts vary according to the content in the air and altitude[4]. The study of ozone concentration is subject to continuous monitoring by global and local observing networks.
Some gas, such as nitrogen oxides (NOx) or volatile
organic compounds (VOCs), common pollutants, have the capacity to produce ozone and other air pollutants in the presence of solar radiation[5]. Ozone is needed in the upper atmosphere to protect the Earth’s surface from ultraviolet radiation. However, troposphere ozone causes crop damage and increased cases of asthma and other respiratory conditions[5]. The summer pollutions (smogs), covering the big agglomerations are the most ob-vious highlighting of the high emissions of gases, which contribute to the creation of photochemical ozone at low altitude. The use of fuel in engines is the main cause of nitrogen oxide emissions[6]. Most organic compounds are used in paints and other coatings. The Potential for Tro-posphere Photochemical Ozone Creation (POCP) impact category allows us to measure the relative capacity of a gas to generate ozone in the presence of nitrogen oxides
and solar radiation[5,6].
According to Andersson et al.[7], the concentrations of photochemical ozone creation potentials (POCP) vary according to the calculation method and the chemical environment (NOx). Reeves et al.[8]Showed that much
of the mid and lower North Atlantic troposphere is in a state of slow photochemical O3 destruction. Several
researchers such as Anenberg et al.[9], Brauer et al.[10], and Lim et al.[11] found that the rate of ozone-related deaths accounted for between 5 and 20% of all deaths from the atmospheric pollution. In a report published in 2012, the Organization for Economic Cooperation and Development (OECD)[12] said that by 2050, if no law is proposed, the first environmental cause of premature mortality in the world should be air pollution. Brhland Crutzen[13]suggested a reaction, for exciting the oxygen formation from ozone photolysis, as one of the solution to the problem of ozone intensity evaluated to be above 45 km. Recent research of Nematchoua and al.[14]in Bel-gium, showed that the photochemical ozone production is 75% higher in standard than sustainable neighbourhoods. European Directive 2001/81/EC (known as the “NEC” Directive) imposes emission ceilings for atmospheric pol-lutant precursors of troposphere ozone (VOC and NOx)
not to be exceeded from 2010. These ceilings expressed in kiloton’s (kt), are applicable until 2019. The maxi-mum values imposed for Belgium were 139 and 176 kt, respectively for VOCs and NOx[15].
The main purpose of this research is to evaluate, anal-yse and compare photochemical ozone potential gener-ated by a neighbourhood initially locgener-ated in Belgium, which the same model has been designed in 150 coun-tries, by considering for each country: local climates, local energy mix, local use of materials and local mo-bility behaviours. Thus, the present study concerns a whole neighbourhood and it is not limited to the case of a country, but it will be studied in 150 countries, with very different climates and energy mix. The quantification and analysis of photochemical ozone impact related to the im-plementation of photovoltaic panels on the neighbouring roofs are also not limited to a specific region or climate; almost all the climatic zones of the world through 150 countries have been studied. This work did not focus on a single life cycle stage (for example, renovation or use) like some previous studies, but all four phases (construc-tion, use, renova(construc-tion, and demolition) have been evaluated. Methodology, results and discussions are presented in the next sections.
2
The research methodology
Environmental analysis of a sustainable neighbourhood located in Belgium (Europe) have been carried out over
100 years, and then, the same design have been adopted in 149 other countries, while keeping four parameters spe-cific to each country: energy mix, local climate, building materials, and occupants’ mobility. In addition, the costs related to three environmental impacts have been calcu-lated: greenhouse effect, energy demand and biodiversity degradation. Finally, different design parameters have been varied to quantify their effects on the environmental costs of the neighbourhood. Overall, this methodology is divided into five main sections:
(1) Neighbourhood selection and site modelling; (2) LCA of the selected neighbourhood;
(3) Modelling the same neighbourhood in 149 other countries with adaptation of the four local parameters and life cycle assessment;
(4) Calculation of the cost of the one studied environ-mental impacts;
(5) Applying one scenario for mitigating some environ-mental costs.
The following sections (2.1 to 2.6) will describe some methodological choices: the case study, the chosen coun-tries and databases, the environmental database and the environmental indicators studied, the LCA simulation software used, the environmental cost calculation method, the improvement scenario tested.
2.1
Initial analysis of the eco-neighbourhood
This neighbourhood have been initially located in the Liege city in Belgium, and the same design have been adapted in 149 countries represented in the world. The Sart-Tilman eco-neighbourhood in Liege is one of the privileged places of Belgium, where the concepts of a sustainable neighbourhood have been applied. This eco-neighbourhood offers different types of buildings (ter-raced and semi-detached houses, apartment buildings, etc.). A majority of the built surface is dedicated to hous-ing, but also spaces dedicated to commercial functions or the liberal professions and small businesses have been found. In total, 40 small apartments, 45 larger homes, 11 single-family duplex homes and 6 complementary func-tions (businesses and shops) can be counted. Private parking spaces are planned near the buildings. All the dwellings located on the ground floor have a private gar-den.The site is strongly served by public transport linking it to the centre of Liege, thanks to the proximity of the university. The neighbourhood has a built density of 40 dwellings per hectare. Outdoor spaces are landscaped with more than 30% “green” or “blue” surfaces and sep-arate water management for rainwater and wastewater. Rainwater recovery systems and tanks are also imple-mented.
In this research, only the neighbourhood residential part was studied. The calculated environmental impacts correspond to the residential eco-district of 3.5 ha com-prising 1 ha of roads, driveways and parking lots, 17800 m2 of green space, 19740 m2 of floor space, housing
around 219 inhabitants, studied on a life cycle of 100 years.
2.2
Design of the same eco-neighbourhood in
other countries
The same eco-neighbourhood is built in 150 capitals located in 150 countries. The choice of the capital, for representing each country was not random; indeed, in the most of these countries, the capital was considered as the most populated regions of the country, with the highest pollution rate and energy consumption. This strong popu-lation concentration has a significant influence on all the environmental impacts.
Four parameters were simultaneously applied for adapt-ing this neighbourhood in each country: the energy mix of each country, the local climate of each country, typ-ical building materials used in each country and occu-pants’ mobility.Figure 1shows the different investigation places.
Figure 1. Geo-location of studied sites of design of eco-neighbourhood in the 150 analysed countries
The International Energy Agency (IEA) database[16] and the Energy Information System of each country were used to gather the information on the energy mix and electricity mix. On the Pleaides ACV software, it was possible to freely select the different energy components mix (in %) or electricity mix (in %), such as: nuclear, fuel, coal, gas and renewable energy; then, assigning their corresponding values.
The information on the local climate of each country was evaluated with the most recent Meteonorm software version. The Meteonorm is defined as a meteorological database with climatological data for every location on the globe[17]. The fixed database in Meteonorm 7.3.1 contains approximately 6,200 cities, 8,325 weather stations, and
1,200 Design Reference Year sites.
The information on the construction materials was es-timated on the basis of 2018-2020 standard thermal reg-ulation of each country, but also from information is-sue to the UN-habitat, and some literature reviews (for some African and Asian countries, without recent build-ing standards). Regardbuild-ing inhabitant mobility, the data were freely selected on Pleaides ACV software. These data are based on a different rate of occupants commuting daily: 80% in developed countries (USA, Japan, Ger-many, France, UK etc.) and 50% in developing countries (Cameroon, Madagascar, Haiti, Thailand, etc.). Distance of the weekly commute between home and trade is 1000 m; distance from the public transport network is 500 m, distance from the daily commute to work is on average between 5000 m and 10000 m. Presence of bike path, public transportation: bus, subway and tram. These are the standard values suggested by this software.
2.3
Environmental database and studied
indi-cators
The environmental data used to come from the ECOIN-VENT database developed by different research institutes based in Switzerland. These data include, for each pro-cess and material, a life cycle inventory that contains all material and energy flows into and out of the system[18]: (i) resources consumed (water, energy, etc.); (ii) emis-sions in the different natural environments: air, water or soils (ammonia in water, metals in the soil, CO2, etc.); (iii)
waste created (inert, toxic or radioactive). The version 2.2 (2012) of the ECOINVENT database was used. This version was completed by the latest version, ecoinvent 3.5 (2018). The development of this database follows pro-cesses that have been verified several times to make sure they are reliable and the contents of this database have been verified and validated by international experts. The ECOINVENT Centre is recognized as an international leader in environmental sustainability data and it is well known for the transparency of its methods[19]. The (01) environmental impacts of the studied neighbourhood and the production of photochemical ozone (via the Ozone Depletion Potential, ODP) were assessed[20–22].
2.4
LCA simulation software
In this study, a combination of all the new IZUBA energy software was applied. Indeed, the interface of the most recent version (Pleaides ACV software, version 4.19.1.0) is divided into 6 modules: Library, Modeller (called ALCYONE for the old software version), BIM, Editor(called COMFIE-PLEIADES), Results, and ACV (nova-EQUER). It is important to notice that each module
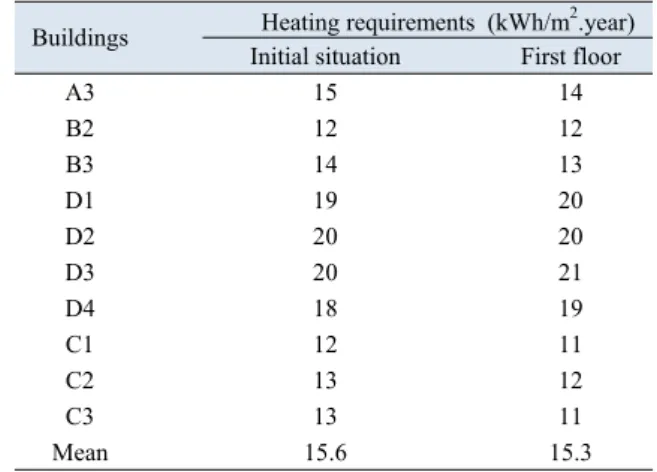
has a precise function. All of them are regularly used by numerous international research laboratories and have been clearly validated by the scientific community[23–25]. Modeler, ALCYONE software, is a graphical input tool. It allows the description of the geometry of a building, to represent its solar masks and to define the composition of the walls. By using this software, the zoning of the building where the thermal behaviour is homogeneous[23] were also defined. This software is essentially made up of five components: Generals (Construction Data, Project Library, LCA Association, Weather and Horizon); Plan; 3D; Calculation. This neighborhood was regrouped in 10 blocks with heating requirements showed inTable 1. Table 1. Heating requirements of different neighborhood build-ings
Initial situation First floor
A3 15 14 B2 12 12 B3 14 13 D1 19 20 D2 20 20 D3 20 21 D4 18 19 C1 12 11 C2 13 12 C3 13 11 Mean 15.6 15.3
Heating requirements (kWh/m2.year) Buildings
Editor, COMFIE-PLEIADES software, allows the performance of dynamic thermal simulation for build-ings[23,24]. The geometry created via “Modeller” can be imported from the information entered concerning the ma-terials, the occupation scenarios and the meteorological data, the software evaluate the heating and air condition-ing needs. It is possible to disaggregate the results based on thermal zone or by a period of time.
ACV module, nova-EQUER, is the environmental qual-ity assessment tool. The requirements calculated in “Ed-itor” are exported and additional inputs are provided to complete the LCA. It includes data such as the energy mix, the mobility of users, the constitution of outdoor spaces and networks. The software then performs the LCA of the buildings and neighbourhood and presents re-sults in the form of radars compiling the different impacts with the possibility of visualizing the part of each phase of the life cycle and comparing different variants of the same project[24]. This module is essentially made up of:
(1) Building/neighbourhood data
The original data come from the Pleiades, this ther-mal/ACV coupling allows to automatically recover all the characteristics of the building: data on the structure of the
building and the elements involved in thermal calculations and/or energy consumption. These data are then supple-mented with specific LCA data: all elements that are not part of the thermal study; general and administrative data concerning the current operation and the building or neighbourhood; specific or adjusted seizures for energy, water, waste, and transport.
(2) Software organization
The Pleaides ACV interface is structured around five axes:
(a) Library: Environmental Impact Data Libraries, Gen-eral Calculation Characteristics. In this research, the fol-lowing parameters have been fixed: surplus of materials at the site 5%, default typical service life of families of element: interior and exterior doors 30 years, global equipment 20 years, glazing 30 years, coating 10 years; distance of transport: site of production towards the build-ing site 100 km, site towards inert discharge finally of life: 20 km.
(b) Project: Project management with structure data for any type of project and use of the building with the EQUER engine. In this research, the following param-eters have been fixed: Loss of electrical network from 9% to 40% according to country. Water system yield: 80%, hot water consumption 40 L/day/person; cold water consumption 100 L/day/person; Selective collection of glass: yes; sorted glass: 90%; incinerated waste 40%; re-covery to incineration; substituted energy: gas or fuel oil (depending on the country); recovery yield: 80%; selec-tive collection of paper: yes; sorted paper: 80%; distance from the site to the garbage dump: 20 km; distance from the site to the incinerator: 10 km; distance from the site to the recycling centre: 100 km.
(c) Experimentation: Specific seizures PEBN E+C-; (d) Calculation and results: Start the calculations and consult the results.
(e) Neighbourhood: Neighbourhood Management. Several of this hypothesis are found in standard ISO14040[38], and ISO14044[39].
2.5
Environmental cost calculation method
The three environmental impacts will be translated into environmental costs, which make them comparable to each other. The cost calculation is based on the method Monetization of the MMG (Global method monetize) updated in 2017[25], which is based on the methodolo-gies developed previously by Debacker et al.[26]and De Nocker et al.[27]Monetary values of each environmental indicator have been determined in this methodology[25] for three regions: Western Europe, Belgium and the rest of the world. Note that the error margin related to theTable 2. Environmental cost of each phase of the eco-neighbourhood in Belgium €/dwelling 157.1 98.1 13.8 8.6 269.8 €/m2 0 0.4 0 0 0.4 €/inhabitant 7.2 4.5 0.6 0.03 12.2 €/dwelling 398.9 248.8 35.1 2.2 684.9 €/m2 0 1.1 0 0 1.1 €/inhabitant 18.2 11.3 1.6 0.1 31.2 Dismantling ECC Photochemical product 2030 2050 Environmental
impacts Year € /unit Construction Operation Maintenance
monetary value is low. Table 2 shows the conversion values of the environmental impacts in environmental costs.
2.6
Mitigation of impacts
In this study, one scenario to study the mitigation poten-tial of one sustainable strategy on the calculated environ-mental impacts and costs have been applied. This strategy consisted of applied photovoltaic panels combined with better inhabitants ‘mobility behavior’.
In the initial scenario, all the electricity used to come from the electricity grid of each country, and the produc-tion impacts were taken into account. In this new config-uration, a photovoltaic system will be on all the roofs on the site. Installed photovoltaic panels cover a total area of 580 m2equivalent to a peak power of 82857.14 W. It must be noted that homes use electricity only for light and to power household appliances. The installation will consist of monocrystalline photovoltaic solar panels. The sensors will be placed using support on the roof terrace. They will be oriented toward the south in the northern hemisphere and toward the north in the southern hemisphere; they will also be inclined at 37◦for the countries located in the temperate and cold zones, and inclined at 45◦for the countries located in the hot zone. This allows us to have an optimal inclination in all the countries. The thermal simulation of each building has been then performed and completed the final LCA of the neighbourhood.
The impact of mobility on the neighbourhood’s envi-ronmental record has now to be looked at. In the basic scenario, a significant use of the car for daily commuting has been considered. This scenario will be compared with a second one, where the site is considered urban, perfectly integrated with public transport networks and at a short distance from the shops of primary needs. The mobility hypotheses are: (i) Initial scenario: 80% of the occupants commute daily in developed countries and 50% of the occupants commute daily in developing countries; the distance from home to work on 5-10 km is carried
out daily by car; the distance from home to shops of 1 km is done weekly by car. (ii) New scenario or “Urban Site” scenario: 100% of the occupants make the trip daily in all the countries; the distance from home to work on 2-5 km is done daily by bus; the distance from home to shops of 0.5-1 km is carried out weekly by bike or on foot. Finally, both scenarios have been combined to obtain a mixed scenario having a significant effect on the three environmental impacts assessment materials.
2.7
Scenario
The different projections were conducted under the basis of scenario A2 established by the IPCC[34]. The A2 scenario is at the higher end of the SRES emissions scenarios (but not the highest), and this was preferred because, from an impacts and adaptation point of view, if one can adapt to a larger climate change, then the smaller climate changes of the lower end scenarios can also be adapted to. A low emissions scenario potentially gives less information from an impacts and adaptation point of view. In addition, the current actual trajectory of emis-sions (1990 to present) corresponds to a relatively high emissions scenario. The hourly data of the last thirty years of temperature, relative humidity, wind speed, sunshine were used in this circumstance.
3
Results and analysis
This section gives some details regarding the origin and cost of photochemical ozone production at the scale of the neighbourhood. POCP is calculated based on ethylene as the reference substance. The United Nations Economic Commission for Europe has defined the characterization factors for the POCP. They are calculated for two scenar-ios: a relatively high NOxbackground concentration and
a relatively low background concentration[1].
The indicator of formation of photo-oxidants is as showed inEquation (1):
Photo - oxidant formation=P
With mi= mass of substance; i released in kg. The indicator is therefore expressed in kg of ethylene equivalent (C2 H4). Photochemical production results
from the dissociation of nitrogen dioxide (NO2) by
ul-traviolet radiation. This reaction constituting the main source of atomic oxygen (O) in the lower layers of the atmosphere as showed inEquation (2):
N O2+ hv→ O + NO (2)
Atomic oxygen combining with molecular oxygen (O2)
to form ozone, as shown inEquation (3):
O + O2→ O3 (3)
And the production of ozone is however limited by its reaction of nitric oxide: as shown inEquation (4):
N O + O3→ NO2+ O2 (4)
Ozone production is very dependent on sunshine. The photochemical cycle of formation and destruction of ozone has a non-linear character and hence its complexity. TheFigure 2showed different intensity of photochemi-cal ozone production. TheFigure 1shows the different Intensity of Destruction of Troposphere Ozone. The Fig-ure 2showed different intensity of photochemical ozone production. It is seen toward this picture the different intensity of destruction of Troposphere Ozone.
In Figure 2(1) and Figure 2 (2), it is seen a strong human pressure on nature, the environment tends to grad-ually deteriorate, as a direct consequence: the thickness of the ozone layer becomes more fragile. InFigure 2(3), Figure 2(4) andFigure 2(5), it is seen that the ozone layer is further destroyed by the strong pressure of global warming, lets through, the ultraviolet rays of any kind.
Figure 2 (7) andFigure 2 (8) show the future state of degradation of the layer, in case the temperature will increase between 3-5◦C in the next decade according to estimates by the IPCC.
3.1
Analysis of Photochemical ozone
produc-tion
In the Figure 3, it is seen that in Northern America, the 56%, and 28% of photochemical ozone production are issued for operation, and construction phases, respec-tively. In Northern Africa, Asia and Europe, an average of 58%, and 31.5% of this one is produced during oper-ation, and construction phases. In addition, in southern America, and Asia, retrofit phase produces the 12% of total photochemical ozone.
These results show that the majority of photochemical ozone production was issued during “operation or use phase”. These findings further enhance the results of
Figure 2. Global Warming and Intensity of Destruction of Tro-posphere Ozone[28,29]
some specialists in the field[30,40]. These results show that the majority of photochemical ozone production was issued during “operation or use phase”. This is not sur-prising, indeed, during the operational phase, which the duration of the life cycle of buildings is estimated at 100 years in this study, the occupants pollute the atmosphere enormously.
It is seen that the pollution rate is very high in devel-oped countries, especially in the USA and in the European Union. This may be due to the behaviour of the occupants. Indeed, the ecological footprint is very high in developed countries.
3.2
Analysis of photochemical ozone
produc-tion per square meter living space
InFigure 4, the photochemical ozone production is of 0.01 kg ethylene/m2in UK, France, Brazil and Belgium. This one, is two times higher in Cameroon and Nigerian, than the previous countries (UK, France, Belgium . . . ). It is interesting to notice that the photochemical ozone pro-duction is about 4.5% (in the European Union), 2.8% (in South Africa), 42.8% (in USA and Australia), and 17.7%
Figure 3. Distribution of Photochemical ozone production fre-quency of different phase of sustainable neighbourhood in several world regions
(in High-income countries); lower, than the world aver-age. In addition, (POP), is 14.3% (in Japan and India),and 5.7% in Africa; higher than world average.
Figure 4. Assessment of photochemical ozone production per square meter coming from a sustainable neighbourhood dis-tributed in some countries, regions and continents in the world
3.3
Photovoltaic effect on the photochemical
ozone production
As shown inFigure 5, Photovoltaic panel has a sig-nificant effect on the photochemical ozone production, indeed, it allows to reduce up to 8.6% of this one. It is interesting to notice that photovoltaic impact on the photochemical ozone production, vary according to cli-mate types. For example, in temperate zone, photo-chemical ozone production decrease up to 9.70% (from 9.07 kgC2H4/dwelling to 8.18 kgC2H4/dwelling); in
tropical climate, photochemical ozone, decrease up to 7.67% ( between 12.31 kgC2H4/dwelling and 11.37
kgC2H4/dwelling). However, it has been noticed that in
some coastal countries such as Madagascar island, Italy, Egypt, the implementation of photovoltaic in a sustain-able neighbourhood accelerated the photochemical ozone production.
Figure 5. Comparative diagram of the photochemical ozone production impact of the “Initial” and “Photovoltaic” Scenarios (Functional Unit: dwelling)
3.4
Environmental components and costs
Figure 6 shows the frequency of the different envi-ronmental components in the generation of the photo-chemical ozone production in 29 representative countries located in the five continents of the world (Europe, Amer-ica, AfrAmer-ica, Asia, and Oceanic). The total photochemical ozone production concentration coming from each com-ponent is 40.3% (from building material), 36.4% (from electricity), the 3.9% (from water), 3.5% (transportation), 2.4% (heating building), and 3.4% (from waste). These results show that the main source of photochemical ozone production is “building material” followed of “electric-ity production”. In China, USA, India, Indonesia and Spain, the electricity is the first source generating the pho-tochemical ozone production. Despite that, it has been noticed that, the contribution of building material is still very significant.
Figure 6. Frequency (%) of the different environmental com-ponents in the generation of the photochemical ozone production, for some countries located in the five continents of the world
All these different components are automatically given by the simulation tool[14]. Photochemical ozone is very dangerous, indeed, it decreases the photosynthesis ac-tivity in plants, thus limiting their growth. This leads to yield losses in agricultural and forestry crops. This
one reinforces the greenhouse effect, contributes to the deterioration of paints, plastics, rubber and nylon.
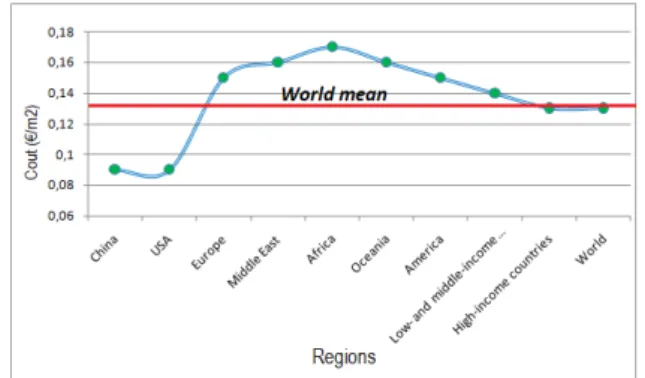
An average of 13.5% photochemical ozone production comes from heating in France and Canada. In theFigure 7, it is seen that the global photochemical ozone production over 50 years is 0.013 C/m2. In China, such as in USA,
the photochemical ozone production cost is 30.7% lower than mean world. In Europe, such as in America countries, the photochemical ozone production cost is 15.4% higher than mean world. In Africa, the Photochemical ozone production cost is expected to be 0.17 C/m2over 50 years of life cycle of neighbourhood. Some relevant data are showed inFigure 7.
Figure 7. Photochemical ozone production over 50 years per square meter
Globally, photochemical ozone productioncostis 7.7% higher in Middle income countries than High-income countries. This result is not surprising, indeed, this last decade, the photochemical ozone production concentra-tion has considerably increased in the countries having Low and Middle incomes.
4
Discussion
In this research, it has been found that the photo-chemical ozone production is 31% during the construc-tion of neighbourhood, 57% (operaconstruc-tional phase), and 11.9%(retrofit phase). Only, the 0.1% of photochemical ozone is produced during the demolition of the neigh-bourhood. The operational phase is the most important of four phases of neighbourhood’s life cycles. In other studies applied in other neighbourhood’s types, similar results were found[30–32]. This result is similar for the majority of environmental impacts, excepted the impact from waste, which the production rate is more important in the demolition phase of building.
The photochemical ozone concentrations measured far from the precursor sources are higher than those mea-sured near the emitting sources themselves[33]. For ex-ample, suburban and rural areas are more affected than
urban areas by peak ozone concentrations[34]. Globally, in functional unit: square meter, the photochemical ozone production is 14.3% higher in Low income than High income countries. This one is 10.8% higher in Africa countries than European Union countries. In addition, the photochemical ozone production is 2 times higher in Canada than the USA, then 2 times higher in Turkey than France, 2 times lower in Brazil and Germany than India and Japan. This huge difference may be due to weather conditions favouring the emergence of high con-centrations of ozone such as high air temperature, low air humidity, long sunshine, high irradiation, and a low synoptic wind speed. These previous results seem to be more connected with sustainable neighbourhoods. An extension can be assessed with old neighbourhoods. The effect of Photovoltaic (PV),on Ozone is positive, because, solar energy is the main source of PV. This study shows that the 8.6% of ozone’s damage can be reduce by using PV in the neighbourhood scale.
Overall, PV effect depend on kind of environmental impact. For example some studies showed that PV al-low to mitigate up to 10% of energy consumption in the residential buildings in temperate climate, but increases the waste quantity[35]. Other ones showed that the PV, according to the climate can generate a negative effect on the biodiversity[36]. The strong photochemical ozone pro-duction has an impact on human health. Indeed, it causes irritation of the respiratory tract and eyes, decreased phys-ical performance and deterioration of lung function[36]. The electricity production is one of the main components of the photochemical ozone production at the neighbour-hood scale. Globally, in Europe, the photochemical ozone cost is 7.1% higher than Low income countries.
In Africa, this one is 6.3% higher than Middle Eastern. The fight against the destruction of the ozone layer is a concern of all nations. According to IPCC[?], the total contribution to the greenhouse effect is 60% of H2O; 26%
of CO2; 8% of O3and 6% of (CH4+ N2O), these data may
be of interest to the researchers to protect the ozone layer (O3), because its destruction causes significant damage.
5
Conclusion
This research evaluated the photochemical ozone pro-duction in a neighbourhood initially located in Belgium. The same neighbourhood has been built in 149 other coun-tries by respecting some parameters own at each country, such as the use of different materials, the heating/cooling systems, the energy mix, the buildings insulation thick-nesses, mobility, the climate related to the temperatures. The detailed study of this environmental impact is very important, indeed, ozone is involved in the greenhouse
effect. It is the third greenhouse gas in terms of global warming potential after CO2 and CH4. The buildings
classified after the industries and transports have a great influence on the photochemical ozone production. During 100 years of the neighbourhood’s life cycle, it has been found that the majority of photochemical ozone produc-tion (57%) is emitted during the exploitaproduc-tion phase. In the sustainable neighbourhoods, the photochemical ozone production concentration is 14.3% higher in Low income countries than High income countries. The implemen-tation of PV shows a positive effect on the protection of photochemical ozone production. Today, the electric-ity and building material represent the main component of photochemical ozone. This study analyses the pho-tochemical ozone production in many countries. The applied methodology is easily reproducible to other kind of neighbourhoods. The next step in the research will suggest, analysis and compare some scenarios, allowing to reduce the photochemical ozone rate at neighbourhood scale.
References
[1] Montzka SA, Dutton GS, Yu P, et al. An unexpected and persistent increase in global emissions of ozone-depleting CFC-11. Nature, 2018, 557(7705): 413.
https://doi.org/10.1038/s41586-018-0106-2
[2] Ziemke JR, Oman LD, Strode SA, et al. Trends in global tropospheric ozone inferred from a composite record of TOMS/OMI/MLS/OMPS satellite measurements and the MERRA-2 GMI simulation. Atmospheric Chemistry and Physics, 2019, 19: 3257-3269.
https://doi.org/10.5194/acp-19-3257-2019
[3] Mudway IS and Kelly FJ. An investigation of inhaled ozone dose and the magnitude of airway inflammation in healthy adults. American Journal of Respiratory and Critical Care Medicine, 2004, 169: 1089-1095.
https://doi.org/10.1164/rccm.200309-1325PP
[4] Yang Q, Chen Y, Shi Y, et al. Association between ozone and respiratory admissions among children and the elderly in Vancouver. Inhalation Toxicology, 2003, 15: 1297-1308. https://doi.org/10.1080/08958370390241768
[5] Ziegler F . Environmental Life Cycle Assessment of Seafood Products from Capture Fisheries. International Journal of Life Cycle Assessment, 2007, 12(1): 61. https://doi.org/10.1065/lca2006.11.286
[6] Guinee JB, Heijungs R, Huppes G, et al. Life Cycle Assess-ment Past Present and Future. EnvironAssess-mental ence & Tech-nology, 2011, 45(1): 90-96.
https://doi.org/10.1021/es101316v
[7] Andersson-Skold Y, Grennfelt P and Pleijel K. Photochem-ical Ozone Creation Potentials: A study of Different Con-cepts, Journal of the Air & Waste Management Association, 1992, 42(9): 1152-1158.
https://doi.org/10.1080/10473289.1992.10467060
[8] Reeves CE, Penkett SA, Bauguitte S, et al. Potential for photochemical ozone formation in the troposphere over the
North Atlantic as derivedfrom aircraft observations during ACSOE. Journal of Geophysical Research, 2002, 107(D23): 4707.
https://doi.org/10.1029/2002JD002415
[9] Anenberg SC, West JJ, Fiore AM, et al. In-tercontinental Impacts of Ozone Pollution on Human Mortality. Environ-mental Science & Technology, 2009, 43: 6482-6487, https://doi.org/10.1021/es900518z
[10] Brauer M, Amann M, Burnett RT, et al. ExposureAssess-ment for Estimation of the Global Burden of Disease At-tributable to Outdoor Air Pollution. Environmental Science & Technology, 2012, 46: 652-660.
https://doi.org/10.1021/es2025752
[11] Lim SS, Vos T, Flaxman AD, et al. Comparative risk assess-ment of burden of disease andinjury attributable to 67 risk factors and risk factor clusters in 21 regions, 1990-2010: a systematic analysis for the Global Burdenof Disease Study 2010. Lancet, 2012, 380(9859): 2224-2260.
https://doi.org/10.1016/S0140-6736(12)61766-8
[12] OECD Environmental Outlook to 2050, OECD Publishing, 2012.
[13] Br¨uhl C and Crutzen PJ. Scenarios of possible changes in atmospheric temperatures and ozone concentrations due to man’s activities, estimated with a one-dimensional coupled photochemical climate model. Climate Dynamics, 1988, 2(3): 173-203.
https://doi.org/10.1007/BF01053474
[14] Nematchoua MK, Orosa J and Reiter S. Life cycle assess-ment of two sustainable and old neighbourhoods affected by climate change in one city in Belgium: A review. Envi-ronmental Impact Assessment Review. 2019, 78: 106282 https://doi.org/10.1016/j.eiar.2019.106282
[15] Festy B. Urban atmospheric pollution: sources, pollu-tants and evolution. Bulletin de l’Academic nationale de medecine, 1997, 181(3): 461-474.
[16] Site web of International Energy Statistics. https://www.eia.gov
[17] Remund J, Muller S, Kunz S, et al. Global Meteorological Database Version 7 Software and Data for Engineers, Plan-ers and Education. Meteo Test Fabrik strasse 14 CH-3012 Bern Switzerland. 2017: 1-17.
https://www.meteotest.com
[18] Peuportier B. Life Cycle Assessment applications in the building sector. International Journal of Environmental Technology & Management, 2008, 9(4): 334-347. https://doi.org/10.1504/ijetm.2008.019455 [19] Ecoinvent LCI database.
https://simapro.com/databases/ecoinvent/?gclid=CjwKCAj wsdfZBRAkEiwAh2z65sg-fOlOpNksILo
[20] Goedkoop M and Spriensma R.TheEco indicator 99: A dam-age oriented method for lifecycle impact assessment. 2000: 142.
[21] Guine JB, Gorreeb M, Heijungs R, et al. Lyfe cycle assess-ment; an operational guide to the ISI Standard, 2001: 704. [22] Ellis BA. Life Cycle Cost, 2007: 2-8.
http://www.barringer1.com/lcc.xls
[23] Colombert M, De Chastenet C, Diab Y, et al. Analyse de cycle de vie `a l’´echelle du quartier: un outil d’aide `a la deci-sion? Le cas de la ZAC Claude Bernard `a Paris (France). En-vironnement Urbain/Urban Environment, 2011, 5: c1-c21. https://doi.org/10.7202/1007605ar
[24] Salomons T, Coan J, Hunt S, et al. Assessing the impact of the pain face: Modulation of the pain experience by a voluntary facial display. Journal of Pain, 2005, 6(3-supp-S): S64.
https://doi.org/10.1016/j.jpain.2005.01.253
[25] Leo De Nocker, VITO - Wim De backer, VITO. Annex: Monetisation of the MMG method (update 2017). 2018: 1-65.
[26] Chan ALS . Energy and environmental performance of building fa?ades integrated with phase change material in subtropical Hong Kong. Energy & Buildings, 2011, 43(10): 2947-2955.
https://doi.org/10.1016/j.enbuild.2011.07.021
[27] Schaafsma M, Brouwer R, Liekens I, et al. Temporal stabil-ity of preferences and willingness to pay for natural areas in choice experiments: A test-retest. Resource & Energy Eco-nomics, 2014, 38: 243-260.
https://doi.org/10.1016/j.reseneeco.2014.09.001
[28] Pictures fromhttps://commons.wikimedia.org/wiki/File:TO MS indonesia smog lrg.jpg
[29] Report of IPCC Working Groups I and III. Preservation of the Ozone Layer and the Global Climate System: Issues Re-lated to Hydrofluorocarbons and Perfluorocarbons, 2005. [30] Trigaux D, Allacker K and De Troyer F. Life Cycle
Assess-ment of Land Use in Neighbourhood s. Procedia Environ-mental Sciences, 2017, 38: 595-602.
https://doi.org/10.1016/j.proenv.2017.03.133
[31] Nematchoua MK, Teller J and Reiter S. Statistical life cycle assessment of residential buildings in a temperate climate of northern part of Europe. Journal of Cleaner Production, 2019, 229: 621-631.
https://doi.org/10.1016/j.jclepro.2019.04.370
[32] Nematchoua MK and Reiter R. Analysis, reduction and comparison of the life cycle environmental costs of an eco-neighbourhood in Belgium. Sustainable Cities and Society, 2019, 48: 101558.
https://doi.org/10.1016/j.scs.2019.101558
[33] Direction G´en´erale de l’Airet du Climat (DGEC) - Bilan de la qualit´e de l’airen, 2012.
[34] IPCC 2007 -Fouth report assessment.
[35] Marique AF and Reiter S. A simplified framework to assess the feasibility of zero-energy at the neighbourhood /commu-nity scale. Energy and Buildings, 2014, 82: 114-122. https://doi.org/10.1016/j.enbuild.2014.07.006
[36] Nematchoua MK and Reiter S. Life cycle assessment of an eco-neighbourhood : influence of a sustainable urban mo-bility and photovoltaic panels. IAPE ’19, Oxford, United Kingdom.
[37] Amann M, Bertok I, Borken-Kleefeld J, et al. An updated set of scenarios of cost-effective emission reductions for the revision of the Gothenburg Protocol - Background paper for the 49th session of the working group on strategies and review - Geneva, September 12-15, 2011.
https://www.semanticscholar.org/paper/An-Updated-Set-o f-Scenarios-of-Cost-effective-for-Amann-Bertok/d526801 d85a580a7a894298543dc75b5b8c2f0bb
[38] ISO (international Standardization Organization). International Standard ISO 14040. Environmental management -Life cycle assessment - Principles and framework, 2006. [39] Khasreen MM, Banfill PFG and Menzies GF. Life-Cycle
As-sessment and the Environmental Impact of Buildings: A Re-view.Sustainability, 2009, 1: 674-701.
https://doi.org/10.3390/su1030674
[40] The Intergovernmental Panel on Climate Change(IPCC), re-port 2001.