HAL Id: dumas-01839915
https://dumas.ccsd.cnrs.fr/dumas-01839915
Submitted on 16 Jul 2018HAL is a multi-disciplinary open access archive for the deposit and dissemination of sci-entific research documents, whether they are pub-lished or not. The documents may come from teaching and research institutions in France or abroad, or from public or private research centers.
L’archive ouverte pluridisciplinaire HAL, est destinée au dépôt et à la diffusion de documents scientifiques de niveau recherche, publiés ou non, émanant des établissements d’enseignement et de recherche français ou étrangers, des laboratoires publics ou privés.
Distributed under a Creative Commons Attribution - NonCommercial - NoDerivatives| 4.0 International License
Search for decompensation risk factors within the
EGPRN multimorbidity’s definition themes. Cohort
pilot study, follow up at 18 months in nursing home
Tiphaine Rosec
To cite this version:
Tiphaine Rosec. Search for decompensation risk factors within the EGPRN multimorbidity’s definition themes. Cohort pilot study, follow up at 18 months in nursing home. Life Sciences [q-bio]. 2017. �dumas-01839915�
1
THESE DE DOCTORAT EN MEDECINE
DIPLOME D’ETAT
Année : 2017
Thèse présentée par :
Mme Tiphaine ROSEC
Née le 8 Septembre 1990, à LANDERNEAU
Thèse soutenue publiquement le 7 décembre 2017
SEARCH FOR DECOMPENSATION RISK FACTORS WITHIN THE EGPRN MULTIMORBIDITY’S DEFINITION THEMES. COHORT PILOT STUDY, FOLLOW UP AT 18 MONTHS IN NURSING HOME.
Président Mr le Professeur Jean-Yves LE RESTE
Membres du jury Mr le Professeur Jean-Yves LE RESTE
Mr le Docteur Bernard LE FLOC’H Mr le Docteur Benoit CHIRON Mme le Docteur Delphine LE GOFF
2
UNIVERSITE DE BRETAGNE OCCIDENTALE
FACULTE DE MÉDECINE ET
DES SCIENCES DE LA SANTÉ DE BREST
PROFESSEURS EMÉRITES
Professeur CENAC Arnaud Médecine interne
Professeur COLLET Michel Gynécologie obstétrique
Professeur LEHN Pierre Biologie cellulaire
Professeur YOUINOU Pierre Immunologie
DOYENS HONORAIRES: Professeur H. H. FLOCH Professeur G. LE MENN () Professeur B. SENECAIL Professeur J. M. BOLES Professeur Y. BIZAIS ()
Professeur M. DE BRAEKELEER ()
3
PROFESSEURSDES UNIVERSITÉS- PRATICIENS HOSPITALIERSEN SURNOMBRE
LEFEVRE Christian Anatomie
MOTTIER Dominique Thérapeutique
RICHE Christian Pharmacologie fondamentale
PROFESSEURSDES UNIVERSITÉS - PRATICIENS HOSPITALIERSDE CLASSE EXCEPTIONNELLE
BOLES Jean-Michel Réanimation Médicale
COCHENER-LAMARD Béatrice Ophtalmologie
DEWITTE Jean-Dominique Médecine et santé au travail
FEREC Claude Génétique
GILARD Martine Cardiologie
JOUQUAN Jean Médecine interne
OZIER Yves Anesthésie-réanimation
ROBASZKIEWICZ Michel Gastroentérologie
PROFESSEURSDES UNIVERSITÉS - PRATICIENS HOSPITALIERSDE 1ère CLASSE
BAIL Jean-Pierre Chirurgie digestive
BERTHOU Christian Hématologie
BLONDEL Marc Biologie cellulaire
BOTBOL Michel Pédopsychiatrie
BRESSOLLETTE Luc Chirurgie Vasculaire
4
DE PARSCAU DU PLESSIX Loïc Pédiatrie
DELARUE Jacques Nutrition
DEVAUCHELLE-PENSEC Valérie Rhumatologie
DUBRANA Frédéric Chirurgie orthopédique et traumatologique
FENOLL Bertrand Chirurgie Infantile
FOURNIER Georges Urologie
GENTRIC Armelle Gériatrie et biologie du vieillissement
GOUNY Pierre Chirurgie Vasculaire
HU Weiguo Chirurgie plastique, reconstructrice et esthétique
KERLAN Véronique Endocrinologie, Diabète & maladies métaboliques
LACUT Karine Thérapeutique
LE MEUR Yannick Néphrologie
LE NEN Dominique Chirurgie Orthopédique et Traumatologique
LEROYER Christophe Pneumologie
LOZAC’H Patrick Chirurgie Digestive
MANSOURATI Jacques Cardiologie
MARIANOWSKI Rémi Oto-rhino-laryngologie
MERVIEL Philippe Gynécologie obstétrique
MISERY Laurent Dermatologie
NEVEZ Gilles Parasitologie et mycologie
NONENT Michel Radiologie et imagerie médicale
PAYAN Christopher Bactériologie-virologie
REMY-NERIS Olivier Médecine Physique et Réadaptation
SALAUN Pierre-Yves Biophysique et médecine nucléaire
5
SIZUN Jacques Pédiatrie
STINDEL Eric Biostatistiques, informatique médicale et technologies de
communication
TIMSIT Serge Neurologie
VALERI Antoine Urologie
WALTER Michel Psychiatrie d’adultes
PROFESSEURSDES UNIVERSITÉS - PRATICIENS HOSPITALIERSDE 2ème CLASSE
ANSART Séverine Maladies infectieuses
AUBRON Cécile Réanimation
BEN SALEM Douraied Radiologie et imagerie médicale
BERNARD-MARCORELLES Pascale Anatomie et cytologie pathologiques
BEZON Eric Chirurgie thoracique et cardiovasculaire
BROCHARD Sylvain Médecine physique et réadaptation
COUTURAUD Francis Pneumologie
DAM HIEU Phong Neurochirurgie
DELLUC Aurélien Médecine interne
GIROUX-METGES Marie-Agnès Physiologie
HERY-ARNAUD Geneviève Bactériologie-virologie
HUET Olivier Anesthésiologie-réanimation
LE MARECHAL Cédric Génétique
LE ROUX Pierre-Yves Biophysique et médecine nucléaire
L’HER Erwan Réanimation
6
MONTIER Tristan Biologie cellulaire
NOUSBAUM Jean-Baptiste Gastroentérologie
PRADIER Olivier Cancérologie
RENAUDINEAU Yves Immunologie
SEIZEUR Romuald Anatomie
PROFESSEURS DES UNIVERSITES DE MEDECINE GENERALE
LE RESTE Jean Yves Médecine Générale
LE FLOC'H Bernard Médecine Générale
PROFESSEUR ASSOCIÉ DES UNIVERSITES DE MEDECINE GENERALE (à mi-temps)
BARRAINE Pierre Médecine Générale
PROFESSEUR DES UNIVERSITES CONTRAT LRU
BODRON Anne Biologie cellulaire
MAITRES DE CONFERENCESDES UNIVERSITÉS - PRATICIENS HOSPITALIERS HORSCLASSE
JAMIN Christophe Immunologie
MOREL Frédéric Biologie et médecine du développement et de la reproduction
7
MAITRES DE CONFERENCESDES UNIVERSITÉS - PRATICIENS HOSPITALIERSDE 1ère CLASSE
ABGRAL Ronan Biophysique et médecine nucléaire
CORNEC Divi Rhumatologie
DE VRIES Philine Chirurgie infantile
DOUET-GUILBERT Nathalie Génétique
HILLION Sophie Immunologie
LE BERRE Rozenn Maladies infectieuses
LE GAC Gérald Génétique
LE GAL Solène Parasitologie et mycologie
LODDE Brice Médecine et santé au travail
MIALON Philippe Physiologie
PLEE-GAUTIER Emmanuelle Biochimie et biologie moléculaire
QUERELLOU Solène Biophysique et médecine nucléaire
TALAGAS Matthieu Histologie, embryologie et cytogénétique
VALLET Sophie Bactériologie-virologie
MAITRES DE CONFERENCESDES UNIVERSITÉS - PRATICIENS HOSPITALIERSDE 2ère CLASSE
BRENAUT Emilie Dermato-vénérologie
CORNEC-LE GALL Emilie Néphrologie
LE VEN Florent Cardiologie
MAGRO Elsa Neurochirurgie
PERRIN Aurore Biologie et médecine du développement et de la reproduction
8
SCHICK Ulrike Cancérologie
UGUEN Arnaud Anatomie et cytologie pathologiques
MAITRE DE CONFERENCESDE MEDECINE GENERALE
NABBE Patrice
MAITRES DE CONFERENCES ASSOCIESDE MEDECINE GENERALE (à mi-temps)
BARAIS Marie CHIRON Benoît DERRIENNIC Jérémy
MAITRES DE CONFERENCESDESUNIVERSITÉS DE CLASSE NORMALE
BERNARD Delphine Biochimie et biologie moléculaire
DERBEZ Benjamin Sociologie démographie
KARCHER Brigitte Psychologie clinique
LANCIEN Frédéric Physiologie
LE CORRE Rozenn Biologie cellulaire
MIGNEN Olivier Physiologie
9
MAITRE DE CONFERENCESASSOCIE DES UNIVERSITES (à temps complet)
MERCADIE Lolita Rhumatologie
MAITRES DE CONFERENCESDESUNIVERSITÉS CONTRAT LRU
DANY Antoine Epidémiologie et santé publique
GILLES Marlène Génie informatique, automatique et traitement du signal
PROFESSEURS CERTIFIES/AGREGES DU SECOND DEGRE
MONOT Alain Français
10
REMERCIEMENTS
A Monsieur le Professeur Jean-Yves Le Reste, merci de m’avoir guidée, accompagnée et soutenue dans cette nouvelle aventure de recherche. Merci pour votre patience et votre gentillesse, merci d’avoir résisté à notre névrose obsessionnelle à Brest et sur les routes de France et de Navarre. Et encore merci de me faire l’honneur de présider ce jury. Soyez assuré de ma profonde considération et de mon amitié.
A Monsieur le Professeur Bernard Le Floc’h, merci de me faire l’honneur de faire partie de ce jury. Merci de nous avoir initiées à la recherche en médecine générale, de nous avoir fait découvrir les villes de Tours et Nice, d’avoir cru en nous. Soyez assuré de ma reconnaissance et de mon profond respect.
A Monsieur le Docteur Benoît Chiron, merci aussi de nous avoir initiées à la recherche en médecine générale. Merci de nous avoir accompagnées à Nice et fait partager ces bons moments. Merci d’avoir été mon tuteur tout au long de cet internat. Merci enfin de me faire l’honneur de faire partie de ce jury. Sois assuré de ma sincère reconnaissance et de mon profond respect.
A Madame le Docteur Delphine Le Goff, merci pour votre présence au sein de ce jury. Merci pour votre implication dans la formation des étudiants. Soyez assurée de ma grande considération.
A Madame Florence Gatineau, merci pour ce remarquable travail statistique accompli au pied levé. Merci pour les tous efforts que vous avez fournis pour nous, pour avoir répondu à nos innombrables questions et pour votre aide précieuse. Soyez assurée de ma profonde reconnaissance.
A Véro, la plus belle rencontre de mes études. Merci pour tous nos moments, les bons comme les moins bons, les fous rires, les larmes, la joie, le stress, le travail, les soirées, le binge drinking, nos appels interminables, ton soutien indéfectible, ta motivation communicative, ton énergie, tes précieux conseils et tout ce que nous partageons depuis ces années. Que tu sois ma co-thésarde n’était qu’une évidence, merci d’être toi.
A Alain, merci d’être à mes côtés, de m’apporter tant d’amour, de me soutenir dans tout ce que j’entreprends, de me faire progresser toujours un peu plus, de m’épauler dans les moments difficiles, d’illuminer ma vie de jour en jour. Avec tout mon amour.
11
A Aloïs, le deuxième homme de ma vie, ton arrivée a bouleversé ma vie et me donne envie de me surpasser. Merci pour l’infini bonheur que tu nous apportes.
A mes parents, merci d’avoir cru en moi et mes capacités, de m’avoir aidée à réaliser ce rêve, d’être toujours là pour moi en toutes circonstances.
A mon frère, ma sœur et Aude, merci pour votre soutien tout au long de ces études, pour m’avoir poussé à m’aérer l’esprit quand il le fallait et pour tout l’amour qui unit notre famille. A Mamie, merci pour nos innombrables cafés, nos longues discussions, ta présence et ton soutien. Avec mon profond amour.
A Papy et Grand-mère, je sais que vous n’êtes pas loin, avec mon profond amour.
A ma belle-famille, merci pour votre soutien, la confiance que vous me portez et tous les bons moments passés ensemble.
A mes oncles et tantes, mes cousins et mes cousines, vous tous qui formez ma grande famille, merci.
A mes amis, merci pour les joies partagées ensemble, les soirées, les séances de papotage, de shopping et les bons moments à venir. Merci à toi Laure, particulièrement, pour m’avoir aidée à améliorer mon anglais et me faire divaguer vers d’autres sphères.
Merci à vous Pauline et Aude, les BD, pour notre épopée à Nice, nos soirées mémorables et notre amitié. A nos futures retrouvailles réunionnaises.
Au Docteur Beyssey, merci Alain de m’avoir illustré ce qu’est l’humanité dans notre métier, merci pour tes encouragements et pour ton réconfort dans les moments de doute.
A mes maîtres de stage et collègues, merci de m’avoir transmis vos savoirs et fait partager votre expérience, merci de m’avoir donné une formation de qualité.
A Buffy, Docteur House, Grey’s Anatomy, Clark Kent, merci de m’avoir fait rêver ou souffler sans trop culpabiliser. Au handball, à Jean-Jacques Goldman et Patrick Bruel, au FCLP, parce qu’il n’y pas que la médecine dans la vie !
12
TABLE OF CONTENTS
INTRODUCTION
METHODS
1. Study design ... 18 2. Study population ... 19 3. Study conduct ... 19 4. Judgment criteria ... 22 5. Data cleaning ... 22 6. Statistical analysis ... 23a. Clustering and classification ... 23
b. Survival analysis and multivariate regression ... 24
7. Ethics ... 24
RESULTS
1. Study population ... 252. Status at eighteen months ... 25
3. Cleaning and recoding data ... 30
4. Clustering and classification : describing the study population ... 30
a. Cluster 1 ... 32
b. Cluster 2 ... 32
c. Cluster 3 ... 33
5. Survival analysis : investigate the decompensation risk factors ... 34
a. Univariate analysis : the Kaplan-Meier method ... 34
b. Multivariate analysis : Cox’s models ... 36
c. Checking of the final model ... 37
13
DISCUSSION
1. Main findings ... 38
2. Analysis of experienced difficulties ... 41
a. Small sample size ... 41
b. Pertinence of some questions ... 41
c. Subjectivity of the « Expertise of the GP » assessment ... 41
d. Choice of chronic conditions ... 42
e. Statistical analysis ... 42 3. Study limitations ... 42 a. Selection bias ... 42 b. Information bias ... 43 c. Confusion bias ... 44 4. Future prospects ... 44
CONCLUSION
BIBLIOGRAPHY
APPENDIX
14
RESUME
RECHERCHE DES FACTEURS DE RISQUE DE DECOMPENSATION PARMI LES THEMES DE LA DEFINITION DE LA MULTIMORBIDITE SELON EGPRN. ETUDE PILOTE DE COHORTE, A 18 MOIS DE SUIVI EN EHPAD.
Introduction :
Les pathologies chroniques sont en pleine expansion, notamment du fait du vieillissement de la population. Les recommandations de bonnes pratiques actuelles basées sur l’approche par maladie ne sont plus adaptées. La multimorbidité et ses conséquences négatives ont de lourdes répercussions, en particulier dans les Etablissements d’Hébergement des Personnes Agées Dépendantes (EHPAD). La prise en charge de la multimorbidité est devenue un challenge quotidien pour les médecins généralistes. L’objectif de cette étude était d’identifier des facteurs de risque de décompensation de la multimorbidité.
Méthode :
Une étude de cohorte prospective a été menée à l’EHPAD de Lanmeur de juillet 2014 à décembre 2015. Les patients correspondant à la définition de la multimorbidité de l’ European General Practitioners Research Network (EGPRN) ont été inclus. La décompensation était définie par le décès ou une hospitalisation durant au moins 7 jours consécutifs. Dix-huit mois après l’inclusion, les patients étaient répartis selon leur statut en deux groupes, “Décompensés” (“D”) ou “Rien à Signaler” (“RAS”). Une régression logistique suivant le modèle de Cox était réalisée pour identifier les facteurs de risque potentiels.
Résultats :
64 patients ont été inclus. Après dix-huit mois de suivi, 31 appartenaient au groupe “D” et 33 au groupe “RAS”. L’analyse multivariée selon un modèle de Cox faisait émerger deux variables statistiquement significatives : la douleur (Hazard Ratio (HR) = 2.18 ; 95% IC [1.07-4.44], p= 0.012) et la mauvaise hygiène de vie (pas d’alimentation saine, d’activité physique ni d’hygiène correcte) (HR= 2.53 ; 95% IC [1.23-5.19], p=0.033).
Conclusion :
La douleur et la mauvaise hygiène de vie semblent augmenter le risque de décès ou d’hospitalisation chez les personnes âgées multimorbides résidant en EHPAD. Des études plus puissantes menées à plus grande échelle sont nécessaires avec quelques ajustements méthodologiques pour confirmer ces résultats.
15
ABSTRACT
SEARCH FOR DECOMPENSATION RISK FACTORS WITHIN THE EGPRN MULTIMORBIDITY’S DEFINITION THEMES. COHORT PILOT STUDY, FOLLOW UP AT 18 MONTHS IN NURSING HOME.
Background :
Chronic diseases are widely expanding, notably because of ageing population. Actual practice guidelines basing on a disease approach are not suitable anymore. Multimorbidity and its outcomes heavily matter, especially in Nursing Homes (NH) residents. Management of multimorbidity has become a daily challenge for General Practitioners (GPs). This study’s objective was to highlight some risk factors of decompensation of multimorbidity.
Methods :
A prospective cohort study was carried out in Lanmeur’s NH from July 2014 to December 2015. Patients matching the European General Practitioners Research Network (EGPRN)’s definition of multimorbidity were included. Decompensation corresponded to death or a hospitalization lasting at least seven successive days. Eighteen months after inclusion, patients were classified in two groups, “Decompensation” (“D”) or “Nothing to Report” (“NTR”), depending on their status. A logistic regression following a Cox model was performed to identify potential risk factors.
Results :
64 patients were included. After eighteen months, 31 belonged to the group “D” and 33 to the group “NTR”. The multivariate analysis using a Cox’s model, brought out two variables statistically significant : pain (Hazard Ratio (HR) = 2.18; 95% CI [1.07-4.44], p-value= 0.012) and unhealthy lifestyle (no healthy diet, physical activity nor correct hygiene) (HR= 2.53 ; 95% CI [1.23-5.19], p=0.033).
Conclusion:
Pain and unhealthy way of life were suggested to increase the risk of death or hospitalization among the multimorbid elderly living in nursing homes. More powerful studies are needed to confirm these findings after some methodological adjustments.
16
INTRODUCTION
Diseases are called chronic when they are permanent, caused by irreversible pathological alteration or if they required rehabilitation or a long duration of care. Prevention and control of chronic diseases, sometimes also designed as Non Communicable Diseases (NCDs), have become a high priority for the World Health Organization (WHO) since 2000 (1).
Their management is an integral part of General Practice. Although clinical practice guidelines aimed to improve the quality of health care, numerous publications demonstrated that they weren’t appropriate for patients suffering for several chronic diseases (2–8). To deliver the best possible care, those patients need a person-focused approach rather than a disease-focused approach. This holistic perspective is one of the six fundamental competences of the European definition of the family medicine set by the World Organization of National Colleges, Academies and Academic Associations of General Practitioners/Family Physicians (WONCA) (9).
In this context, the concept of multimorbidity became more and more pertinent. It arose in Germany in 1976 (10) and was recognized on the international scale in 1990 (11). In 2008, the WHO defined multimorbidity as people suffering from two or more chronic conditions (12). But it lacked of precision according to the variable prevalence of multimorbidity found in several systematic reviews of studies on the subject (2,13,14). In 2012, the European General Practitioners Research Network (EGPRN) brought the following comprehensive definition of multimorbidity after a systematic review of literature:
« Multimorbidity is defined as any combination of chronic disease with at least one other disease (acute or chronic) or biopsychosocial factor (associated or not) or somatic risk factor. Any biopsychosocial factor, any risk factor, the social network, the burden of diseases, the health care consumption, and the patient's coping strategies may function as modifiers (of the
17
effects of multimorbidity). Multimorbidity may modify the health outcomes and lead to an increased disability or a decreased quality of life or frailty. » (15) The EGPRN aimed to help the European family doctors to finger on the multimorbid patients they take care of so they translated the definition into ten European languages then (16).
Multimorbidity heavily matters because it leads to reduced quality of life, higher mortality, increases disability and dependence, polypharmacy and high treatment burden. It increases significantly the healthcare cost by augmenting the use of health services, the emergency hospital admission rate and the postoperative complications rate (17–22). Management of multimorbidity appears thus as a crucial health challenge (2,6,23,24).
Better socio-sanitary conditions associated with medical and technologic advancements have conducted to a lifespan extension. Combined with the decline of the fecundity rate (25), population is ageing. On 1 January 2017, 66.991 million people lived in France. 19.2% of them were 65 years old or more. According to the projections, a person over four would be 65 or more in 2040 (26). The prevalence of multimorbidity increases considerably with age and most of people aged 65 or more are multimorbid (2,14,27,28). Hence, detect the key determinants of multimorbidity is necessary for the development of effective strategies for the early identification of patients at risk and for the prevention of future health condition.
From 2010 to 2014, several medical theses carried out by students in Brest aimed to highlight the factors of multimorbidity and then gather them in themes from the EGPRN’s definition (29– 36). 13 themes were identified. Basing on these qualitative works, a quantitative study was carried out to find out the risk factors of decompensation among the multimorbidity’s themes. Considering the important prevalence of multimorbidity in the aged patients, a cohort of persons living in nursing home (NH) seemed appropriate and was chosen for the study.
18
A pilot study was first performed in 2015 to check the feasibility of the cohort study in NH (37). The objective was also to highlight the significant predictors of decompensation on multimorbid patients.
This study focused on the same cohort after eighteen months of follow-up.
The research hypothesis supposed that most of institutionalized patients responded to the EGPRN’s definition of multimorbidity. And among the factors of multimorbidity brought out of the previous theses, some would be risk factors of decompensation. If those factors are known, they could be quickly recorded and properly managed to prevent decompensation (hospitalization or death).
The main objective of this study was to highlight the risk factors of decompensation within the multimorbid EGPRN’s definition themes. The second objective was to relate the difficulties faced during the study.
METHODS
1. Study design
A feasibility pilot study was led at the outset with the patients residing in Lanmeur’s nursing home. It was developed into a prospective study with a contemporary, fixed and specific cohort. The setting alpha level was of 5% and the beta level was of 20% using a non-symmetrical sample (75% - 25%). With the expected difference on the significant variables of 20% it required 127 subjects.
Recruitment lasted six months. 64 patients were enrolled on the 127 expected. Patients were monitored over time every three months.
19
2. Study population
It was the same population as in the feasibility pilot study. It comprised all the multimorbid patients (according to the EGPRN definition of the multimorbidity), residing in Lanmeur’s nursing home. Moreover, their GP had to work in the university primary care center of Lanmeur.
Patients could be included if they matched the criteria of the definition of multimorbidity according to the EGPRN definition: any combination of chronic disease with at least oneother disease (acute or chronic) or a bio psychosocial factor (associated or not) or a somatic risk factor. For the research team, bio psychological factors took into account psychological risk factors, psychosocial risk factors, lifestyle, demographics (age, gender), psychological distress, socio-demographic characteristics, aging, beliefs and expectations of patients, physiology, pathophysiology (15).
Patients not meeting the criteria of the definition of multimorbidity, patients who should not be followed up over time during the study, patients for whom prognosis vital was committed or life expectancy was estimated less than three months and patients undergoing legal protection were excluded.
3. Study conduct
The team contacted the GPs practicing in the university center of Lanmeur to participate in the study by email. If they agreed they became investigators.
Inclusion criteria were checked by the team to select patients. Then, they had a conversation with each patient about the study.
Potential risk factors of decompensation were gathered by filling a questionnaire. This one was pre-filled by the team after accessing to the medical record and then was completed by the GPs. Data were anonymous: a number was given to each patient corresponding to the inclusion order in the cohort. The patient’s status was examined every three months and they were categorized in the group “decompensation” (“D”) or “nothing to report” (“NTR”). Death or a hospitalization seven successive days or more defined a decompensation.
Then, the team analysed the patients’ characteristics from multimorbidity themes and sub-themes and compared the two groups in order to identify some risk factors of decompensation.
20 Table 1 : Themes and subthemes of the multimorbidity
THEMES SUBTHEMES
Chronic disease
Chronic condition Chronic diseases
Complexity characteristics of chronic disease Psychosomatic disease
Acute disease
Acute condition Acute disease
Complexity characteristics of acute disease Reaction to severe stress and acute disorders
Biopsychosocial factors and somatic risk factors
Demographic risk factor Lifestyle
Patients beliefs/expectations Physiopathology
Psychological risk factors Psychosocial risk factors
Sociodemographic characteristics Somatic risk factors
Coping Patient’s coping strategies
Burden of diseases
Disease morbidity Disease complication
Health care consumption
Use of carers
Disease management Health system Health care policy Health care
Health care services Malpractice
Assessment Medical history
21 Medical procedure Pain Polypharmacy Prevention Symptoms/signs/complaints Treatment or medication Cost of care Disability Handicap Functional impairments Quality of life Health status Impairment Morbidity implication Quality of life Frailty Frailty Social network
Dependence on social network Family’s coping strategies Social isolation
Social network
Support from social network
Health outcomes
Outcomes
Medical research epidemiology Mortality
Core competencies of FP
Holistic approach
Practical experience of general practitioners with patients
General practitioner, as a lonely expert of multimorbidity
Expertise of the general practitioner "Gut feeling"/Intuition
22
Person-centred care Primary care management Specific problem solving skills Relationship between FP and patient
Communication challenge FP’s and patient’s experience
A questionnaire and a guide for its filling (Appendix 1) were written to collect these variables basing on the axial and thematic coding used to develop the definition of multimorbidity (31). The qualitative notions extracted from the multimorbidity themes and sub-themes were turned into quantitative factors to help the data collection after the fulfilment of the questionnaire and to limit confusion.
The variables « cardiovascular risk factor », « fall risk factor », « assessment of hygiene », « assessment of feeding » and « assessment of physical activity » extracted from the coding book were used to assess the concept of somatic risk factor. The fall risk was calculated using the CETAF score (19).
The variables « chronic condition, cost of care, disability, quality of life, health outcome, frailty, physiology, disease and assessment, demography and aging » were redundant or impossible to evaluate. So they were crushed.
This questionnaire was validated by peer group.
4. Judgment criteria
The primary endpoint was decompensation during the eighteen-months follow up. The definition of decompensation was established in peer group including doctors, residents and researchers in primary care on multimorbidity. It was death or a hospitalization lasting at least seven successive days.
The secondary criterion was the difficulties experienced during the study process.
5. Data cleaning
Data were saved using Microsoft Excel. Two distinct groups were identified: one group “Decompensation” (“D”) and a second group “Nothing To Report” (“NTR”). The team
23
preferred those denominations to “frail” and “not frail” because of the risk of confusion with the concept “frailty”. Indeed, the definition of “frailty” wasn’t approved unanimously between the Fried’s physical approach and the Rockwood’s frailty concept.
A data cleaning was operated before statistical analysis to homogenize data. A “dictionary” (Appendix 2) gathering all the modifications and the meaning of the abbreviations was established. Some diseases were assembled into one entity such as osteoarticular diseases. Some were effaced and some others such as transient ischemic attack or osteopenia were reconsidered as a risk factor and not a disease.
6. Statistical analysis
a. Clustering and classification
Firstly, some significance tests variables were performed to compare the “D” and “NTR” groups. For qualitative variables, a Fischer’s exact test or a Chi 2 test, depending on the number of patients concerned, was fulfilled with an alpha level at 5% and a beta level at 20%. For quantitative variables, a Student test or a Wilcoxon/Man Whitney test was achieved with the same risk levels to compare means or medians between the two groups.
Secondly, a clustering was performed to describe the multimorbid population: patients sharing common characteristics were gathered in homogenous groups without taking into account their status at eighteen months. The first stage of the clustering consisted in a dissimilarity measure with Euclidian distance calculation and a hierarchical clustering using the Ward method. The result appeared as a cluster dendrogram (i.e a classification tree to observe the hierarchy of groups).
Then, a Multiple Correspondence Analysis (MCA) was used to select among all the variables, the significant variables to describe each group (active variables) by transforming categorical variables into a set of few continuous variables. It removed the non-discriminating ones and the one related to the quality of care for the multimorbidity and the GPs’ self-evaluation. Illustrative variables assisted in the interpretation of active variables after their projection onto the dimensions. It allowed to assess the differences and the resemblances between the individuals, to group the variables, and assess the differences and the resemblances between modalities. At the end, some profiles emerged.
24
Finally, clusters were obtained thanks to the Hierarchical Clustering on Principal Components (HCPC) approach and could be projected onto a MCA factor map.
b. Survival analysis and multivariate regression
For the survival analysis, time must be considered because the follow up was not the same for all patients as they did not decompensate at the same moment. A logistic regression following the Cox’s model was the most suitable for this analysis. It assessed the supplementary risk bring by the exposition to a risk factor while considering the probability of occurrence of decompensation at all times of the follow up.
The Kaplan-Meir method, a non-parametric estimation assessing the survival function from the data, gave the survival curves of the “D” and “NTR” groups.
To find out if the two groups were significantly different, a univariate analysis consisting in a log-rank test with a p-value level of 0,05 was performed.
Then, a semi parametric assessment using the Cox’s method gave unrefined Hazard Ratios (HR) and their 95% confidence intervals (CI) (univariate analysis). They corresponded to the association between a variable and the decompensation risk factor, taking account of the time. And after, a second Cox model was applied to obtain the adjusted HR (multivariate analysis) and their 95% CI. The adjusted HR corresponded to the association between a variable and the decompensation risk factor after adjusting some others variables (age, sex…). The interest was to avoid confusion factors.
At the end, a check of the final model was carried out thanks to a Chi 2 test to control the hypothesis of proportional hazards set by the Cox’s model.
7. Ethics
The study was approved by Ethics Committee of the “Université de Bretagne Occidentale” Faculty of Medicine.
25
RESULTS
1. Study population
The first inclusion period took place from July to December 2014. 64 patients were enrolled on the 127 expected. None of the patients were lost to follow-up so the status at eighteen months could be collected for every patient.
A second inclusion period happened from July to December 2015. It enrolled 54 other patients. The cohort counted 118 persons. The follow-up of these new patients was too short to include them in any statistical analysis. That’s why another thesis will study the data after eighteen months of follow-up for the 118 patients.
2. Status at eighteen months
Eighteen months after inclusion, 31 patients belonged to the group « D » and 33 to the group « NTR ». In the group « D », 13 were hospitalized seven days or more and 18 were dead. Characteristics of the two groups are exposed on the table 2.
Table 2 : Characteristics of the study population
Study Population N=64 (100%) Decompensation (D) N= 31 (48.43%) Nothing to Report (NTR) N= 33 (51.56%) P value
Qualitative variables N % N % N % Chi2/Fisher
Men 24 37.50% 11 35.48% 13 39.49% 0.949
Women 40 62.50% 20 64.52% 20 60.61% 0.949
Somatic risk factors and disease
Ostearticular disease 42 65.63% 21 67.74% 21 63.64% 0.934
Hypertension 47 73.44% 24 77.42% 23 69.70% 0.677
Hypercholesterolemia 10 15.63% 3 9.68% 7 21.21% 0.355
26 Study Population N=64 (100%) Decompensation (D) N= 31 (48.43%) Nothing to Report (NTR) N= 33 (51.56%) P value
Qualitative variables N % N % N % Chi2/Fisher
Complexity of chronic disease 42 65.63% 22 70.97% 20 60.61% 0.543 Complication of chronic disease 28 43.75% 16 51.61% 12 36.36% 0.329 Complication of acute disease 24 37.50% 14 45.16% 10 30.30% 0.333
Reaction to severe stress
37 57.81% 19 61.29% 18 54.55% 0.770 Psychosomatic disease 18 28.13% 10 32.26% 8 24.24% 0.664 Cardiovascular family history 0 0 0 NI Overweight 24 37.50% 13 41.94% 11 33.33% 0.651 Immunosuppression 12 18.75% 5 16.13% 7 21.21% 0.841 Postural instability 47 73.44% 21 64.74% 26 78.79% 0.474 Number of falls in the past year 0 38 59.38% 20 64.52% 18 54.55% 0.855 1 7 10.94% 3 9.68% 4 12.12% 2 11 17.19% 5 16.13% 6 18.18% 3 or more 8 12.50% 3 9.68% 5 15.15% CETAF Score Great risk 19 29.69% 7 22.58% 12 36.36% 0.482 Medium risk 26 40.63% 14 45.16% 12 36.36% Low risk 19 29.69% 10 32.26% 9 27.27%
Psychological risk factor
Risk behavior 3 4.7% 2 6.45% 1 3.03% 0.607
Suicide risk 0 0 0 NI
Addiction 8 12.5% 5 16.13% 3 9.09% 0.636
No psychological risk factor 54 84.38% 25 80.65% 29 87.88% 0.651
Psychosocial risk factor
Unemployment 0 0 0 NI
27
Stress at work 0 0 0 NI
Family problems 6 9.38% 2 4.65% 4 12.12% 0.727
Financial and social
insecurity 11 17.19% 4 12.90% 7 21.21% 0.583
Death of one or more
relatives 44 68.75%) 21 67.74% 23 69.70% 1 Divorce 1 1.6% 1 3.23% 0 0.484 Study Population N=64 (100%) Decompensation (D) N= 31 (48.43%) Nothing to Report (NTR) N= 33 (51.56%) P value
Qualitative variables N % N % N % Chi2/Fisher
Lifestyle
Good hygiene 24 37.5% 8 25.81% 16 48.48% 0.106
Physical activity 4 6.25% 0 4 12.12% 0.114
Healthy diet 32 50% 13 41.94% 19 57.58% 0.317
No positive answer 27 42.19% 17 54.84% 10 30.30% 0.083
Socio professional category
(SPC) SPC Farmer 13 20.3% 6 19.35% 7 21.21% 0.050 Artisan 8 12.5% 0 8 24.24% Executive 4 6.3% 2 6.45% 2 6.06% Intermediate profession 4 6.3% 2 6.45% 2 6.06% Employee 6 9.4% 3 9.68% 3 9.09% Worker 17 26.6% 9 29.03% 8 24.24% Unemployed 12 18.8% 9 29.03% 3 9.09% Family situation In a relationship 12 18.75% 4 12.90% 8 24.24% 0.400 Single or widowed 52 81.25% 27 87.10% 25 75.76% 0.400 Having children 49 76.56% 25 80.65% 24 72.73% 0.651 Entourage characteristics Existing entourage 63 98.44% 30 94.77% 33 100% 0.484 Supporting entourage 52 81.25% 27 87.10% 25 75.76% 0.400 Dependency of entourage 53 82.81% 27 87.10% 26 78.79% 0.583 Entourage's coping 23 35.94% 11 35.48% 12 36.36% 1
28 Coping strategies 28 43.75% 15 48.39% 13 39.39% 0.636 Health care Pharmacological treatment 64 100% 31 100% 33 100% NI Treatment at risk 26 40.63% 13 41.94% 13 39.39% 1
Daily use of psychotropics
60 93.75% 28 90.32% 32 96.97% 0.347 Coordination procedures 40 62.50% 19 61.29% 21 63.64% 1 Study Population N=64 (100%) Decompensation (D) N= 31 (48.43%) Nothing to Report (NTR) N= 33 (51.56%) P value
Qualitative variables N % N % N % Chi2/Fisher
Good communication
between other carers 56 87.50% 26 83.87% 30 90.91% 0.636
Negligence of the patient 7 10.94% 5 16.13% 2 60.06% 0.374
Patient victim of iatrogeny
18 28.13% 5 16.13% 13 39.39% 0.073
Material for patient at home 64 100% 31 100% 33 100% NI
Human help at home 64 100% 31 100% 33 100% NI
Lack of time and
remuneration 18 28.13% 8 25.81% 10 30.30% 0.903
Heavy and complex medical
history 46 71.88% 20 64.52% 26 78.79% 0.322 Recommended vaccination 63 98.44% 30 96.77% 33 100% 0.484 Proposal of screening 12 18.75% 6 19.35% 6 18.18% 1 Acceptation of screening 12 18.75% 7 22.58% 5 15.15% 0.660 Proposal of therapeutic education 3 4.69% 1 3.23% 2 6.06% 1 Painful patient 19 29.69% 13 41.90% 6 18.18% 0.071
Residing in nursing home 64 100% 31 100% 33 100% NI
29 Knowledge about the Health
System 47 73.44% 23 74.19% 24 72.73% 1
Habits of complexity
problems 59 92.19% 27 87.10% 32 96.97% 0.190
Overview of disease 61 95.31% 28 90.32% 33 100% 0.108
Person-centred care 60 93.75% 28 903.2% 32 96.97% 0.347
Long time relationship 60 93.75% 28 903.2% 32 96.97% 0.347
Intuition 35 54.69% 17 54.84% 18 54.55% 1 Quality communication 58 90.63% 28 90.32% 30 90.91% 1 Multimorbidity influence on quality of care 49 76.56% 25 80.65% 24 72.73% 0.651 Study Population N=64 (100%) Decompensation (D) N= 31 (48.43%) Nothing to Report (NTR) N= 33 (51.56%) P value
Quantitative variables Median (Q1-Q3)
/Sd Median (Q1-Q3) /Sd Median (Q1-Q3) /Sd Wilcoxon/ Student Age 87 (3-7) 90 (3-6) 87 (3-7) 0.166
Total number of disease 7.6 3 7.6 2 7.6 2 0.927
Number of chronic diseases 7.39 2.59 7.33 2.30 7.26 2 0.814
Number of acute diseases 0 (0-1) 0 (0-1) 0 0 0.485
Number of treatment 9 (7-12 10 (8-13 9 (7-12) 0.655
Number of FP's consultation
per year 17.5 (12-20) 19 (12-28) 15 (12-20) 0.242
Number of specialist's
consultation per year 1 (0-2) 1 (0-2) 1 (0-2) 0.855
Number of biology per year 3 (1-6) 3 (2-7) 3 (1-5) 0.473
Number of medical imaging
per year 0 (0-1) 0 (0-2) 0 (0-1) 0.748
CETAF score 4.5 (3-7) 4 (3-6) 5 (3-7) 0.424
30
The analysis did not bring out any statistically significant variable, qualitative nor quantitative, i.e with a p-value < 0.05.
3. Cleaning and recoding data
The results of the recoding work were reported in the dictionary. (Appendix 2) The answer for several variables was the same for the 64 patients. So they were not discriminant and had been erased. It concerned: the presence of pharmacological treatment (yes), material available to the patient (yes), human aid available to the patient (yes), life in institution (yes), unemployment (no), suicide risk (not), stress at work (no), family history of cardiovascular diseases (no). The useless variables were eliminated, namely patient identification number and date of inclusion.
Date of birth was transformed into age.
The goal was to compare the groups according to their characteristics. That’s why the variables relating to the quality of care of the multimorbidity and the general practitioner’s self-evaluation (intuition, good communication with others carers, coordination procedures etc) were also removed from the analysis (questions 26, 29, 30, 34, 45 to 52).
4. Clustering and classification : describing the study population
The multidimensional analysis started with an ascendant hierarchical classification. Every patient was initially taken individually. Some criterions were selected to group the patients. Then, patients who were the closest according to the Euclidian distances where gathered. The process continued iteratively and on every step, individuals then groups were fused until obtained hierarchy. The hierarchy was represented on a cluster dendrogram. (Figure 1)31 Figure 1 : cluster dendrogram
A MCA was then performed to point out the discriminant variables, in general and specifically in the different groups of patients.
Finally, the HCPC was carried out from the previous results and gave the clustering of the populations. To constitute the clusters, a 20% departure from the cohort population was fixed. Three clusters appeared. They featured on the figure 2.
32
a. Cluster 1
Most of people belonging to the cluster 1 had a healthy diet and no psychological risk factor (addiction, risk behaviour or suicide risk) (96.67%). They had a good hygiene and their conditions, acute as well as chronic, were not complicated. They suffered rather from hypercholesterolemia.
They took less medication than the cohort study (8.90 vs 9.97).
b. Cluster 2
The patients composing the cluster 2 were women (86.96%), whose hygiene was not correct and they had children (91.3%). None of them had a healthy diet. They were not immunosuppressed. They didn’t present psychological risk factor or addictions.
% in the cluster % in the cohort
% in the cluster relative to % in the cohort p Cluster 1 q13_alimsaine=q13_alimsaine_Yes 96,67 50,00 90,63 0,000 q13_aucun=q13_aucun_No 100,00 57,81 81,08 0,000 q13_hygieneOK=q13_hygieneOK_Yes 70,00 37,50 87,50 0,000 q11_FR_psy_aucun=q11_FR_psy_aucun_Yes 96,67 84,38 53,70 0,012 q1_hypercholest=q1_hypercholest_Yes 26,67 15,63 80,00 0,028 q7_complicationPA=q7_complicationPA_No 76,67 62,50 57,50 0,032 q19_complications=q19_complications_No 70,00 56,25 58,33 0,042 q11_FR_psy_addictions=q11_FR_psy_addictions_No 96,67 87,50 51,79 0,045 q11_FR_psy_addictions=q11_FR_psy_addictions_Yes 3,33 12,50 12,50 0,045 q19_complications=q19_complications_Yes 30,00 43,75 32,14 0,042 q7_complicationPA=q7_complicationPA_Yes 23,33 37,50 29,17 0,032 q1_hypercholest=q1_hypercholest_No 73,33 84,38 40,74 0,028 q11_FR_psy_aucun=q11_FR_psy_aucun_No 3,33 15,63 10,00 0,012 q13_hygieneOK=q13_hygieneOK_No 30,00 62,50 22,50 0,000 q13_aucun=q13_aucun_Yes - 42,19 - 0,000 q13_alimsaine=q13_alimsaine_No 3,33 50,00 3,13 0,000 Mean in the cluster Mean in the cohort Standard deviation in the cluster Standard deviation in the cohort p Cluster 1 q43_Ntraitements 8,90 9,97 3,32 3,89 0,039
33
They took more medication and underwent less biology exams per year than the population study.
c. Cluster 3
The cluster 3 is defined only by qualitative variables. It was characterized by a majority of men (81.82%) and workers (54.55%). None of them had a correct hygiene. They were under risk treatment and had psychological risk factors (addictions and risk behaviours). They did not suffer from osteo-articular diseases, postural instability and were immune-supressed.
% in the cluster % in the cohort % in the cluster relative to % in the cohort p Cluster 2 q13_alimsaine=q13_alimsaine_No 100,00 50,00 71,88 0,000 q13_aucun=q13_aucun_Yes 86,96 42,19 74,07 0,000 q14_sex_H=Women 86,96 62,50 50,00 0,002 q13_hygieneOK=q13_hygieneOK_No 86,96 62,50 50,00 0,002 q11_FR_psy_aucun=q11_FR_psy_aucun_Yes 100,00 84,38 42,59 0,007 q11_FR_psy_addictions=q11_FR_psy_addictions_No 100,00 87,50 41,07 0,022 q8_FR_immunodep=q8_FR_immunodep_No 95,65 81,25 42,31 0,027 q17_enfant=q17_enfant_Yes 91,30 76,56 42,86 0,039 q17_enfant=q17_enfant_No 8,70 23,44 13,33 0,039 q8_FR_immunodep=q8_FR_immunodep_Yes 4,35 18,75 8,33 0,027 q11_FR_psy_addictions=q11_FR_psy_addictions_Yes - 12,50 - 0,022 CSP=CSP6-Ouvriers 8,70 26,56 11,76 0,015 q11_FR_psy_aucun=q11_FR_psy_aucun_No - 15,63 - 0,007 q14_sex_H=Men 13,04 37,50 12,50 0,002 q13_hygieneOK=q13_hygieneOK_Yes 13,04 37,50 12,50 0,002 q13_aucun=q13_aucun_No 13,04 57,81 8,11 0,000 q13_alimsaine=q13_alimsaine_Yes - 50,00 - 0,000 Mean in the cluster Mean in the cohort Standard deviation in the cluster Standard deviation in the cohort p Cluster 2 q43_Ntraitements 11,52 9,97 4,33 3,89 0,017 q27_Nbiologie 2,96 4,70 2,88 5,27 0,047
34
5. Survival analysis : investigate the decompensation risk factors
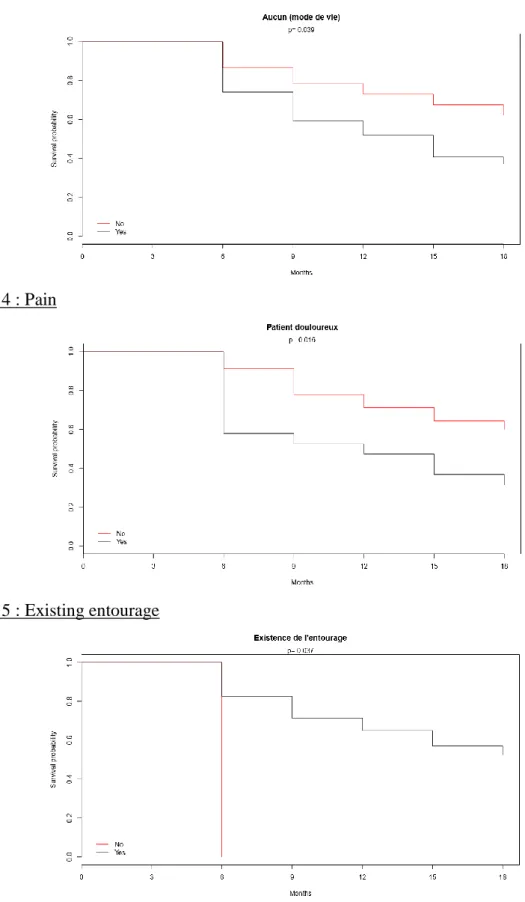
a. Univariate analysis : the Kaplan-Meier method
Several variables came out with a significative p-value < 0.05 after the comparison between the groups “D” and “NTR” using the Kaplan-Meier method. It was unhealthy way of life (corresponding to the patients that didn’t have a healthy diet nor physical activity nor a correct hygiene), pain, existing entourage and absence of entourage. Curves are shown on the figures 3, 4, 5 and 6. % in the cluster % in the cohort % in the cluster relative to % in the cohort p Cluster 3 q11_FR_psy_aucun=q11_FR_psy_aucun_No 81,82 15,63 90,00 0,000 q11_FR_psy_addictions=q11_FR_psy_addictions_Yes 63,64 12,50 87,50 0,000 q14_sex_H=Men 81,82 37,50 37,50 0,002 q13_hygieneOK=q13_hygieneOK_No 100,00 62,50 27,50 0,003 q8_FR_immunodep=q8_FR_immunodep_Yes 54,55 18,75 50,00 0,004 q11_FR_psy_conduiteRisQ=q11_FR_psy_conduiteRisQ_Yes 27,27 4,69 100,00 0,004 q24_trait_risQ=q24_trait_risQ_Yes 72,73 40,63 30,77 0,024 CSP=CSP6-Ouvriers 54,55 26,56 35,29 0,036 q9_insta_posturale=q9_insta_posturale_No 54,55 26,56 35,29 0,036 q1_patho_osteo=q1_patho_osteo_No 63,64 34,38 31,82 0,037 q1_patho_osteo=q1_patho_osteo_Yes 36,36 65,63 9,52 0,037 q9_insta_posturale=q9_insta_posturale_Yes 45,45 73,44 10,64 0,036 q24_trait_risQ=q24_trait_risQ_No 27,27 59,38 7,89 0,024 score_CETAF_3cl=Risque élevé - 29,69 - 0,014 q11_FR_psy_conduiteRisQ=q11_FR_psy_conduiteRisQ_No 72,73 95,31 13,11 0,004 q8_FR_immunodep=q8_FR_immunodep_No 45,45 81,25 9,62 0,004 q13_hygieneOK=q13_hygieneOK_Yes - 37,50 - 0,003 q14_sex_H=Women 18,18 62,50 5,00 0,002 q11_FR_psy_addictions=q11_FR_psy_addictions_No 36,36 87,50 7,14 0,000 q11_FR_psy_aucun=q11_FR_psy_aucun_Yes 18,18 84,38 3,70 0,000
35 Figure 3 : Unhealthy way of life
Figure 4 : Pain
36 Figure 6 : Absence of entourage
Several variables came out of the log-rank test:
- Unhealthy way of life (corresponding to the patients that didn’t have a healthy diet nor physical activity nor a correct hygiene) : p= 0.042, 95%CI [1.03-4.24]
- Pain : p= 0.015, 95%CI [1.18-4.96]
- Existing entourage : p= 0028, 95%CI [0.01-0.77] - Absence of entourage : p= 0.028, 95%CI [1.29-80.63]
b. Multivariate analysis : Cox’s models
The Cox’s model was applied to take the follow-up duration into account. The univariate analysis resulted in the unrefined Hazard Ratio (HR), which corresponded to the association between a variable and the risk of decompensation. The HR and their confidence interval figured on the table 3.
Table 3 : Unrefined Hazard Ratio
It showed that painful patients as well as patients having an unhealthy way of life had a higher risk of decompensation. The absence of entourage seemed also to increase the risk of
Variable HR IC95% p
Unhealthy lifestyle 2,09 [ 1,03 ; 4,24 ] 0,042
Pain 2,42 [ 1,18 ; 4,96 ] 0,015
Existing entourage 0,10 [ 0,01 ; 0,77 ] 0,028 Absence of entourage 10,20 [ 1,29 ; 80,63 ] 0,028
37
decompensation. On the contrary, existing entourage emerged as a protective factor of decompensation.
The Cox’s model was applied a second time in a multivariate analysis to obtain the adjusted Hazard Ratio. First, the significant and pertinent variables that could be incorporated in the model had to be selected. They are chosen thanks to an expert consensus among the variables obtained from the univariate analysis.
The adjusted HR were issued from this final model. They are presented on the table 4.
Table 4 : Adjusted Hazard Ratio
Two variables appeared significant, i.e with a p-value less than 0.05 and a confidence interval not containing 1. According to this final model, a unhealthy way of life (no healthy diet, physical activity nor correct hygiene) was a risk factor of decompensation (HR= 2.53 ; 95%CI [1.23-5.19]) as well as pain (HR=2.18 ; 95%CI [1.07-4.44]).
c. Checking of the final model
A Chi 2 test assessed the validity of the final model, testing the hypothesis of proportional hazards of the Cox’s model. The p-value is 0.401 so the decompensation risk stayed proportional over time among painful patients and patients having an unhealthy way of life. In conclusion, the model was valid.
6. Experienced difficulties
The principal difficulty was the recruitment of only 64 patients on the 127 expected. It resulted in a lack of power of the study.
The questionnaire to complete comprised 52 questions so its filling was time-consuming. Because it was the same than used in the primary care studies, some questions were not suitable for the nursing home population.
Certain formulation of questions seemed not precise enough so answering was more complicated.
HR IC95% p
Unhealthy lifestyle Yes vs No 2,18 [ 1,07 ; 4,44 ] 0,033
38
Moreover, some questions led to subjective answers. Hence their analyse and interpretation could not be performed.
Classification of several diseases as acute or chronic diseases or risk factors was difficult. The number of variables increased owing to the repetition of some variables. The statistical analysis was thus complicated and required a selection of variables.
DISCUSSION
1. Main findings
Pain appeared as a risk factor of decompensation for the nursing home residents. The risk of death or hospitalization was 2.53 higher in painful patients.
Pain is known to be a frequent problem, concerning from 27 % to 83% nursing homes residents according to Fox and al. (38) Despite it is underestimated and undertreated (39–44): 40 % of the painful residents are not given any pain killer, especially those with a low cognitive status. Persistent pain has yet numerous negative consequences : decreased quality of life, worsened mood and depression (42,45–47), increased dependency in activities of daily living (48), impaired social activities, impaired posture and mobility, impaired appetite, cognitive deterioration and behavioural symptoms, sleep troubles and anxiety (42,44,46,49,50).
Several elements may highlight the inadequate management of pain in NH : first, pain is sometimes considered as a part of the ageing process by both patients and carers (44,51–53). Older people can also hide they feel painful because they worry about being a burden (52), because they feel not being taken seriously (54) or because they are afraid of medication (55). Pain evaluation scales are multiple and self-reporting is often considered as a « gold-standard » assessment even though it is not always reliable, particularly when cognitive troubles exist (40,56,57). Among them, Numeric Rating Scales (NRS), Visual Analogue Scales (VAS), Verbal Rating Scales (VRS) and Facial Pain Scales (FPS) should be cited. Hetero-evaluation scales, such as DOLOPLUS-2, Pain Assessment IN Advanced Dementia Scale (PAINAD), Pain Assessment Checklist for Seniors with Limited Ability to Communicate (PACSLAC), Echelle Comportementale pour Personnes Agées (ECPA), are used for people suffering from severe cognitive impairments or unable to communicate. Although no pain scale is validated
39
with the elderly (58), the HAS (Haute Autorité de Santé) recommends using DOLOPLUS-2 and ECPA (59).
In this study, only 29.7 % of patients were painful. Reporting pain was achieved by GPs, whose evaluation was based on their patient’s knowledge and the medical record data (pain assessment and/or treatment and/or the nurses’ annotations). However Sengstaken and al demonstrated that GPs failed frequently to detect pain in nursing home users (in 34 % of the patients of the study) (43). Other studies put forward that nurses could misestimate the intensity of pain (60,61). The association of these elements with the caregivers’ misconceptions about analgesics (62–64) contributes to the under-treated pain (44).
Using a combined strategy consisting in direct questioning and evaluation scales (auto and/or hetero-evaluation) could have been more appropriate to confirm the prevalence of pain in the cohort.
Improving the management of pain is a challenge for caregivers, especially for multimorbid old people. Some researches suggest that chronic pain increases mortality, particularly from cardio-vascular diseases and cancer (65–67). However, further studies are needed to precise the relation between pain and the risk of decompensation among multimorbid patients.
A second risk factor of decompensation arose from the study: adverse lifestyle factors, i.e not having a healthy diet, physical activity or good hygiene. The risk was 2.18 times higher. Having a healthy lifestyle is recognized as a preventive factor of developing various chronic diseases in older adults. (68,69)
Promotion of physical activity and healthy diet appears in the priority interventions proposed by The Lancet NCD Action Group and the NCD Alliance to curb the increasing burden of Non Communicable diseases (NCDs) (70). French health authorities have adopted a similar approach during the updating of the French National Nutrition and Health Program (PNNS), by revising guideline daily amounts and establishing recommendations to increase physical activity and reduce sedentary lifestyle (71,72).
The relation existing between multimorbidity and lifestyle has already been highlighted in other studies (73,74). Multimorbidity is contrarily associated with the physical activity level according to Loprinzi and al. (75) and Autenrieth and al (76). Booth and al. affirm that lack of exercise is a predominant cause of most chronic conditions and explain through which
40
physiopathological mechanisms (77). Sedentary behaviours even increase the risk of death in general population (78–80) as well as in the elderly (81). In the same way, unhealthy food habits have an important impact on health. In 2000 in the USA, sedentarity and low-quality diet were responsible for 365.000 deaths (79). According to Lock and al. up to 2.635 million deaths per year worldwide would result from an insufficient consumption of fruits and vegetables ! (82) These numbers point out the urgent need to change lifestyle habits. Policies promoting the Mediterranean diet ; a regimen giving priority to fish, mono-unsaturated fats from olive oil, fruits, vegetables, whole grains, legumes/nuts, and moderate alcohol consumption, should be privileged. Indeed, Mediterranean diet reduces mortality (83,84) and the risk of developing numerous diseases, often reported as multimorbidity patterns (2,85–88), such as cardiovascular and metabolic diseases, cancer, rheumatoid pathologies (84).
About personal hygiene, there is no specific study focusing on the relation between it and multimorbidity or mortality. Through the increasing risk of contracting infection, it can be hypothesized that incorrect personal hygiene might negatively influence multimorbidity. In the study, only half of residents were supposed to have a healthy diet. Interview of patients, variations of their weight and personal opinion may have influenced GPs’ answers. It is difficult to assess if this result meshes with literature due to the lack of consensual definition of malnutrition and the obtained wide range of its prevalence in nursing home (from 1.5% to 66.5%) (89). Several leads to optimize nutritional care of NH’s patients exist (90): an exhaustive physical evaluation, regular monitoring of weight and meal intake, improvement of meal environment, evaluation of the feeding dependency and adaptation of the available staff needed to assist residents with meals. A document providing technical and practical advice to improve dietary intake for older people living in long-term care has been produced by the French Department of Health (91) and insists on the requirement to get patients involved in meal times.
93% of patients from the cohort did not practice physical activity. Increasing age is associated with decreasing physical activity (69) while potential benefits in functional abilities (92–94) and various diseases are extensive (95). The American College of Sports Medicine and the American Heart Association have recommended in 2007 to develop a individualized activity plan for each old person suffering from chronic conditions (69). Interventions on physical activity showed their positive effects in nursing home (96) and are worthy of being developed in the Lanmeur’s one.
41
Preserving and/or enhancing elderly’s diet and physical activity can significantly ameliorate health status and quality of life and delay death or hospitalization.
2. Analysis of experienced difficulties
a. Small sample size
Only 64 patients on the 127 expected were enrolled in the cohort. Length of the questionnaire may hindered GPs motivation, because its filling was time-consuming whereas their workload is already heavy. Time constraints, the additional administrative task brought by research projects, concern about medical data utilization and lack of recognition are reported by several authors as GPs’reluctances to get involved in primary health care research (97–99). However, Supper and al pointed out that 30% of 85 family physicians wished take part in a research project (100). Motivation is higher when GPs judge the research topic relevant for daily practice and when they can ameliorate quality of their care from it (98,99).
Visiting GPs in person and proposing financial incentives could have improved GPs participation as suggested by some authors (99,101–103). To overcome forgetfulness of some investigators, reminders were sent.
The second period of inclusion enrolled 54 other patients, what resulted in a global cohort of 118 patients. A further thesis will analyze all the patients at eighteen months.
b. Pertinence of some questions
Since the questionnaire was also used for another study concerning a outpatient cohort some propositions were not suitable for nursing home residents. It was those about unemployment, stress at work (question 12), material available to the patient (question 32), human aid available (question 33) and life in institution (question 41).
c. Subjectivity of the « Expertise of the GP » assessment
The initial EGPRN’s definition of multimorbidity (15) was detailed in eleven themes and subthemes thanks to several qualitative works. Submission of the definition to GPs coming from different European countries added two supplementary themes (104): the use of Wonca’s core competencies of general practice, also said GP’s expertise, and the dynamics of the doctor– patient relationship. The eight last questions of the questionnaire explored these themes. Though GPs’ self-criticism is not evident to respond them and answers can only be subjective.
42
They resulted in qualitative data which were hardly to convert in quantitative data for the statistical analysis. Besides, GPs had only two possible choices of response available, « Yes » or « No ». Thus, data which would have been extracted may be limited. For further studies, proposing semi-quantitative answers such as « yes completely, yes overall, yes a little, not at all » and ask indirect questions appears a suitable alternative.
d. Choice of chronic conditions
No classified list of diseases like ICD 10 (International Classification of Diseases, Tenth version) or ICPC2 (International Classification of Primary Care, Second Edition), was used by GPs to list patients’diseases. There is no consensus in the literature about the number and the type of diseases to retain to define multimorbidity. The systematic review of literature performed by Violan and al in 2014 (2) found out that selected studies comprised from 2 to 335 conditions in their multimorbidity’s definition. Heterogenous measurement methods of the prevalence of multimorbidity explained thus the wide range of estimations. And it supported the EGPRN’s process to develop a comprehensive definition of multimorbidity (15).
In the study, the team considered all the diseases reported by GPs. A correction was applied for redundant and wrong-classified ones. Their number rather than their type was used in the analysis.
e. Statistical analysis
The high number of variables complexified the statistical analysis. Because of the small number of patients, the used statistical tests reached their limits. For example, a Yates’s correction needed to be applied to the Chi 2 test for the comparison of the characteristics of the « D » and « NTR » groups when the number of patients was between 2.5 and 5.
For the clustering, the 20% difference threshold was empirically fixed to define the clusters which have to be studied. In fact, a difference of 20% corresponds to the limit from which GPs estimates that a difference matters in daily practice.