is an open access repository that collects the work of Arts et Métiers Institute of Technology researchers and makes it freely available over the web where possible.
This is an author-deposited version published in: https://sam.ensam.eu
Handle ID: .http://hdl.handle.net/10985/8926
To cite this version :
Adrian CLENCI, Adrian BIZIAC, Pierre PODEVIN, Georges DESCOMBES, Michael DELIGANT, Rodica NICULESCU Idle Operation with Low Intake Valve Lift in a Port Fuel Injected Engine -Energies - Vol. 6, p.2874-2891 - 2013
Any correspondence concerning this service should be sent to the repository Administrator : archiveouverte@ensam.eu
energies
ISSN 1996-1073
www.mdpi.com/journal/energies
Article
Idle Operation with Low Intake Valve Lift in a Port Fuel
Injected Engine
Adrian Clenci 1,2,*, Adrian Bîzîiac 3, Pierre Podevin 2, Georges Descombes 2, Michael Deligant 4 and Rodica Niculescu 1
1 University of Pitesti, str. Tg. din Vale nr. 1, Pitesti 110040, Romania; E-Mail: rodica.niculescu@upit.ro
2 Le CNAM, LGP2ES-EA21, 292, rue St. Martin, Paris, 75003, France;
E-Mails: pierre.podevin@cnam.fr (P.P.); georges.descombes@cnam.fr (G.D.)
3 Renault Group Romania; E-Mail: adrian.biziiac@renault.com
4 Arts et Métiers ParisTech, DynFluid, 151, Boulevard de l’Hôpital, Paris, 75013, France;
E-Mail: michael.deligant@ensam.eu
* Author to whom correspondence should be addressed; E-Mail: adrian.clenci@upit.ro;
Tel.: +40-721-492-718; Fax: +40-348-453-102.
Received: 21 September 2012; in revised form: 28 November 2012 / Accepted: 25 December 2012 / Published: 14 June 2013
Abstract: Reducing fuel consumption is a prime objective in the automotive industry in
order to meet regulatory and customer demands. Variable valve actuation offers many opportunities for improving the spark ignition engine’s performance in areas such as fuel economy and pollutant emissions. Our studies revealed that the ability to control maximum intake valve lift does indeed offer the ability to control intake air mass, but also has the added benefit that it improves the fuel-air mixing process thanks to an increased turbulence, caused by the increased intake flow velocity. This is particularly important at idle and low part loads when low maximum lifts are to be used for improving the fuel economy or for achieving the required power. The paper focuses on the experimental results obtained when approaching idle operation with different intake valve laws. Results indicating the potential of using low intake valve lift for fuel economy and cyclic dispersion improvement are presented in this paper.
Notations and Abbreviations:
ABDC after bottom dead center; A/D analog/digital;
Aiv flow area at the intake valve
gap (m2);
ATDC after top dead center; BBDC before bottom dead center; BTDC before top dead center;
°CA crank angle degrees (CAD);
CFD computational fluid dynamics;
CGI charge guided injection;
CI compression ignition;
Ch hourly fuel consumption, (Kg/h);
CoV coefficient of variance (%);
DAQ data acquisition;
DPa “in-cylinder / intake manifold”
pressure drop (bar);
deg degrees of crank angle (°CA);
dQ heat release rate (%/deg)
or (%/°CA);
ECR effective compression ratio;
ECU electronic/engine control unit;
EGR exhaust gas recirculation;
EIVC early intake valve closing;
EOC end of combustion;
EVC exhaust valve closing;
EVO exhaust valve opening;
FSI fuel stratified injection;
GDI gasoline direct injection;
HC unburned hydrocarbons;
hiv intake valve lift height (mm);
Hmin minimum intake valve law;
Hmax maximum intake valve law;
HR heat release;
IEGR internal exhaust gas recirculation; IMEP indicated mean effective
pressure (bar);
IVO intake valve opening;
IVC intake valve closing;
LIVO late intake valve opening;
λ air excess coefficient;
MAP (intake) manifold absolute
pressure (bar);
MBF mass burnt fraction;
MBFx the angle at which x% of the charge is burned (°CA);
MVL maximum valve lift (mm);
NEDC new European driving cycle;
P absolute pressure (bar);
PC personal computer;
PCYL in-cylinder absolute pressure (bar); PCYL_AVRG averaged in-cylinder pressure
over 100 cycles (bar);
PFI port fuel injected;
PMEP pumping mean effective
pressure (bar);
RON research octane number;
SI spark ignition;
TDC top dead center;
TWC three way catalyst;
Vcc combustion chamber volume;
VCR variable compression ratio;
VIVC cylinder volume at the intake valve
closing moment;
VVA variable valve actuation;
Wiv flow velocity at the intake valve
gap (m/s);
1. Introduction
In spite of the development of electrical vehicles, the internal combustion engine still remains today an appropriate and attractive solution for ensuring mobility. Engines have improved dramatically over
the past two decades [1], but current scientific developments [2] suggest that there could be a reduction of 6% to 15% fuel consumption in the coming decade.
While the compression ignition (CI) engine has made enormous progress in recent years concerning fuel economy, the spark ignition (SI) engine still lags behind from this point of view. Nevertheless, this gap can be reduced by the use of different technical solutions: lean burn and stratified-charge gasoline direct injection—GDI, variable valve actuation—VVA, variable compression ratio—VCR, Downsizing, Atkinson-Miller cycle, some of them already applied in mass production [1–11].
During most of its life, a passenger car engine is run under low loads and speeds. At these operating points, the overall engine efficiency decreases from the peak values (about 35%) to dramatically lower values (sometimes even below 10%), so technical solutions capable of offering better efficiency in this operating area are required.
Low loads on SI engines are traditionally accomplished by means of a throttle plate which creates additional pumping losses. Much of the research effort on improving SI engine efficiency therefore focuses on throttle-free load control. Two methods are being intensively investigated in order to obtain unthrottled operation: lean burn and stratified-charge GDI (see [1,2,9,10] or Mitsubishi GDI, VW FSI, Mercedes CGI, which are on the market) and VVA with a stoichiometric mixture (see [2–5,7,8,10–16] and BMW Valvetronic, on the market since 2001). Both techniques have demonstrated a significant improvement in fuel economy. However, only stoechiometric VVA still allows the use of the less expensive conventional exhaust gas after treatment (TWC), whereas lean GDI needs the more expensive extra treatment of nitrogen oxide.
VVA throttle-free load control can be achieved by different intake valve actuation strategies such as: combined variable valve lift, duration and timing [3–5,7,8,10–16]. The solution used by BMW with its Valvetronic-Vanos mechanism [4] is outstanding. It combines variable intake valve lift with very early intake valve closing (EIVC) at part loads and late intake valve opening (LIVO) at idle for combustion stability reasons [17–19] despite increasing pumping losses.
The BMW solution demonstrates that reducing pumping losses goal is one of the goals, but it must not be done while impairing other aspects such as the mixing process and charge kinetic energy prior to spark, which have a direct impact on the combustion process and cycle-to-cycle variation/cyclic dispersion. All these need to be carefully taken into consideration for each engine operating point. Among these points, idle operation plays a significant role, being a prominent feature of real world driving, especially in congested city traffic. Very few publications on VVA deal with idle operation. With the intake valve law set for nominal performance, the airflow velocity within the intake valve gap is greatly decreased at this operating point. Inevitably, this results in a deterioration of the air-fuel mixture formation with corresponding effects on combustion and cyclic dispersion [19]. Therefore, low maximum lifts could be used. However, especially for port fuel injected (PFI) engines, as the valve lift is reduced, the fuel break-up mechanism becomes far more complex with the introduction of fuel films, stripping, coalescence and gravitational valve slide-off [20]. This break-up mechanism can produce large drops, which enter the combustion chamber and mix rather poorly with the air. Some of these drops may end up as films on the wall surfaces, resulting in HC emissions [18,20–22]. Thus, prediction of the air-fuel stoichiometry in this particular case becomes a difficult task [21], with negative effects on fuel consumption and pollution.
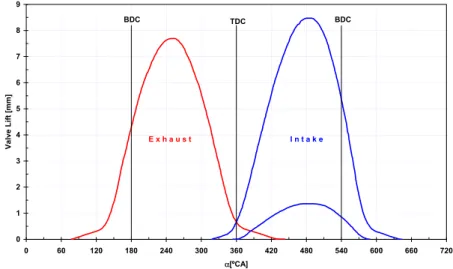
Given this context, the present paper presents the results of a PFI SI engine experimental investigation when operating at idle with low maximum intake valve lift. For this purpose, an original VVA engine prototype was used. Its VVA mechanism is able to adjust the intake valve lift continuously between minimum and maximum values during engine operation [5,6,11,23], see Figure 1 and Appendix.
Figure 1. Valve laws.
0 1 2 3 4 5 6 7 8 9 0 60 120 180 240 300 360 420 480 540 600 660 720 α[ºCA] V a lv e Li ft [m m ] E x h a u s t I n t a k e TDC BDC BDC
2. Experimental Apparatus and Procedure
2.1. Experimental Setup
The study was conducted on the engine prototype mentioned above whose main parameters are presented in Table 1.
Table 1. Main parameters of the VVA PFI SI engine prototype.
Number of cylinders 4
Stroke (mm)/Bore(mm) 77/76
Volumetric Compression Ratio 9.0
Combustion chamber Wedge type; 2 valves
Exhaust Valve Law
Maximum Valve Lift, MVL (mm) 7.5 Exhaust Valve Opening, EVO (°CA BBDC) 73 Exhaust Valve Closing, EVC (°CA ATDC) 42 Minimum Intake Valve Law
Maximum Valve Lift, MVL (mm) 1.165 Intake Valve Opening, IVO(°CA ATDC) 19 Intake Valve Closing, IVC (°CA ABDC) 29 Maximum Intake Valve Law
Maximum Valve Lift, MVL (mm) 8.275 Intake Valve Opening, IVO (°CA BTDC) 15
Intake Valve Closing, IVC (°CA ABDC) 73
NB. Exhaust and intake valve law parameters are given for a 0.2 mm reference lift.
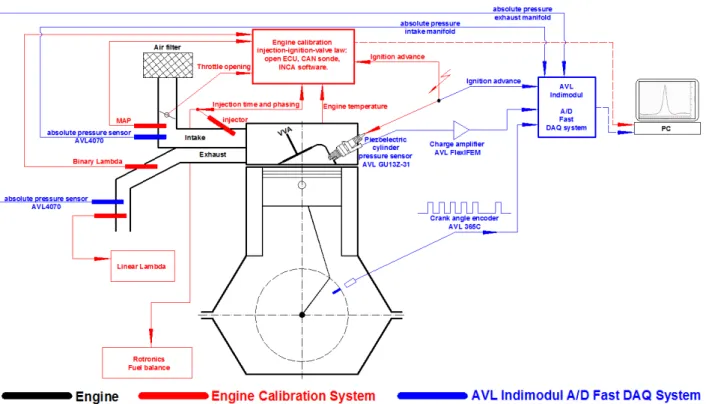
As it is shown in Figure 1 and Table 1, the minimum intake valve law features a relatively LIVO (i.e., the intake valve opens after TDC) and an earlier closing with respect to the maximum law. Figure 2 shows the structure of the experimental set-up developed at the University of Pitesti.
Figure 2. Schematic diagram of the experimental set-up.
The engine was equipped for acquiring the instantaneous in-cylinder, intake and exhaust manifold pressures in correlation with crankshaft rotation. Due to the inherent characteristics of the in-cylinder pressure piezoelectric transducer, it is necessary to reference its output to absolute pressure, i.e., the measured pressure must be referenced to a known absolute pressure at some point in an engine cycle. This is what is usually known as pegging. Reference [24] presents the pegging methods with their influence on the indicated calculated parameters. For our study, the cylinder pressure data were pegged by assuming that the in-cylinder pressure at 10 °CA after the intake BDC (±2°) was equal to the mean intake manifold absolute pressure. This method appears to be the best suited for low speeds and an untuned intake system, as is our case [24].
Data acquisition and analysis of cycle-related parameters were performed with AVL’s Indimodul 621 Hardware and Concerto software. Engine testing was conducted over 100 complete engine cycles for each sampling session. A p-V diagram displayed in real time was used to visually monitor combustion quality, which was judged statistically with the coefficient of variance (CoV) applied to some of the cycle parameters, as it will be shown later on.
During the experiments, the engine coolant temperature was maintained at 80 °C. 95 RON gasoline fuel was injected into the intake port towards the intake valves by a Siemens Deka two-hole injector at a constant gauge pressure of 3 bar. Fuel was injected onto a closed valve in order to take advantage of warm engine components. The fuel injection ended at mid-exhaust stroke, which was thought to provide enough time for the majority of fuel to vaporize and enter the cylinder as gas.
The engine’s injection and ignition management system parameters were modified in order to optimize the engine operation in stoechiometric conditions (λ = 1), in accordance with the new intake valve law employed. A linear oxygen sensor (with an accuracy of 1.5%) mounted in the exhaust pipe was used to ensure precise monitoring of the air-to-fuel ratio. Mapping, data acquisition and analysis
were performed with INCA software. Since the experimental investigations were performed at idle operation where engine stability is the key issue, especially for obtaining a reliable engine calibration map, the alternator was disabled, so that the periodic battery charging cycles did not affect engine stability. In order to provide the necessary electric energy to the engine, a stabilized controlled voltage source connected at 220 V was used.
2.2. Experimental Procedure
In order to outline the characteristics of using minimum intake valve law at idle operation and stoechiometric conditions (λ = 1) on the PFI engine, the following methodology was used: first, a sweeping of the ignition advance was performed to find the best ignition timing for this particular case; the criteria used were: minimum fuel consumption and cyclic dispersion; then, for the best ignition timing, a thorough comparative analysis was performed: minimum intake valve law (Hmin) vs. maximum intake valve law (Hmax). For this approach, the engine stabilizing strategy at idle operation, consisting in continuous actuation of the idle motor valve, controlling the throttle air by-pass, was disabled. In fact, the throttle air by-pass duct was also disabled/blocked. The dynamic setting of spark advance was also disabled. Thus, under all these conditions, the attainment of the idle speed target (800 rpm) was possible by manually actuation of the throttle plate. By doing this way, the precise flow area at the throttle plate is known for each of the approached cases.
3. Results and Discussion
3.1. Effect of Ignition Advance
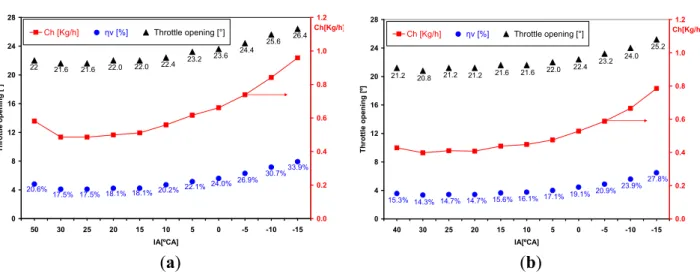
Figure 3 shows an arrangement of the ignition/spark advance (IA) sweeping. In both cases (Hmin and Hmax), it can be seen that when IA goes from the positive to negative values (positive values mean
that spark is produced before TDC, negative values mean that spark occurs after TDC), this induces
the opening of the throttle plate in order to attain the idle speed target.
It was expected that inefficient combustion, generated by the increasingly later production of spark, would need to be compensated by more pronounced throttle openings. Moreover, over the whole range of IA variation, the throttle opening is lower for the Hmin, which could be a sign of a better efficiency of thermal and mechanical processes.
It can also be observed that for both cases, the throttle opening has a minimum at IA = 30 °CA: 21.6° for Hmax and 20.8° for Hmin. The same observations hold for hourly fuel consumption (Ch). Since the tests were carried out in stoichiometric conditions (λ = 1), the volumetric filling efficiency has the same evolution as Ch.
Figure 3. Results of ignition advance sweeping. (a) Maximum intake valve law (Hmax); (b) Minimum intake valve law (Hmin).
20.6% 17.5% 17.5% 18.1% 18.1% 20.2% 22.1% 24.0% 26.9% 30.7%33.9% 22 21.6 21.6 22.0 22.4 23.2 23.6 24.4 25.6 26.4 22.0 0 4 8 12 16 20 24 28 50 30 25 20 15 10 5 0 -5 -10 -15 IA[ºCA] T h rott le ope ning [ º] 0.0 0.2 0.4 0.6 0.8 1.0 1.2 Ch[Kg/h] Ch [Kg/h] ηv [%] Throttle opening [°] 27.8% 15.3% 14.3% 14.7% 14.7% 15.6% 16.1%17.1% 19.1% 20.9%23.9% 25.2 24.0 23.2 22.4 22.0 21.6 21.6 21.2 21.2 20.8 21.2 0 4 8 12 16 20 24 28 40 30 25 20 15 10 5 0 -5 -10 -15 IA[ºCA] Th ro tt le o p en ing [º ] 0.0 0.2 0.4 0.6 0.8 1.0 1.2 Ch[Kg/h] Ch [Kg/h] ηv [%] Throttle opening [°] (a) (b)
Figure 4 presents a comparative analysis of the fuel consumption evolution. It can be seen that the smallest values are obtained for IA = 30 °CA (0.398 kg/h, respectively 0.487 kg/h, i.e., passing from Hmax to Hmin caused a fuel consumption improvement of 18.2%). Certainly, the resulted fuel economy is the best we obtained under the given conditions. This is the reason why operation with this.
Figure 4. Fuel consumption evolution over IA.
18.2% 15.6% 18.2% 14.4% 19.9% 22.9% 20.2% 20.4% 20.9% 18.1% 0.0 0.2 0.4 0.6 0.8 1.0 1.2 1.4 30 25 20 15 10 5 0 -5 -10 -15 IA[ºCA] Ch[Kg/h] 0% 5% 10% 15% 20% 25% Im pro vem en t[ % ] Hmax Hmin Improvement[%]
This is the reason why operation with this IA was taken as the reference situation to be used further on for outlining the advantages of using the minimum intake valve law at idle operation.
As concerns the cyclic dispersion phenomenon, the coefficient of variation in indicated mean effective pressure (IMEP) and maximum pressure (PMAX) was used (Figure 5a,b).
A significant reduction in the cycle-to-cycle variability of IMEP is observed (Figure 5a) when using Hmin. According to [18], vehicle driveability problems usually appear when CoVIMEP exceeds about 10%. Unfortunately, at idle operation, there is not much information available on clear values for CoVIMEP under different engine configurations. Concerning the cycle-to-cycle variability of PMAX, an increase is recorded when using Hmin (Figure 5b). Later on, after developing the combustion
analysis further, some explanations will be provided. However, at this stage, it can be pointed out that the CoVPMAX parameter is no longer relevant when the spark fires late enough, so that maximum pressure is solely the result of “pure” compression, since the combustion process starts very late after TDC (amongst the engine processes, besides combustion, the others are repeatable, and can therefore
be considered not to influence the cyclic dispersion): IA = [−15, 15] °CA for Hmax, respectively IA = [−15, 5] °CA for Hmin.
Figure 5. Cyclic dispersion analysis. (a) CoVIMEP; (b) CoVPMAX.
0 4 8 12 16 20 24 28 30 25 20 15 10 5 0 -5 -10 -15 IA[ºCA] CoV IMEP[ % ] Hmax Hmin 0 2 4 6 8 10 12 14 16 30 25 20 15 10 5 0 -5 -10 -15 IA[ºCA] Co VPM A X[ %] Hmax Hmin (a) (b)
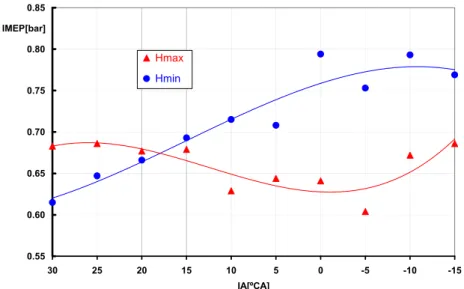
The evolution of IMEP when modifying the ignition advance is shown in Figure 6. For IA=30 °CA, a
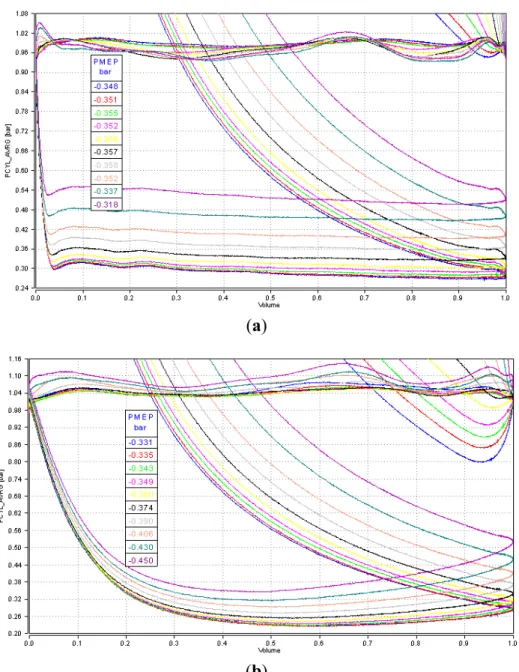
reduction of IMEP is recorded when using Hmin. This is due to some negative loops appearing at the end of the expansion stroke. Figure 7b shows that these negative loops occur until IA = 0 °CA (starting from the blue colour, corresponding to 30 °CA IA, till the grey one, corresponding to 0 °CA IA). However, as seen from Figure 6, they cease to have a negative influence on IMEP for IA ≤ 15 °CA.
Figure 6. IMEP vs. IA.
0.55 0.60 0.65 0.70 0.75 0.80 0.85 -15 -10 -5 0 5 10 15 20 25 30 IA[ºCA] IMEP[bar] Hmax Hmin
In order to explain these negative loops, a connection with the fuel consumption evolution (see Figures 3 and 4) and exhaust valve opening moment (EVO = 73 °CA BBDC, see Table 1) was made. This shows that the disappearance of the negative loops is related to the increase in fuel consumption.
Consequently, for IA = 30 °CA one can say that since the in-cylinder air-fuel mixture is the smallest, the expansion, corroborated with the well advanced EVO, causes the intense fall in pressure even in the sub-atmospheric domain.
Concerning the pumping work, Figure 7 also presents the PMEP obtained through calculation of the low loop area thanks to the accurate determination of the intersection point between the two usual loops of the indicated diagram. However, due to the experimental methodology (the attainment of the idle speed target imposed different throttle openings, see Figure 3), it was not possible to isolate or separate the effect of the intake valve law upon the pumping work. We will therefore not dwell on this point here, as it will be dealt with in a forthcoming paper.
Figure 7. Pumping loops for all IA taken into consideration. (a) Hmax; (b) Hmin.
(a)
3.2. Comparative Analysis for the Reference Ignition Advance
In order to proceed further with the comparative analysis (Hmax vs. Hmin), Figure 8 presents the
averagedindicateddiagramsover100cyclesforthereferencesituation at 30 °CA of ignition advance.
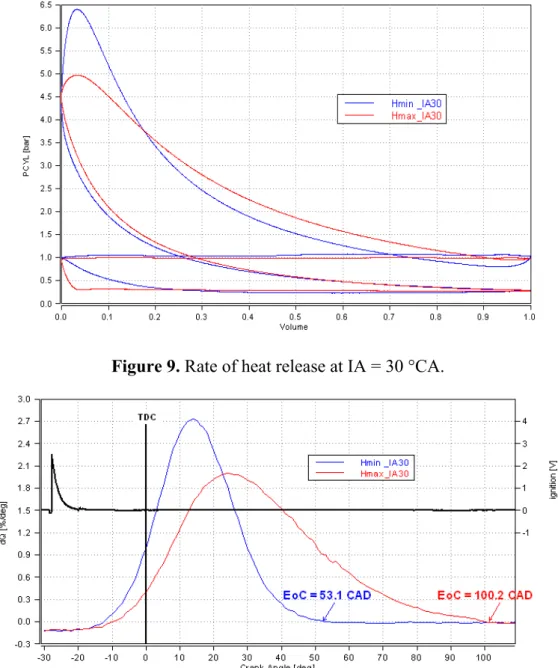
One reason for the higher pressure peak in the case of Hmin (the blue curve) is the higher effective compression ratio (ECR = VIVC/Vcc) caused by an earlier intake valve closing (EIVC) during the compression stroke, see Table 1. Calculations revealed an 8.1 ECR for Hmin, versus 5.8 for Hmax.
Another reason is a higher heat release rate (dQ) for Hmin, which also generates an earlier end of combustion (EoC), as shown in Figure 9. The heat release calculation is based on the first law of thermodynamics and EoC was conventionally taken as the first zero crossing of dQ.
Figure 8. Indicated diagrams.
The faster heat release rate obtained with Hmin can be attributed to the cumulative effects of the following:
1. Improved mixture homogenization thanks to an increased turbulence, caused by the increased intake flow velocity;
2. Reduced residual gas fraction, as a result of a reduced degree of internal exhaust gas recirculation (IEGR).
Concerning the latter, it is known that the residual gas acts as a diluent. A direct consequence of this is a substantial reduction in the burning velocity, which can be seen in Figure 9.
The following presents an attempt to quantify the gas exchange, and hence the IEGR degree. This is based on the analysis of the in-cylinder (PCYL), exhaust (PEXH) and intake (PMAN) manifolds instantaneous pressure evolutions. Figure 10 is used for the analysis of exhaust gas flow, from EVO (EVO = 73 °CA BBDC or 107 °CA in Figure 10) up to the end of the exhaust stroke (360 °CA in Figure 10).
Figure 10. Evolution of PCYL and PEXH between EVO and TDC. (a) Hmax; (b) Hmin.
(a) (b)
An intense normal flow of the burned gases from the cylinder to the exhaust manifold is revealed at Hmax up to 140 °CA (PCYL > PEXH); it is then followed by a slight backflow, as well as by a normal flow (Figure 10a). For Hmin, the normal flow (not as intense as before) manifests itself up to about 110 °CA, after which an intense backflow occurs (this is actually the negative loop mentioned previously—see also Figure 8), which generates a subsequent increase in the backpressure during the remaining exhaust stroke (compared to the Hmax situation; Figure 10b).
Figure 11 shows the same pressure evolutions between intake TDC (−360 °CA in Figure 11) and exhaust valve closing (EVC = 42 °CA ATDC or −318 °CA in Figure 11). As seen in Figure 11a, for Hmax, over the whole range considered, there are conditions for backflow (PEXH > PCYL), which also has the effect of reducing the in-cylinder pressure decreasing rate. For Hmin (Figure 11b), only between TDC and about −350 °CA, the flow is toward the exhaust manifold; this induces a decrease in the in-cylinder pressure.
To summarize the flow phenomena through the exhaust port, presented in Figures 10 and 11, it can
be considered that when operating with Hmin, the residual burned gas mass generated is lower than
Figure 11. PCYL and PEXH between TDC and EVC. (a) Hmax; (b) Hmin.
(a) (b)
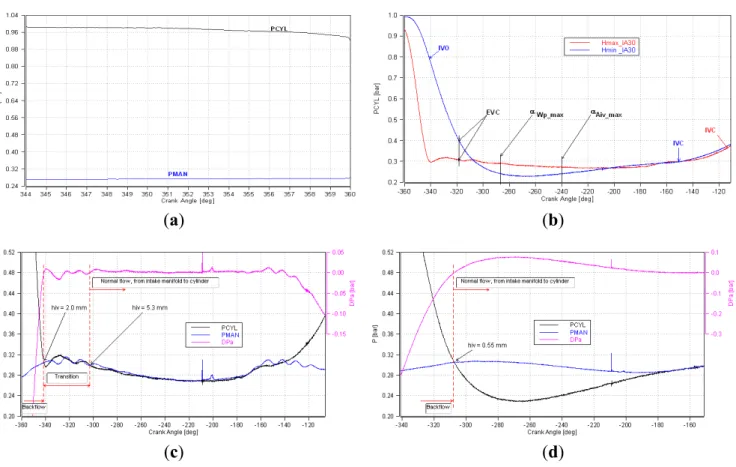
Concerning the IEGR through the intake port, Figure 12 presents the instantaneous in-cylinder and intake manifold pressure evolutions. Figure 12a shows that for Hmax, the IVO with an advance (IVO = 15 °CA BTDC) allows some burned gas to enter the intake manifold (PCYL > PMAN). This does not occur for Hmin, as the IVO is produced after the intake TDC (IVO = −341 °CA, Figure 12b,d). This also explains the difference in in-cylinder pressures at TDC: 0.995 bar at Hmin and 0.922 bar at Hmax, Figure 12b.
Figure 12. PCYL and PMAN evolutions. (a) Hmax, (IVO − TDC) angular range; (b) Hmin vs. Hmax; (c) Hmax, (TDC − IVC) angular range; (d) Hmin, (IVO − IVC) angular range.
(a) (b)
To pursue this reasoning further, at Hmax, the burned gas still flows within the intake manifold between TDC and about −340 °CA (Figure 12c). By corroborating this observation with the relatively high flow area at the intake gap (Aiv), this explains why the in-cylinder pressure falls faster than at Hmin, where the intake valve is still closed (Figure 12b); in this situation (Hmin), the in-cylinder pressure decreasing rate is the consequence of the cylinder volume increasing rate and the flow taking place between the cylinder and exhaust manifold. For Hmin, the backflow from the cylinder to the intake manifold occurs over a relatively narrow range between IVO and about −310 °CA (Figure 12d); this contributes to an acceleration of the in-cylinder pressure falling with respect to the hypothetical situation when the intake valve remains closed.
Thus, as seen in Figure 12c,d, the IEGR starts when the pressure difference DPa = PMAN − PCYL becomes positive. At Hmax, after about 35 °CA of backflow (Figures 12a,c) and a transition phase occurring about 38 °CA (Figure 12c), the normal flow begins; in the first part, the exhaust gases introduced within the intake manifold after the IVO enter the cylinder. For Hmin, according to Figure 12d, “exhausting” the burned gases in the intake manifold (the backflow) takes place about 33 °CA but this occurs when the flow areas within the intake valve gap are the smallest (when normal flow begins, the intake valve lift is barely 0.55 mm, see Figure 12d, compared to 2 mm or 5.3 mm, in the case of Hmax, see Figure 12c).
In fact, for Hmax, the normal flow occurs at high intake gap flow areas but at very low pressure drops (see DPa of the order of a mbar in Figure 12c), while, conversely, at Hmin, it is the cumulative result of low flow areas at the intake gap and relatively high pressure drops (see DPa of the order of tens of mbar in Figure 12d). The pair (DPa − Aiv) governs the flow velocity at the intake gap, Wiv, while the pair (Wiv − Aiv) governs the gas mass flow passing through the intake port. In Figure 12b, the moments corresponding to the maximum piston speed and maximum flow area at the intake gap are marked, so that it can be said for Hmin, the cumulative effect of the above-mentioned factors is a high intake flow velocity, Wiv, which, as stated before, is desirable in order to overcome the reduction in flow velocity at the valve gap taking place with the reduction of engine speed. Precise reports supporting the previous statement on intake flow velocity and its benefits are given in [17,19,22].
Thus, to summarize the flow phenomena through the intake port, presented in Figure 12, it can be considered that when operating with Hmax, the residual burned gas mass generated is greater than when using Hmin. This indicates that the IEGR has a lower intensity when using Hmin. In order to establish this beyond doubt, however, it would be necessary to obtain confirmation either by using exhaust gas analysis (HC and NOx measurements) or CFD numerical simulation.
Another important aspect would be to differentiate between the positive effects mentioned when explaining Figure 9. At the present time, however, with the current experimentation and data, this is not possible.
In order to have a more complete picture of the phenomena occurring when operating a PFI SI engine with low lift, we will now analyze the variability of the combustion process. While this analysis was applied above to some global parameters such as IMEP and PMAX (see Figure 5), in what follows it is the variability of the duration of different combustion phases which will be at issue (Figure 13).
According to reference [18], as combustion occurs through a flame propagation process, its variability is mainly caused by the cycle-to-cycle changes in the development of the initial flame kernel under the action of turbulent mixture motion. Especially significant is mixture motion in the vicinity of the spark
plug at the time of spark discharge since it governs the early stages of flame development. In other words, when the flame is particularly small, it is very susceptible to the mixture motion.
Figure 13. Statistical analysis applied on different combustion phases over 100 cycles.
(a) MBF5 variability; (b) MBF50 variability.
(a) (b)
Because the early flame development period (e.g., MBF5—the angle at which 5% of the charge is burned) represents a significant fraction of the total combustion duration (e.g., 28.5% for Hmax, and 36.6% for Hmin), it is expected to make an important contribution to cyclic variations in the combustion process.
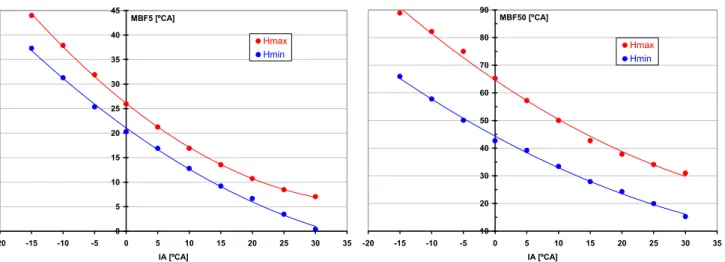
So, these features explain the much higher variability of MBF5 for Hmin (CoV = 165.2%, while only 40.3% at Hmax, Figure 13a). At the same time, as seen, turbulent flow generated by the intake events tends to accelerate the development of the flame kernel, leading to the reduction in different combustion phases (Figure 14). One explanation for this phenomenon is an intensification in
convective heat transfer.
Figure 14. Analysis of the combustion phases.
0 5 10 15 20 25 30 35 40 45 -20 -15 -10 -5 0 5 10 15 20 25 30 35 IA [ºCA] MBF5 [ºCA] Hmax Hmin 10 20 30 40 50 60 70 80 90 -20 -15 -10 -5 0 5 10 15 20 25 30 35 IA [ºCA] MBF50 [ºCA] Hmax Hmin
The next phase, corresponding to the fully developed flame phase, is positively influenced by the turbulence and mean velocity of the global mixture motion. Figure 13b shows that the variability of MBF50 decreased quite substantially in the case of Hmin, being even smaller than the one recorded at
Hmax (CoV = 17.7% compared to 21.4% at Hmax). This trend also holds for the rest of the combustion moments.
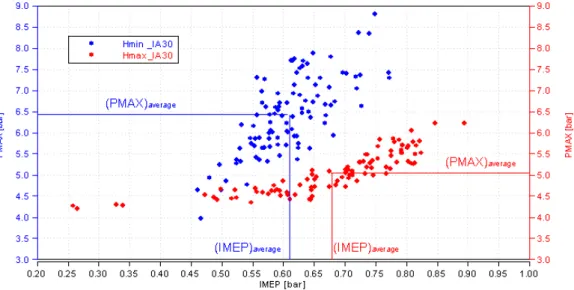
Figure 15 presents the maximum pressure (PMAX) over the indicated mean effective pressure (IMEP) for the 100 cycles acquired. It can be seen that there is no misfire, since only positive IMEP feature on the chart.
Figure 15. PMAX variability vs. IMEP variability.
Finally, by summing up the explanations proposed so far, it appears that for the Hmin case, the increased variability of PMAX (Figure 5b) is caused by the “enormous” variability of MBF5 (Figure 13a), while the reduced CoV of IMEP (Figure 5a) is a result of the reduced variability recorded for the rest of the combustion moments (e.g., MBF 50 in Figure 13b). Hence, the maximum pressure variation depends highly on changes in phasing of the burning process.
4. Conclusions and Perspectives
VVA seems set to become an industry standard. Generally used for improving global performances of SI engines, it offers new opportunities at low load and particularly at idle. In the current urban part of the NEDC driving cycle, idle operation totals 240 s, representing 31% of the total time. In real life congested city driving, idle operation could account for an even higher proportion.
Our experimental study on the low lift idle operation of a PFI engine revealed a clear improvement in fuel consumption and cyclic variability. Low intake valve lifts could be employed at this operating point in order to overcome the reduction in flow velocity at the valve gap which could have a negative effect on combustion efficiency and stability.
These gains could be even greater if a variable valve timing device or direct injection [10,12] were added to our engine. As seen in the paper, the gains are mainly generated by two factors: (1) an increased airflow velocity of the fresh mixture into the cylinders, causing an improvement in the fuel-air mixing process; and (2) a lower amount of residual burned gas as a consequence of a lower IEGR intensity. Finally, these two factors lead to a better and more repeatable combustion, as seen. Although not examined here, the reduction in friction and energy consumed to compress the intake valve springs while lifting the valves substantially lower also no doubt has a positive effect.
Additional studies are needed to better quantify the IEGR effects and a study dedicated to isolate the effect of the intake valve law upon the pumping losses is currently in progress. Also, in order to see the detailed phenomena occurring while injecting the fuel at idling, a CFD study concerning the airflow-fuel interaction has been launched. This study will also help to understand the mixture formation during cold start and idling when fuel vaporization is at issue.
Acknowledgments
The authors would like to thank Eric Pain and Julien Berquez from Renault Technologie Roumanie for providing the necessary hardware and know-how for the engine calibration. Thanks are also due to the technicians from the Automotive and Transports Department at the University of Pitesti for manufacturing many parts needed for the prototype engine and its instrumentation.
Appendix
Variable Valve Actuation Prototype Engines
Two operational 4 in-line cylinder engine prototypes able to continuously vary intake valve lift are working on the test benches at the University of Pitesti: one is a side mounted camshaft and overhead valves version, 1.4 liters displacement, and the other is an overhead camshaft version, 1.6 liters. Both of them are port fuel injected and have two valves per cylinder. Experiments that also proved their ability for unthrottled operation were conducted on the engine test bench [5].
The VVA mechanism used on these prototypes is the subject of numerous patents. As seen from the figure below, the mechanism is of the push-rod/rocker type, able to adjust the intake valve lift thanks to an assembly consisting of an oscillating follower and a translational skate. The skate’s position on the follower is adjusted with the help of a connecting rod and a control lever, so that every intake valve lift can be achieved continuously between minimum and maximum values during operation. Currently, the control lever’s position is given by a hydraulic cylinder, fed with oil from the engine’s main oil gallery; the hydraulic cylinder is attached to the engine [23].
Figure A1. The VVA mechanism featuring side mounting camshaft and overhead valves.
Figure A2.The VVA mechanism featuring overhead camshaft and valves.
Minimum intake valve law Maximum intake valve law
As seen in the above figures, the valve train does not feature hydraulic clearance adjusters, which certainly has a negative influence on cycle-to-cycle variability. Therefore, the effect of the small valve clearance changes cannot be separated from the total effect. However, when performing the cyclic dispersion (Hmin vs. Hmax), the differences in CoVIMEP and CoVPMAX (see Figure 5) are really significant, so there is no doubt about the real cause. The development of these prototypes was supported by the Romanian Council for Scientific Research (CNCSIS) and the French Agency for Research (OSEO-ANVAR).
References
1. Plotkin, S.E. Examining fuel economy and carbon standards for light vehicles. Energy Policy
2009, 37, 3843–3853.
2. Taylor, A.M.K.P. Science review of internal combustion engines. Energy Policy 2008, 36, 4657–4667.
3. Bernard, L.; Ferrari, A.; Rinolfi, R.; Vafidis, C. Fuel economy improvement potential of Uniair throttleless technology. J. Ital. Automot. Tech. Assoc. 2003, 56, 40–49.
4. Bernhard, L. Less CO2 thanks to the BMW 4-cyl. Valvetronic engine. J. Ital. Automot. Tech.
Assoc. 2003, 56, 96–102.
5. Biziiac, A.; Clenci, A.; Podevin, P. Interests and Concerns of the Variable Valve Actuation. In Proceedings of CNAM-SIA Rational Use of Energy in Internal Combustion Engines and Environment, Paris, France, 20 March 2007.
6. Clenci, A.; Descombes, G.; Podevin, P.; Hara, V. Some aspects concerning the combination of downsizing with turbocharging, variable compression ratio, and variable intake valve lift.
J. Automob. Eng. 2007, 221, 1287–1294.
7. Hannibal, W.; Flierl, R.; Stiegler, L.; Meyer, R. Overview of current continuously variable valve lift systems for four-stroke spark-ignition engines and the criteria for their design ratings. SAE
Trans. 2004, 113, 811–820.
8. Hong, H.; Parvate-Patil, G.B.; Gordon, B. Review and analysis of variable valve timing strategies—eight ways to approach. J. Automob. Eng. 2004, 218, 1179–1200.
9. Najjar, Y. Comparison of performance of a greener direct-injection stratified-charge (DISC) engine with a spark-ignition engine using a simplified model. Energy 2011, 36, 4136–4143.
10. Patel, R.; Ladommatos, N.; Stansfield, P.A.; Wigley, G.; Garner, C.P.; Pitcher, G.; Turner, J.W.G.; Nuglisch, H.; Helie, J. Un-throttling a direct injection gasoline homogeneous mixture engine with variable valve actuation. Int. J. Engine Res. 2010, 11, 391–411.
11. Podevin, P.; Clenci, A. Variable Valve Actuation for Internal Combustion Engines; Engineers’ Techniques Publisher: Paris, France, 2012.
12. Fontana, G.; Galloni, E. Variable valve timing for fuel economy improvement in a small spark-ignition engine. Appl. Energy 2009, 86, 96–105.
13. Kreuter, P.; Heuser, P.; Reinicke-Murmann, J.; Erz, R.; Ulrich, P.; Böcker, O. Variable valve actuation—Switchable and continuously variable valve lifts. SAE Trans. 2003, 112, 112–123. 14. Nagaya, K.; Kobayashi, H.; Koike, K. Valve timing and valve lift control mechanism for engines.
Mechatronics 2006, 16, 121–129.
15. Sher, E.; Bar-Kohany, T. Optimization of variable valve timing for maximizing performance of an unthrottled SI engine—A theoretical study. Energy 2002, 27, 757–775.
16. Zhang, Y.; Zhao, H.; Xie, H.; He, B.Q. Variable-valve-actuation-enabled high-efficiency gasoline engine. J. Automob. Eng. 2010, 224, 1081–1095.
17. Liu, D.; Wang, T.; Jia, M.; Wang, G. Cycle-to-cycle variation analysis of in-cylinder flow in a gasoline engine with variable valve lift. Exp. Fluids 2012, 52, 585–602.
18. Heywood, J. Internal Combustion Engine Fundamentals; McGraw-Hill: New York, NY, USA, 1988.
19. Pietsch, I.; Tschoke, H. Reduced intake valve lift of SI engines to improve mixture formation, fuel consumption and exhaust emissions. Ing. Automob. 2002, 9, 81–85.
20. Begg, S.M.; Hindle, M.P.; Cowell, T.; Heikal, M.R. Low intake valve lift in a port fuel-injected engine. Energy 2009, 34, 2042–2050.
21. Koederitz, K.R.; Evers, M.R.; Wilkinson, G.B.; Drallmeier, J.A. Break-up of liquid fuel films from the surfaces of the intake port and valve in port-fuel-injected engines. Int. J. Engine Res.
2002, 3, 37–58.
22. Wang, T.Y.; Peng, Z.J.; Wang, G.D. In-cylinder air motion characteristics with variable valve lift in a spark ignition engine—Part 1: swirl flow. J. Automob. Eng. 2011, 225, 479–497.
23. Podevin, P.; Descombes, G.; Clenci, A.; Hara, V.; Boncea, S. Procédé de régulation d’une levée de soupape, dispositifs de soupape à ouverture variable, moteur équipé d’un tel dispositif [in French]. French Patent FR2883927, 6 October 2006.
24. Lee, K.; Yoon, M.; Sunwoo, M. A study on pegging methods for noisy cylinder pressure signal.
Control Eng. Pract. 2008, 16, 922–929.
© 2013 by the authors; licensee MDPI, Basel, Switzerland. This article is an open access article distributed under the terms and conditions of the Creative Commons Attribution license (http://creativecommons.org/licenses/by/3.0/).
