HAL Id: hal-01761649
https://hal.archives-ouvertes.fr/hal-01761649
Submitted on 9 Apr 2018
HAL is a multi-disciplinary open access
archive for the deposit and dissemination of
sci-entific research documents, whether they are
pub-lished or not. The documents may come from
teaching and research institutions in France or
abroad, or from public or private research centers.
L’archive ouverte pluridisciplinaire HAL, est
destinée au dépôt et à la diffusion de documents
scientifiques de niveau recherche, publiés ou non,
émanant des établissements d’enseignement et de
recherche français ou étrangers, des laboratoires
publics ou privés.
Direct sample positioning and alignment methodology
for strain measurement by diffraction
Nicolas Ratel-Ramond, D. J Hughes, A. King, B. Malard, Z. Chen, P. Busby,
P. Webster
To cite this version:
Nicolas Ratel-Ramond, D. J Hughes, A. King, B. Malard, Z. Chen, et al.. Direct sample positioning
and alignment methodology for strain measurement by diffraction. Review of Scientific Instruments,
American Institute of Physics, 2005, 76 (5), pp.055103. �10.1063/1.1896726�. �hal-01761649�
STaR Centre, University of Salford, Salford, M5 4WT, United Kingdom P. J. Webster
FaME38 at ILL-ESRF, 6, Rue Horowitz, BP 156, 38042 Grenoble Cedex 9, France
and Institute for Materials Research, School of Computing, Science and Engineering, University of Salford, Salford M5 4WT, United Kingdom
共Received 3 December 2004; accepted 21 February 2005; published online 15 April 2005兲 An ISO共International Organization for Standardization兲 TTA 共Technology Trends Assessment兲 was published in 2001 for the determination of residual stress using neutron diffraction which identifies sample alignment and positioning as a key source of strain measurement error. Although the measurement uncertainty by neutron and synchrotron x-ray diffraction for an individual measurement of lattice strain is typically of the order of 10– 100⫻10−6, specimens commonly
exhibit strain gradients of 1000⫻10−6mm−1 or more, making sample location a potentially
considerable source of error. An integrated approach to sample alignment and positioning is described which incorporates standard base-plates and sample holders, instrument alignment procedures, accurate digitization using a coordinate measuring machine and automatic generation of instrument control scripts. The methodology that has been developed is illustrated by the measurement of the transverse residual strain field in a welded steel T-joint using neutrons. © 2005
American Institute of Physics. 关DOI: 10.1063/1.1896726兴
I. INTRODUCTION
The determination of the magnitude and distribution of residual stress in engineering components is important for many safety-critical applications. During manufacturing of these components, thermomechanical mismatches occur which lead to the existence of locked in or “residual” stresses. These stresses may be compressive or tensile. In general, tensile stresses are detrimental, supporting crack propagation for example, whereas compressive stresses are considered beneficial, limiting crack propagation.1 Because residual and applied stresses combine it is very important to know the residual stress field to accurately predict the total stress field and hence be able to determine component life-times and their creep behaviors.
The use of synchrotron x-ray and neutron facilities for the investigation of residual stresses in advanced engineering materials is increasing rapidly. This powerful technique es-sentially utilizes the crystal lattice of a polycrystalline mate-rial as a 3D strain gauge. Various types of neutron or x-ray sources are available worldwide. In the case of neutrons, sources are either reactor or accelerator共spallation兲 sources whereas intense high-energy x rays are provided by synchro-tron sources.
An ISO共International Organization for Standardization兲 TTA共Technology Trends Assessment兲 was published in 2001 which describes standard protocols for the measurement of residual stress using neutrons2and work on an equivalent for the synchrotron x-ray technique has started. Standard proce-dures are necessary to ensure that residual stress measure-ments are reliable and repeatable. Standards are common in materials inspection and their adoption is important to estab-lish academic and industrial confidence. One of the principal observations of these projects is the importance of accurate specimen location with respect to the measuring volume on the beamline. For an individual measurement of strain at a sample location, the specified uncertainty is often ⬇±50 ⫻10−6. This is typically the value obtained for a neutron
measurement whereas ⬇±10⫻10−6 is achieved for a syn-chrotron x-ray measurement. In a welded region3 for ex-ample, the strain gradient may be as high as ⬇1000 ⫻10−6mm−1 so that it is necessary to position the sample
within ±50m to achieve the specified uncertainty. In the case of steep strain gradients the principal source of uncer-tainty is therefore often due to positioning errors. The need for efficient protocols for sample alignment and positioning was a key recommendation of the ISO/TTA.2,4,5Here we de-0034-6748/2005/76共5兲/055103/5/$22.50 76, 055103-1 © 2005 American Institute of Physics
scribe an integrated direct approach to sample alignment and positioning including a sample mounting system, instrument alignment procedure coupled with accurate sample digitiza-tion using a coordinate measuring machine共CMM兲 and au-tomatic generation of instrument control script.
II. EXPERIMENTAL ISSUES
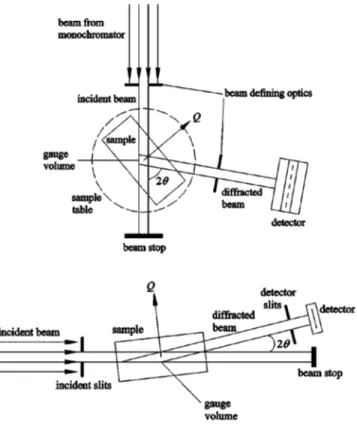
The design of neutron and synchrotron x rays diffracto-meters for strain measurement varies, although in most cases a “gauge volume,” the volume from which strain is mea-sured, is defined using beam optics on both the incident and diffracted beams. Figure 1 shows the outline diagrams of typical neutron and synchrotron x-ray diffractometers for strain analysis. The location, shape, and size of the gauge volume are defined by the diffraction angle and the beam optics system. In the case of neutron diffractometers, the angle between the incident and diffracted beam is usually around 90° thus obtaining a near-square shaped cross sec-tion. The gauge volume is elongated共diamond shaped兲 in the case of synchrotron x rays due to the high energy of the beam, which results in small Bragg angle values. The sample can be positioned with respect to the gauge volume using X,
Y, Z translators, and a rotation table is used to adjust the
strain measurement direction.
For most instruments an area of uncertainty is the inter-face between the diffractometer and the sample. Often there is not a standard or adaptable mounting system that enables reproducible sample positioning on the instrument. Users of-ten have to adopt a temporary system such as sticky tape or glue. These arrangements increase positioning uncertainty, irreproducibility in sample positioning, and inconvenient and
substantial time delays. Various solutions have been pro-posed to overcome these issues at neutron and synchrotron x-ray facilities. These generally involve a reliable sample fixturing system such as a large accurate breadboard at the sample position,6 kinematic sample mounts7 or the use of a CMM for sample metrology.8A further problem is that al-though the gauge volume is defined using beam optics, its position relative to the reference point of the diffractometer has often not been established accurately. In these circum-stances, a sample surface is located through the use of “en-trance and exit scans” in which the sample is traversed through the gauge volume and the diffracted intensity is re-corded. Typical entrance and exit scans are shown in Fig. 2 for a relatively thin sample共⬇4 mm thick兲. If the gauge is fully within the sample, the diffracted intensity is constant, neglecting attenuation effects due to different path lengths. The edge of a sample is defined as the point when half of the gauge volume is immersed in the sample therefore giving half the maximum diffracted intensity. This process is time consuming, particularly using neutrons, and is of limited as-sistance when the sample geometry is complex, when a sample has to be rotated or when the count rates are low. Furthermore, texture variations and strain changes can result in misleading scattered intensity entrance共or exit兲 profiles.
In order to overcome these issues a “direct positioning” approach has been adopted which provides a significant im-provement in accuracy as well as minimizes the time needed for sample alignment and therefore improves experimental beamtime efficiency. The direct positioning concept is based around the provision of a standard, accurate and reliable physical interface between the sample and beamline, to-gether with accurate determination of sample geometries us-ing a coordinate measurus-ing machine, determination of the spatial relationship between sample and gauge volume and the implementation of automated script generation for sample stage movement on the diffractometer.
FIG. 1. Typical arrangement of neutron共top兲 and synchrotron x-ray 共bot-tom兲 diffractometers for residual strain analysis.
FIG. 2. Entrance scan showing the intensity profile as a sample is scanned across the gauge volume.
III. SAMPLE POSITIONING SYSTEM
Sample fixturing benches are common in a range of sci-entific metrology applications. These are often based on a threaded or dowelled breadboard such as optical benches.6In order to implement a direct positioning system, an accurate sample positioning system was designed and tested. The sample is mounted in a sample holder that matches a base-plate. The base-plates were designed to replace, or attach to, the top plate of the diffractometer. The base-plate system consists of 12 mm thick aluminium alloy plates with a ma-trix of 25 mm pitch holes. Each hole is half threaded 共M6 threaded holes on a square matrix at 25± 0.005 mm centers兲 and half reamed共H5兲 to take a 6 mm 共m6兲 dowel for precise positioning, or the straight shank of an M6 screw for routine fixing.
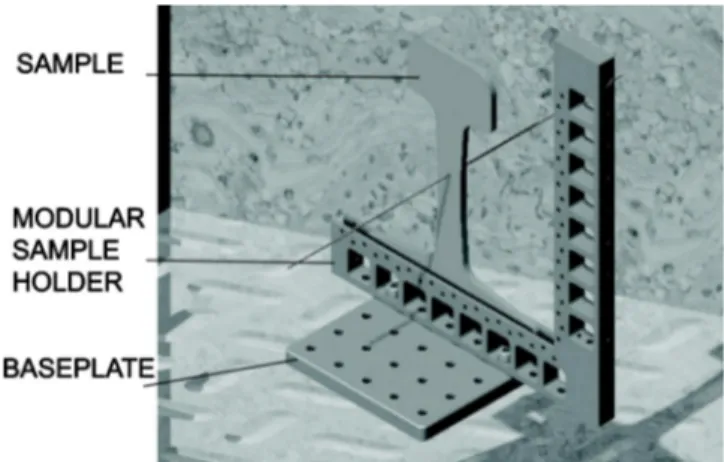
Sample holders with a matching 6 mm hole pattern have been designed to hold flat samples共such as slices of railway sections, welds,…兲, complex-shaped samples 共turbine blades,…兲 and pin-shaped specimens which allow for gauge volume position definition. A modular set of sample holders was designed in which two similar units may be combined to form an “L-shaped” sample holder. The interest of this de-sign is that it enables the user to accurately rotate the sample through 90° steps without dismounting it. This rotation is useful for stress determination. Figure 3 shows a view of a rail section mounted in an “L-shaped” sample holder. The holder is shown mounted upon a small base-plate. These sample holders are compatible with the base plates and en-able accurate and repeaten-able positioning of the sample on the base plate. It enables samples to be rapidly positioned to within ±100 microns and oriented to within ±0.1°, and to within ±10 microns and ±0.02° with care.9 Diffractometers at the ILL-ESRF共Grenoble, France兲 and the coordinate mea-suring machine at the FaME38 lab共Grenoble, France兲 have been equipped with this positioning system.
IV. BEAMLINE PREPARATION AND SAMPLE DIGITISATION
Coordinate measuring machines 共CMM兲 are routinely used in industry as quality control equipment共inspection兲 or less commonly used for model creation共digitization兲. After mounting on a standard base plate, samples are digitized
with a CMM prior to an experiment. The FaME38 laboratory is equipped with a Mitutoyo EURO-C-A776 CMM. A Ren-ishaw TP20 or SP600 ruby tipped probe is mounted on a motorized Renishaw PH10MQ articulated head that can be orientated in any direction over a hemisphere 共Fig. 4兲. The TP20 probe is designed for discrete measurements whereas the advanced SP600 probe is able to scan a surface whilst maintaining contact with it with an accuracy of⬇±2m. A Nextec Wizprobe laser measuring system is also available for non-contact measurements.
The direct positioning concept minimizes the amount of experimental time used for sample alignment and position-ing, as the majority of procedures for sample setup 共align-ment and positioning兲 are performed off-line before an ex-periment. At the start of an experimental session a pin-shaped specimen is placed in a standard pin holder. The direct positioning procedure starts by setting the top-center of the pin specimen as the origin of the measurements on the CMM. The orthogonal coordinate system on the CMM is chosen so as to be inverse of the X, Y, Z translator system on the beamline. In effect, the axes on the CMM are the same as those used on the instrument but in the opposite direction.
FIG. 5. Simplified 2-axis representation of the transposition of CMM coor-dinates into motor translations on the beamline. Through the adoption of an inverse coordinate system, a sample location共-Xi,-Zi兲 can be located at the gauge volume through a beamline motor translation of -Xi,-Zi. The position of the pin and pin holder is shown by dashed lines.
FIG. 3. View of a rail specimen mounted in a sample holder and attached to a base-plate.
FIG. 4. A weld section under investigation using the SP600 scanning probe. The sample is mounted in a standard sample holder and a base-plate is available on the CMM base.
Standard base plates are used as a reference to align the coordinate systems on the diffractometer and on the CMM. The top centre of the pin is used as a common reference point on the beamline共coincident with the center of the gauge兲 and on the CMM共origin of the measurements兲. The sample to be studied is mounted in a standard sample holder and is then digitized in the coordinate system on the CMM.
The next stage of the procedure is to position the gauge volume at the top centre of the pin. This can be achieved in different ways depending on the design of the instrument. For the neutron case, the pin is often placed at the centre of rotation of the goniometer and the gauge volume is made coincident with the tip of the pin by translating the primary and secondary optics across the incident and diffracted beam respectively.10 Variations in the intensity of the scattered beam are used to locate the beam with respect to the pin. For the synchrotron x-ray case, the pin is translated across the beam and the variations in scattered intensity enable the tip of the pin to be positioned at the gauge volume. In both cases, when the tip of the pin and the gauge volume are coincident, the translation axes X, Y, and Z of the diffracto-meter are set to zero.
At this stage the gauge volume and the top center of the pin are coincident with the reference point on the beamline. Coordinates obtained from a real sample using the CMM can now be used to drive the X, Y, Z translators and position the desired sample location at the center of the gauge volume. During the sample transfer from the CMM to the beamline, the relative position of the sample holder with respect to the pin holder position on the base plate共and the sample within the sample holder兲 must remain fixed or the coordinates are not correct. Figure 5 shows a simplified 2D drawing of the transposition of CMM coordinates into motor translations on the beamline. If we consider one required measurement point i in the sample, the coordinates of this point in the CMM coordinate system 共XCMM= −Xi, ZCMM= −Zi兲 and beamline coordinate system 共XBeamline= Xi, ZBeamline= Zi兲 are opposite. The motor translations required on-line to make this point coincident with the centre of gravity of the gauge volume 共XBeamline0= 0 , ZBeamline0= 0兲 correspond to translator
dis-placements of 共XBeamline0− XBeamline= −Xi, ZBeamline0− ZBeamline = −Zi兲. It must be remembered that in order to locate the gauge volume at a sample location it is necessary to move
the sample and not the gauge volume which is fixed in space at the reference point. Therefore, the coordinates obtained from sample digitization on CMM can directly be used as the input motor positions to place a measurement point in the sample at the centre of the gauge volume.
Most of the stages of this procedure are performed off-line. The only preliminary neutron measurement needed is the positioning of the gauge at the top centre of the pin, which is done just once at the start of an experimental ses-sion. Digitized samples in standard holders can then be di-rectly aligned and positioned with respect to the reference point on the beamline.
V. AUTOMATED MACRO GENERATION
Experiments to measure residual strain profiles usually require many measurements over an area or volume. For large numbers of measurement points it is unreliable and time-consuming to input by hand the commands to move the translators. By manipulating the coordinates obtained by digitization of the sample via software, it is possible to au-tomatically write the script共series of commands sent to the translation and rotation axes and to the detectors兲 to carry out the neutron or synchrotron x-ray strain mapping within the volume of the sample. The time spent on the beamline to set up the strain mapping experiment is then reduced to a mini-mum and the possibilities of errors are reduced.
A program named Easyscript was developed for beam-lines at the ILL and ESRF using the Matlab computing lan-guage. CMM data are used to generate the series of points where neutron or synchrotron x-ray measurements are to be performed in the bulk of the sample according to the require-ments of the user. A script for the experiment is then gener-ated. This includes the motor movements needed to place the desired location in the sample at the gauge volume and the acquisition commands for the detector. The software takes in account the translation limits of the motors and removes the points that are outside these machine limits. An option is available which prevents measurements which straddle a sur-face to prevent possible sursur-face aberrations.11
FIG. 6. Measurement points generated automatically using CMM surface data.
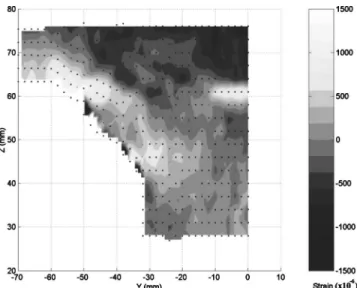
FIG. 7. Transverse residual strain data for steel T-welded sample.
VI. APPLICATION OF DIRECT SAMPLE POSITIONING
The protocols and software were tested using a fusion welded T-joint made of ferritic steel共see Fig. 4兲. The experi-ment was performed using the strain diffractometer D1A at the ILL neutron source in Grenoble, France. The welded sec-tion was digitized on both sides using the CMM with a high resolution measurement pitch 共0.2⫻0.2 mm2兲. An iron pin was used to define the reference point on the beamline.
Easyscript was then used to generate a square grid of points
at mid-thickness in the sample where neutron measurements were to be undertaken. Figure 6 shows the resulting map where neutron measurements were taken. The coordinates of these points were used to automatically write the series of commands that were sent to the motors/detector controlling units during the strain mapping experiment.
The sample was then mounted on the diffractometer table using the standard positioning system. Data analysis was performed using the software package LAMP developed by the ILL computing service and the strain results of the experiment are shown in Fig. 7.
VII. DISCUSSION
The need for improved sample positioning procedures for residual strain measurements has been identified in the ISO TTA共2001兲. The methodology developed uses a rigor-ous alignment procedure and incorporates the novel use of a CMM for accurate sample digitization. Figure 8 shows the principal operations of the developed procedure. It is pos-sible to perform the majority of operations offline, before the start of an experiment. Indeed, if required, users are able to measure all samples using the CMM and generate the control scripts in advance of the beamline initialization. The stan-dard base-plates and sample holders give reliable fixturing and allow users to easily create their own mounting system prior to an experiment. The Easyscript software package fa-cilitates automatic script writing which reduces the probabil-ity of errors and saves time. Measurements are made only at defined positions within a sample, whereas in the past it has often been common practice to define a rectangular
measure-The space around a sample is often limited; this is particu-larly the case with neutron measurements as the beam defin-ing slits are placed close to the sample. It is important to eliminate sample collisions with the beam defining optics as this often necessitates a complete realignment. The concept that the experiment should be simulated offline is currently being pursued. By using the CMM we can essentially obtain a CAD knowledge of the sample and by combining this with a CAD model of the beamline and the desired measurement script, it is possible to create a virtual beamline. In this way it is possible to predict and prevent collisions. This type of simulation will further enhance the experimental efficiency of residual strain experiments.
ACKNOWLEDGMENTS
The authors would like to thank Giovanni Bruno, Alex Evans, and Thilo Pirling at the ILL for fruitful discussion and assistance. Many thanks also are extended to Greg Johnson from Manchester Material Science Centre and Axel Steuwer of FaME38 for their useful help and advice on Easyscript software. The FaME38 project is supported by EPSRC Grant No. GR/R48070/01 and the ILL and the ESRF.
1
P. J. Withers and H. K. D. H. Bhadeshia, Mater. Sci. Technol. 17, 355
共2001兲. 2
ISO/TTA 3:2001(E), Polycrystalline Materials- Determination of Residual Stresses by Neutron Diffraction共Internatinal Organization for Standardiza-tion, Case Postale 56, CH-211 Geneva 20, Switzerland, 2001兲.
3
D. J. Hughes, M. N. James, D. G. Hattingh, and P. J. Webster, J. Neutron Res. 11, 289共2003兲.
4
D. J. Hughes, P. J. Webster, G. Mills, Mater. Sci. Forum 404–407, 561
共2002兲. 5
P. J. Webster, J. Phys. Soc. Jpn. 70, 504共2001兲. 6
T. Kiyokura, F. Maeda, Y. Watanabe, E. Shigemasa, A. Yagishita, M. Oshima, Y. Iketaki, and Y. Horikawa, J. Synchrotron Radiat. 5, 1111
共1998兲. 7
A. Lapicki, K. J. Boyd, and S. L. Anderson, J. Vac. Sci. Technol. A 18, 2603共2000兲.
8
J. A. James, J. R. Sanstisteban, L. Edwards, and M. R. Daymond, Physica B 350, 743共2004兲.
9
N. Ratel, Projet de Fin d’Études共INSA, Rennes, 2003兲. 10
W. P. Kang, “Application of numerical analysis to neutron strain scan-ning,” Ph.D. thesis, Salford University, UK, 1996.
11
A. D. Evans, A. King, T. Pirling, G. Bruno, and P. Withers, J. Neutron Res. 11, 229共2003兲.