UNIVERSITÉ DE MONTRÉAL
BACTERIAL CELLULOSE SUPPORTED SENSOR FOR BACTERIA AND
GAS DETECTION DEVELOPMENT
BENTOLHODA HELI
DÉPARTEMENT DE GÉNIE CHIMIQUE ÉCOLE POLYTECHNIQUE DE MONTRÉAL
THÈSE PRÉSENTÉE EN VUE DE L’OBTENTION DU DIPLÔME DE PHILOSOPHIAE DOCTOR
(GÉNIE CHIMIQUE) OCTOBRE 2017
UNIVERSITÉ DE MONTRÉAL
ÉCOLE POLYTECHNIQUE DE MONTRÉAL
Cette thèse intitulée:
BACTERIAL CELLULOSE SUPPORTED SENSOR FOR BACTERIA AND
GAS DETECTION DEVELOPMENT
présentée par : HELI Bentolhoda
en vue de l’obtention du diplôme de : Philosophiae Doctor a été dûment acceptée par le jury d’examen constitué de:
M. HENRY Olivier, Ph. D., président
M. AJJI Abdellah, Ph. D., membre et directeur de recherche M. MERKOҪI Arben, Ph. D., membre et codirecteur de recherche M. VIRGILIO Nick, Ph. D., membre
DEDICATION
To God, my beloved parents, my beloved husband, my beloved sister.
ACKNOWLEDGEMENTS
I would like to offer my grateful and sincere appreciation to my Ph.D. research supervisor, Professor Abdellah Ajji for his unconditional and solid support to conduct this challenging multidisciplinary project. It was my great honor to have this opportunity to work with him as a Ph.D. candidate at École Polytechnique de Montréal. I will never forget his patience, enthusiasm, motivation and accurate scientific attitude.
I would also like to express my sincere gratitude to Professor Arben Merkoҫi. It was my great privilege to work with his research team in Bioelectronics & Biosensors Group at Institut Català de Nanociencia i Nanotecnologia (ICN), Barcelona, Spain and to have him as co-supervisor in some parts of my research. Their innovative approach, encouragement, patience and broad knowledge helped me throughout this study. I wish to thank Dr. Eden Morales and Dr. Hamed Golmohamadi for full support and vast knowledge which gave me a hand to succeed in my research time in Barcelona fully and to publish the first article.
Besides my supervisors, I would like to thank the rest of my thesis committee, namely Professor Nick Virgilio, Doctor Teodor Veres, Professor Olivier Henry and Professor Clara Santato for accepting to evaluate my thesis.
I would like to acknowledge Professor France Daigle in Microbiology department of Université de Montréal and Professor Mike Buschmann who kindly allowed me to have access to their lab equipment. Furthermore, I would like to thank you Mrs. Julie Tremblay and all students and staff of these two laboratories.
Also, my heartful thanks go to other professors and technical staff of chemical engineering department especially Mrs. Claire Cerclé, Mr. Richard Silverwood, Mr. Redouane Boutrouka, Mrs. Martine Lamarche and Mr. Gino Robin.
Special thanks to all my friends and colleague in 3Spack group and École Polytechnique de Montréal for their help, comments and all great moment we share together, Hanan, Hajer, Mounia, Nury, and Ramin. My warm gratitude thanks to Dr. Nasim Salehi-Nik, for all her valuable advice and endless encouragements.
At the end, with all my heart; I would like to express my perpetual gratitude to my beloved parents and sister for their everlasting and unconditional love and support, for their spiritual encouragement
and for keeping hope alive in every single day of my life. I would also like to thank my lovely husband, Alireza, for being with me side by side in both tough and happy moments. His eternal love, patience, and encouragement have had a huge contribution to my success. Without you, this work could not be possible. However, it will never be a right word to reflect my feeling of appreciation about their self-sacrifice and altruism.
And Finally, I am so blessed by God, puts me in such an opportunity to evaluate myself, improve my personality and talent as well as finding so great people in my life.
RÉSUMÉ
Les intoxications dues à la consommation de produits alimentaires contaminés ont conduit à de nombreuses hospitalisations voire de nombreux décès mais ont également contribué à un énorme fardeau économique pour l’industrie alimentaire suite aux nombreux rappels et mise au rebus. Les méthodes traditionnelles (telles que les cultures microbiennes et croissances bactériennes) pour détecter les pathogènes sont relativement coûteuses et prennent beaucoup de temps et d’expertise à développer. De ce fait, il est devenu impératif de développer des approches de détection rapides et efficaces pour identifier la présence de bactérie(s) dans les aliments afin d’endiguer d’éventuelles épidémies rapidement. Le développement d’emballages alimentaires intelligents a considérablement évoluée récemment et génère de plus en plus d’intérêt afin de satisfaire les exigences des consommateurs et de l’industrie alimentaire, notamment dans tout ce qui a trait aux techniques de détection précoce de la présence de pathogènes et de bactéries.
L’émergence de matériaux nanostructurés a eu un impact considérable sur les techniques de détections précises et rapides d’une molécule unique. De plus, la taille et les propriétés spécifiques des nanoparticules, nanofibres et autres en font des outils prometteurs pour améliorer les tests de détection dans de nombreux domaines tels que la médecine, l’environnement et bien sur, le secteur de l’alimentation. Des appareils miniaturisés, connus sous le nom de biosenseurs, facilitent la détection in situ de pathogènes alimentaires, ce qui donne à l’industrie de l’emballage un atout considérable pour la détection de ces bactéries. Ce travail de recherche se concentre sur le développement de senseurs basés sur des techniques de détections optiques (telles que colorimétrique et fluorescence) pour la détection de bactéries de façon directe via une cellule de détection ou de façon indirecte par la détection de ses sous produits, le tout pour des applications dans le domaine de l’alimentaire. Les senseurs optiques suggérés ont été intégrés à la surface d’une plateforme solide afin de l’adapter à la demande et aux exigences de l’industrie de l’emballage alimentaire. Ici, de la cellulose bactérienne ayant des propriétés remarquables comme une structure en nanofibrilles, une transparence optique, de bonnes propriétés mécaniques et une disponibilité des groupements fonctionnels a été considérée comme plateforme pour assurer la synthèse de nanoparticule et l’immobilisation de biomolécules.
La première partie de ce travail se concentre sur la détection de composés organiques volatils qui peuvent être générés suite à la croissance bactérienne. La méthode proposée consiste en l’utilisation de nanoparticules d’argent, dont les propriétés plasmoniques permettent une détection colorimétrique. Les nanoparticules d’argent sont donc synthétisées dans de la cellulose bactérienne via une procédure in situ qui résulte en la fabrication d’un nano-papier plasmonique dont les propriétés peuvent être hautement modulable uniquement par la modification de la distance entre les particules et/ou de leur taille. Les résultats ont démontré que les nanoparticules plasmoniques ainsi préparées sont très sensibles à des concentrations variées de vapeur d’ammoniaque. La détection précise de l’ammoniaque a été mesurée par absorbance UV-visible qui est associée aux propriétés plasmoniques des nanoparticules d’argent. Une réduction de l’intensité du pic plasmonique de l’argent a été observée lors de l’augmentation de la concentration en ammoniaque et de la durée d’exposition à ses vapeurs. Comme l’ammoniaque est un produit indicateur de contamination bactérienne dans la viande et le poisson, la plate-forme proposée permet la détection et le suivi de la contamination. Il a également été découvert que la taille des nanoparticules d’argent au sein de la cellulose bactérienne subit une réduction due à l’exposition à l’ammoniaque. Suite à ce phénomène, le nano-papier montre un changement de couleur, respectivement d’ambre foncé à ambre clair, au cours de l’interaction avec la vapeur d’ammoniaque, ou de gris à taupe en la présence de poisson ou de viande contaminée (dégageant de l’ammoniaque). Ces résultats prometteurs ouvrent toute une fenêtre d’opportunités pour le développement d’une technique de détection de contamination de la viande et du poisson par l’intermédiaire d’emballages intelligents. Dans la seconde partie de ce travail, nous avons développé un biosenseur pour la détection de bactéries grâce à la méthode basée sur le principe de fluorescence. Ce biosenseur a été développé en utilisant la technique de transfert d’énergie entre molécules fluorescentes (FRET) reposant sur le principe de Förster, une approche de transfert d’énergie non radiative entre un fuorophore photoexcité et une molécule dite accepteur et qui dépend fortement de la distance entre ces molécules. Parmi plusieurs paires de donneur-accepteur, le quantum dot nano-cristal et les nanoparticules d’or sont reconnus comme étant les plus efficaces dans la technique FRET. Au cours de la deuxième partie de ce travail de recherche, le développement d’un biosenseur pour la détection de bactéries a été étudié. Pour développer un biosenseur prometteur, une plate-forme sur une surface solide a été considérée avec les paramètres appropriés pour supporter la bio-reconnaissance des éléments. Il est apparu que la cellulose bactérienne imprégnée avec des
nanoparticules d’or permet d’arriver à un système intéressant, soit d’obtenir des propriétés plasmoniques pour l’or et d’abondants groupes fonctionnels pour la cellulose bactérienne. Les résultats ont montré que la plate-forme peut ainsi absorber l’énergie de transfert d’un matériau fluorescent photo-excité, causant une réduction de leur photoluminescence. Cependant, la haute densité des nanoparticules d’or qui génère une capacité de réduction forte, si réduite, entrainera une réduction de cette capacité. Le nano-papier synthétisé présente une surface solide novatrice avec des capacités de désactivation qui peuvent être utilisées en détection par fluorescence comme le FRET.
Dans la dernière partie de ce travail, un biosenseur pour la détection bactérienne a été développé basé sur les résultats obtenus au cours de la seconde partie de ce travail. Ce biosenseur a été développé en utilisant l’approche FRET. La cellulose bactérienne carboxylée mélangée avec des nanoparticules d’or sert d’accepteur et en même temps permet la liaison croisée avec l’élément de bio-reconnaissance de la plate-forme solide. Un point quantique (Quantum dot, QD) conjugué à l’anti E. coli joue le rôle de donneur qui se lie à la protéine A/G immobilisée à la surface de la cellulose bactérienne carboxylée. La photo-luminescence du QD génère une réaction de réduction une fois que l’anti E. coli conjugué avec le QD interagit avec la bactérie respective (E. coli). De ce fait, la distance entre le QD et la surface de l’accepteur est réduite, ce qui a pour conséquence le changement de conformation inhérent dans la structure de l’anticorps. Grâce à cette stratégie, E.
coli a été détectée à la limite de la LOD près (Limite de Détection-Limit of Detection) qui se situe
autour de 10 CFM.mL-1. Cet immuno-senseur identifie la bactérie directement sans autre traitement supplémentaire. Compte tenu de sa simplicité et de sa sélectivité, ce senseur a le potentiel d’être implanté en tant capteur dans un emballage alimentaire.
Finalement, les résultats de ce projet de recherche sont multidisciplinaires et peuvent influencer plusieurs domaines de la science : 1) le secteur environnemental grâce à l’introduction d’une nouvelle génération d’emballages intelligents qui permettraient la reconnaissance précoce des pathogènes et des bactéries permettant de prévenir les infections; 2) la technologie des biosenseurs, en introduisant le nano-papier comme une plate-forme sensible et versatile pour la détection de vapeur; et 3) la simulation des propriétés intrinsèques d’un anticorps pour une détection directe d’antigènes.
ABSTRACT
Foodborne outbreaks due to the consumption of contaminated food products result not only in hospitalization and death, but also place a large economical burden on the food industry due to product recall and disposal. Traditional methods (such as microbial cultures and bacterial growth) for detecting pathogens are relatively costly, time-consuming, and expert related. Therefore, rapid, accurate and in-situ approaches for identifying bacteria in the food industry are urgently needed to overcome the problem that can be widespread easily. Recently, smart food packaging has evolved to meet the demands of customers and food industries, especially in early recognition techniques of pathogens or spoilage bacteria.
The emergence of nanostructured materials has had the greatest impact on the advancement of the most straightforward, quick and accurate detection of a single molecule. On the other hand, the size and unique properties of nanoparticles, nanofibers, nanorods, etc., make them promising tools for the improvement of recognition bioassay in various fields such as medicine, environment and food sectors. In this case, miniaturized devices, known as sensors, facilitate the in-situ detection of foodborne pathogens, benefiting the food packaging industry significantly. This research was addressed the development and demonstration of sensors based on optical techniques (e.g., colorimetric and fluorescent-based methods) for the detection of bacteria, directly through a whole cell or indirectly through its by-product. The suggested optical sensors were integrated to the surface of a solid platform to make it more compatible with demands in the food packaging. Here, bacterial cellulose with remarkable features such as the nanofibrils structures, optical transparency, mechanical properties and, availability of functional groups was considered as the platform, supporting the synthesis of nanoparticles and immobilization of biomolecules.
The first part of this work focused on the detection of volatile organic compounds which may be produced during bacterial growth. The proposed method relied on using silver nanoparticle and its plasmonic properties, allowing a colorimetric technique. As such, the silver nanoparticles were synthesized within bacterial cellulose through an in-situ procedure that resulted in the fabrication of a plasmonic nanopaper, highly tunable by the change of size and interparticle distance. The results demonstrated that the prepared plasmonic nanoparticle is very sensitive to various concentrations of ammonia vapor. Interestingly, the precise detection of ammonia was measurable by the UV-vis absorbance spectra associated with the plasmonic properties of silver nanoparticles
and trancparency of bacterial cellulose. Consequently, it revealed a reduction in the intensity of a plasmonic peak by increasing the concentration of ammonia and time of exposure. As ammonia is one of the primary compounds of bacterial spoilage in meat and fish, the proposed platform was assessed against the produced gases during spoilage. We also discovered that the size of silver nanoparticles embedded in the bacterial cellulose endured a reduction due to the etching by exposure to the ammonia. As observed, because of this phenomenon, the nanopaper exhibited a color change from amber to a light amber by interacting with ammonia vapor and, to a gray or taupe upon the presence of ammonia in fish spoilage or for meat, respectively. Thus, these results opened the window to an innovative technique for examining the spoilage in meat and fish by smart packaging.
In the second part of this research, we studied the development of a biosensor for detection of bacteria relying on the fluorescent based-method. This biosensor was developed by using Förster (fluorescence) resonance energy transfer (FRET) approach that is a non-radiative energy transfer from a photoexcited fluorophore to an acceptor molecule with strong dependency on the distance between these molecules. Among various donor-acceptor pairs, nano-crystal quantum dot and gold nanoparticles are known as the high efficient ones in FRET technique. In order to design a promising biosensor, a solid surface platform was considered with the appropriate features to support the biorecognition and transducer elements. Interestingly, we found that bacterial cellulose impregnated with gold nanoparticles addressed the demands for such a system, owing to the plasmonic properties of gold nanoparticles (served as the acceptor) and abundant functional groups available in the bacterial cellulose. Our result showed that it functioned to absorb the energy transfer from photoexcited fluorescent materials, caused a reduction their photoluminescence. Accordingly, the high population density of gold nanoparticle-bacterial cellulose was intended as a strong quencher while this ability reduced by the reduction of the nanoparticle population density. Successfully, the synthesized nano paper presented a novel solid surface with quenching ability that can be utilized in fluorescence detection approaches such as FRET.
In the last step, a biosensor for bacterial detection was assembled based on the obtained results from the pervious step of this research and by applying FRET approach. The carboxylated bacterial cellulose embedded with gold nanoparticles served as the acceptor and simultaneously cross-linked to the biorecognition element as the solid platform. Quantum dot (QD) conjugated to anti-E. coli
played as the donor which bonded to the protein A/G immobilized on the surface of carboxylated bacterial cellulose. The photoluminescence of the QD endured a reduction once the anti-E. coli conjugated QD interacted with the respective bacteria. So, the distance between the QD and the surface of the acceptor was reduced, as the consequence of the inherent conformational change in the antibody structure after interacting. Through this strategy, E. coli was recognized with a LOD (limit of detection) about 10 CFM.mL-1. Thus, this immunosensor identified the bacteria directly without employing extra treatments. Given the simplicity and selectivity, the proposed biosensor has the potential to be implemented as a portable device in food packaging.
Finally, the results of this research involve multidisciplinary and novel outcomes that can influence several fields of science. 1) the environmental sector, by introducing a new generation of smart packaging that allows early recognition of foodborne pathogens and spoilage bacteria to prevent infections outbreak, 2) biosensing technology, by introducing plasmonic nanopaper as a versatile and sensitive platform for the detection of vapor; and suggesting the intrinsic properties of an antibody for straightforward detection of antigens.
TABLE OF CONTENTS
DEDICATION ... III ACKNOWLEDGEMENTS ... IV RÉSUMÉ ... VI ABSTRACT ... IX TABLE OF CONTENTS ...XII LIST OF TABLES ... XVII LIST OF FIGURES ... XVIII LIST OF ABBREVIATIONS ... XXIII
CHAPTER 1 INTRODUCTION ... 1
CHAPTER 2 LITERATURE REVIEW ... 4
2.1 Sensor ... 4 2.1.1 Receptor ... 5 2.1.1.1 Antibody ... 5 2.2 Transducer ... 10 2.2.1 Electrochemical sensor ... 10 2.2.2 Optical sensor ... 10 2.2.2.1 Fluorescent-based detection ... 11 2.3 Quantum Dots ... 16
2.3.1 Quantum dots properties ... 16
2.3.2 Quantum dot applications in bioassay ... 17
2.4 Noble metal nanoparticles in bioassay ... 18
2.4.1 Gold nanoparticles as quencher ... 20
2.5 Solid-based FRET assay ... 22
2.5.1 Cellulosic-based substrate ... 23
2.6 Volatile organic compounds and detection of fish and meat spoilage ... 28
2.7 Problem identification ... 30
CHAPTER 3 OBJECTIVES AND ORGANIZATION OF THE ARTICLES ... 32
3.1 Objectives ... 32
3.1.1 General objective ... 32
3.1.2 Specific objectives ... 32
3.2 Organization of Articles ... 33
CHAPTER 4 ARTICLE 1: MODULATION OF POPULATION DENSITY AND SIZE OF SILVER NANOPARTICLES EMBEDDED IN BACTERIAL CELLULOSE VIA AMMONIA EXPOSURE: VISUAL DETECTION OF VOLATILE COMPOUNDS IN A PIECE OF PLASMONIC NANOPAPER ... 35
4.1 Abstract ... 36
4.2 Introduction ... 36
4.3 Experimental ... 38
4.3.1 Reagents and equipments ... 38
4.3.2 Synthesis of plasmonic nanopaper ... 41
4.3.3 Preparation of the gas sensing set-up ... 41
4.3.4 Sample preparation for TEM analysis ... 42
4.3.5 Raman analysis ... 42
4.4 Results and discussion ... 42
4.4.1 The effect of ammonia vapor on AgNPs embedded in bacterial cellulose nanopaper .. ... 42
4.4.3 Sensing performance ... 45 4.4.4 Raman analysis ... 49 4.5 Conclusions ... 50 4.6 Acknowledgements ... 51 4.7 References ... 51 4.8 Supporting Information ... 55
4.8.1 Supporting information content ... 55
4.8.1.1 Figures ... 56
4.8.1.2 Estimation of Evaporation rates and Limits of Detection ... 58
4.8.2 Supplementary References ... 59
CHAPTER 5 ARTICLE 2: NANOPAPER-BASED PLATFORM APPLICABLE IN SOLID-BASED FRET TECHNIQUE ... 60
5.1 Abstract ... 61
5.2 Introduction ... 61
5.3 Materials and methods ... 63
5.3.1 In-situ synthesis of AuNP within BC ... 63
5.3.2 Sample preparation for TEM ... 64
5.3.3 Estimation of quenching efficiency ... 64
5.4 Results and discussion ... 65
5.4.1 Characterizing the in-situ synthesized AuNP-BC ... 65
5.4.2 Estimating the fluorescence quenching efficiency ... 68
5.5 Conclusion ... 71
5.6 Acknowledgments ... 72
CHAPTER 6 ARTICLE 3: TOWARD A NANOPAPER-BASED AND SOLID PHASE
IMMUNOASSAY USING FRET FOR RAPID DETECTION OF BACTERIA ... 76
6.1 Abstract ... 77
6.2 Introduction ... 77
6.3 Experimental methods ... 79
6.3.1 Reagents and instruments ... 79
6.3.2 Carboxylation of bacterial cellulose (CBC) ... 80
6.3.3 In-situ synthesis of AuNP within CBC (AuNP-CBC) ... 81
6.3.4 Protein A/G immobilization on the CBC and the AuNP-CBC ... 81
6.3.5 Conjugation of antibody to quantum dot... 82
6.3.6 Characterization of the immobilized protein A/G on nanopaper-based platform ... 83
6.3.7 Pathogen recognition platform ... 83
6.4 Results and discussion ... 84
6.4.1 Carboxylation of bacterial cellulose (CBC) ... 84
6.4.2 In-situ synthesis of AuNP within CBC ... 85
6.4.3 Protein A/G immobilization on the nanopaper platform and its characterization ... 86
6.4.4 Bacteria recognition ... 89
6.5 Conclusions ... 90
6.6 Acknowledgments ... 91
6.7 References ... 91
6.8 Supporting information ... 95
6.8.1 Bacteria growth and preparation ... 96
CHAPTER 7 GENERAL DISCUSSION ... 99
CHAPTER 8 CONCLUSIONS AND RECOMMENDATIONS... 106
8.2 Original contribution and novelty ... 108 8.3 Recommendations ... 109 LIST OF REFERENCES ... 110
LIST OF TABLES
Table 2-1. Identified compounds from P. aeruginosa, S. aureus, E. coli, and S. Typhimurium through SEMSI-MS [115] ... 28 Table 2-2. Strains of bacteria are commonly found in the raw meat stored in different conditions,
vacuum packaging (VP) and modified atmosphere packaging (MAP) [126]. ... 29 Table 4-1. Limits of detection of the explored system a ... 47 Table 4-2. Modulation of population density (PD) and average size (AS) of the AgNPs embedded in
the nanopaper via volatile compound exposure. ... 49 Table S 4-1. Estimation of initial evaporation rate of NH3. ... 58
Table S6-1. A comparison between the amount of immobilized protein A/G in different condition and various platforms. These amounts are estimated through the Bradford assay analysis. . 97
LIST OF FIGURES
Figure 2-1. (A) a schematic of the integration of a biosensor [7], (B) a popularity of the applied transducers for the pathogen detection [13]. ... 5 Figure 2-2. The schematic of the IgG structure and its differentiation to the various blocks of amino
acids. The dark and light blue chains represent the heavy (H) and light (L) chains of an antibody, respectively. Each one is composed of the variable (V) and constant (C) region [17]. ... 6 Figure 2-3. The probabilities of an antibody positions after immobilization on the surface of a
substrate [18] ... 7 Figure 2-4. The illustration of EDC/S-NHS chemistry [25]. ... 8 Figure 2-5. A schematic of optical sensing along with the representative components and
techniques applied to a biosensor for the detection of pathogen: (A) various types of receptors, (B) the established substrates and (D) the sensing approaches [38]. ... 11 Figure 2-6. An illustration of Jablonski diagram which shows the fluorescent mechanism [39]. . 12 Figure 2-7. A schematic of FRET process and the overlap between the absorbance spectra of
acceptor and emission spectra of donor [47]. ... 14 Figure 2-8. Demonstrating the dependence of FRET efficiency on the distance between donor and
acceptor [48]. ... 15 Figure 2-9. (A) a schematic and TEM image of a quantum dot composed of CdSe/ZnS core/shell,
(B) the change in the emission spectra and color of CdSe/ZnS with increasing the nanocrystal size [57]. ... 16 Figure 2-10. An illustration of the detection of bacteria through establishing a sandwich model.
[62]. ... 17 Figure 2-11. Colors change of various sized monodispersed (A) silver nanoparticles and (C) gold
nanoparticles. (B) and (D) graphs show the respective UV-Vis spectra of dispersed silver and gold nanoparticles, respectively [72]. ... 19 Figure 2-12. (A) a schematic of colorimetric detection of E. coli through anti- E. coli conjugated
E. coli conjugated nanorods upon addition of E. coli (104 CFU.mL-1) and (D) TEM image showing the aggregation of gold nanorods on the surface bacteria [86]. ... 22 Figure 2-13. A schematic of the chemical structure of cellulose and effect of hydrogen bonds on
its formation [98]. ... 24 Figure 2-14. The presented figures show the differences in the structure of various nanocelluloses
[101]. ... 25 Figure 2-15. SEM of the composit nanopapers (A) bare bacterial cellulose nanopaper. (B) AgNP-BC: (B-a) AgNPs synthesized in-situ BC (B-b,c) AgNP-BC in the presence of 10 μg mL-1 of methimazole and 4 μg mL-1 of iodide, respectively (C) SEM of AuNP-BC: (C-a) AuNP-BC;
(C-b, c) AuNP-BC in the presence of 8 μg mL-1 of thiourea and 4 μgmL-1 of cyanide, respectively. (D) SEM of QDs embedded within bacterial cellulose nanopaper. (E) SEM of UCNP-BC. (F) Graphene oxide-coated QD-BC. (G) Graphene oxide-coated UCNP-BC [112]. ... 27 Figure 4-1. Modulation of the population density of AgNPs embedded in bacterial
cellulose via corrosive vapor (ammonia) exposure. Appearance of AgNP-BC without ammonia vapor exposure (A) and after ammonia vapour exposure (C). TEM micrographs of AgNP-BC without ammonia vapour exposure (B and B′) and after ammonia vapour exposure (D and D′). Estimation of the size distribution of the studied AgNPs (E) without ammonia vapour exposure (control) and after ammonia vapour exposure. The box plots show the median, 25th and 75th percentiles and the extreme values of the respective size distributions (5–95 percentile). ... 40 Figure 4-2. Specificity of the nanoplasmonic membrane as a corrosive vapor (ammonia) sensing
platform. A. UV-Vis spectra of plasmonic nanopaper upon vapor exposure using an initial volume of 1000 µL of different volatile compounds spontaneously volatilized for 18 hours. B. Blue shift observed in the UV-Vis spectra depending on the volatile compound exposed. C. Changes in optical density according to the volatile compound exposed. The error bars represent the standard deviation of three parallel experiments. a. Methanol. b. Ethanol c. Propanol. d. Acetic acid. e. Ethyl acetate. f. Acetonitrile. g. Ammonia. h. Acetone. i. Toluene. j. Indole. k. Water. l. Triethylamine. ... 44
Figure 4-3. Behavior of the nanoplasmonic membrane as a corrosive vapor sensing platform. A. UV-Vis spectra of the plasmonic nanopaper upon corrosive vapour (ammonia) exposure using 10 and 1000 µL of 30% ammonia solution spontaneously volatilized for between 2 and 12 hours. B. Calibration curves displaying changes in optical density depending on the initial volume to be volatilized (from 10 to 1000 µL) and the exposure time (2–12 hours). The error bars represent the standard deviation of three parallel experiments. ... 46 Figure 4-4. Food spoilage monitoring via plasmonic nanopaper. A. UV-Vis spectra of the
nanoplasmonic membranes before food spoilage exposure (Ctrl) and after food spoilage exposure (ammonia and several volatile organic compounds are released during fish and meat spoilage). B. Appearance of the nanoplasmonic membranes before/after food spoilage monitoring. C. TEM micrographs, from left to right: control, fish spoilage and meat spoilage. D. Size distribution of the AgNPs embedded in the nanopaper before/after food spoilage monitoring, the box plots show the median, 25th and 75th percentiles and the extreme values of the respective size distributions (5–95 percentile). ... 48 Figure 4-5. Raman signature of the explored materials: bare bacterial cellulose (BC), bacterial
cellulose decorated with silver nanoparticles (AgNP-BC) and AgNP-BC exposed to ammonia and fish/meat spoilage. ... 50 Figure 5-1. AuNP-BCs characterization by (A) their color appearance (from right to left, high,
medium and low-density AuNP-BC and bare BC) and, (B) UV-Vis absorbance spectra of AuNP-BC synthesized with different densities of AuNPs. Also, the emission spectra of FSS (exited at 460 nm) and QD (exited at 350 nm) are illustrated for more comparison. ... 66 Figure 5-2. Scanning electron microscopy of AuNP-BC with high density (A and A’), medium
density (B and B’), low density (C and C’), and bare BC (D). ... 67 Figure 5-3. Transmission electron microscopy (TEM) of AuNPs dissociated from the high density
(A) and medium density (B) of AuNP-BC platforms and their respective size distribution histograms (A’ and B’). ... 68 Figure 5-4. Evaluation of FSS quenching efficiency cast on nanopaper-based platform of AuNPs
Figure 5-5. Distribution of the evaluated FSS quenching efficiency regarding to AuNP-BCs densities over different concentrations of FSS. ... 70 Figure 5-6. A comparison between FSS fluorescent intensity cast on the surface of nitrocellulose
and BC. The graph insight is just a magnification of the last two concentrations. The measured fluorescent intensities were the result of applying 5 µl of FSS with different concentration on the surface of BC or nitrocellulose. ... 70 Figure 6-1. Characterization of the obtained AuNP-CBC, (A) scanning electron microscope (SEM)
imaging from AuNP-CBC, (B) UV-Vis absorbance spectra of as-synthesized AuNP-CBC along with its overlap with emission spectra of QD (excited at 350 nm). ... 85 Figure 6-2. The optical density recorded at 460 nm as a result of the enzymatic reaction of HRP
and TMB. It presents the situation of the protein A/G immobilized on the surface of CBC by the interaction between the amounts of HAb linked to protein A/G as well as captured HRP. (A) the effect of pH on the immobilization of protein A/G and, (B) the effect of the initial amount of protein A/G on its immobilization. ... 87 Figure 6-3. (A) Estimated optical density of HRP response attached to HAb and HAb-QD which
are linked to protein A/G in two different platforms, AuNP-CBC and bare CBC. (B) Quenching efficiency evaluated by the capture of HRP to HAb-QD which is linked to protein A/G on the surface of AuNP-CBC. ... 88 Figure 6-4. Performance of proposed immunosensor presented by (A) the quenching efficiency of
QD corresponding to the concertation of E. coli (orange bars) and control bacteria S. aureus (blue bars) and (B) the change in fluorescent intensity QD after its response to E. coli detection. ... 90
Figure S4-1. TEM micrographs showing the population density of AgNPs embedded in BC without NH3 vapor exposure (A-C) and after NH3 vapor exposure (D-F). The population density of AgNPs at the foreground in images A-C has been estimated to be 1473 ± 227 AgNP µm-2, whereas the population density of AgNPs at the foreground in images D-F is around 302 ± 38 AgNP µm-2. AgNP-BC in images D-F was exposed at an initial vapor rate of around ~1.2 µg s-1 for 12 hours. TEM micrographs were analyzed via image processing through ImageJ 1.48v
(Wayne Rasband, National Institutes of Health, Bethesda, MD) in order to estimate the population density of nanoparticles embedded in the BC-based composite. 56 Figure S4-2. SEM micrographs of AgNP-BC without NH3 vapor exposure (A) and after NH3
vapor exposure (B). No damage or structural changes were observed in the nanofibers. 57 Figure S4-3. Calibration curves displaying changes in optical density depending on the initial
evaporation rate and the exposure time. The error bars represent the standard deviation of
three parallel experiments. 57
Figure S6-1. (A) TEM image of QD which was conjugated to antibody and (B) The size distribution of QD obtained by analyzing the diameter of 200 individual QD particles. 98
LIST OF ABBREVIATIONS
2D Two-dimensional
3D Three-dimensional
Ab Antibody
AgNP Silver nanoparticle AuNP Gold nanoparticle BC Bacterial Cellulose BNC Bacterial Nanocellulose
CBZ Carbamazepine
CBC Carboxylated Bacterial Cellulose
BSA Bovine Serum Albumin
CNC Cellulose Nanocrystal CNF Cellulose Nanofibers CNP Carbon Nanoparticle
E. coli Escherichia coli
EDC 1-Ethyl-3-(3-dimethylaminopropyl)carbodiimide FE-SEM Field Emission Scanning Electron Microscopy FITC Fluorescein-5-Isothiocyanate
FSS Fluorescein Salin Salt
FRET Fluorescence Resonance Energy Transfer
GO Graphene Oxide
HRP Horseradish Peroxidase LOD Limit of Detection
LSPR Localized Surface Plasmon Resonance MES 2-(N-Morpholino) ethanesulfonic acid
NC Nanocellulose NCC Nanocrystalline Cellulose NF Nanofibers NFC Nanofibrillated Cellulose NP Nanoparticle NHS N-hydroxysuccinimide
PAGE-gel Polyacrylamide gel electrophoresis PBS Phosphate-Buffered Saline
PET Polyethyleneterephthalate
PEI Poly(ethylenimine)
Phe Phenylalanine
P. aeruginosa Pseudomonas aeruginosa
QD Quantum Dot
SDS Sodium Dodecyl Sulfate
SERS Surface Enhanced Raman Scattering S-NHS N-hydroxysulfosuccinimide
S. aureus Staphylococcus aureus
T-paper Transparent nanopaper
Trp Tryptophan
Tyr Tyrosine
TEMPO 2,2,6,6-tetramethylpiperidine-1-oxyl UCNP Up-Conversion Nanoparticle
CHAPTER 1
INTRODUCTION
Food has always been regarded as the primary source of energy for mankind that may be served in a variety of recipes either raw or cooked. Although our ancestors were used to provide their needs locally, developments and enhancements of transport systems, as well as improvements in food packaging, has made it much easier to conserve food varieties from all over the world.
However, storage and shelf conditions serve as effective parameters for controlling the freshness and safety of foods, but it cannot be guaranteed that food is free of contaminations such as foodborne pathogens or spoilage microorganism. As such, food quality control is necessary not only to protect customers against foodborne illness but also to minimize wasting food resulting from microbial spoilage [1, 2].
Despite all precautions and preservations used, the outbreak of foodborne diseases has remained a remarkable threat to public health and safety which has significantly increased over the last two decades [3]. For instance, the Centers for Disease Control and Prevention (CDC) has estimated that every year 48 million people in the United States alone are infected by foodborne pathogens, leading to approximately 128,000 hospitalizations and 3000 deaths [3, 4].
Generally, an outbreak of foodborne diseases results from the consumption of food contaminated with pathogens. Among the different types of foodborne pathogens, bacteria such as Listeria
monocytogenes, Escherichia coli O157:H7, Staphylococcus aureus, Salmonella enterica and Bacillus cereus remain the most common [5, 6].
Due to very low infection dose of pathogenic bacteria (10-1000 bacterial cells), their ability to multiply rapidly and their high resistance to antibiotics, recall and disposal of contaminated food products are considered as an essential step in keeping consumers safe. Therefore, rapid, precise and early recognition of contaminated food has been argued as the most important priority in the public health domain [7].
Conventional methods for foodborne pathogens detection are practically carried out by culturing microorganisms in agar plates followed by a chemical-biochemical analysis. Despite their high accuracy and reliability, their application has been limited because they are time-consuming, dependent on technician and equipment and are not flexible for on-site diagnosis [7].
Recent development in material science and nanotechnology has successfully promoted the recognition tools and bioassays. Nanomaterials with a diameter of 1-100 nm, owing to phenomenal physical and chemical properties such as high surface area, capacity to carry functional groups, and flexibility to conjugate to biomolecules, are currently of great interest to researchers [8-11]. For example, integration of biomolecules (such as antibodies, aptamers, enzymes, etc.) with nanoparticles (such as quantum dots, gold nanoparticles and, graphene, etc.) has facilitated the improvement of analytical devices called sensors or biosensors. These sensors offer several advantages such as sensitivity, selectivity, rapid detection, and accuracy as well as in-situ and real-time detection. Besides, their cost-efficiency, miniaturized design, and unnecessary sample preparation have made them an attractive alternative to incorporate into food packaging [7, 12]. Thus, the main objective of this research is to develop and fabricate a biosensor to detect bacteria, directly through the whole cell or indirectly through its by-products, which is portable, easy-to-use, and can be easily integrated into food packaging materials.
The first part of the work is a proof-of-concept investigation, proving the potential of bacterial cellulose with nanofibrils structure impregnated with plasmonic nanoparticles to detect volatile organic compounds. The second part of this work investigates the improvement of a solid-based platform to address the demands for the design of biosensors for fluorescent-based methods. Therefore, we explored the properties of bacterial cellulose embedded with gold nanoparticles as a plasmonic nanopaper which has the ability to absorb the energy transfer from photoexcited fluorescent material. The obtained results lead to a new assembly of biomolecules relying on the fluorescent-based technique for direct detection of bacteria, which was the subject of the third part of this research. It consists in the proof-of-concept of a novel biosensor which was developed on solid-surface using FRET method.
This dissertation involves eight chapters and is arranged according to the main objective and three scientific articles, one published and two submitted.
• Chapter 1: Introduction
• Chapter 2: Literature review
• Chapter 3: Explanation of the main objective as well as specific objectives of this research, and arrangement of the articles
• Chapter 7: Presentation of general discussion with respect to the reported articles
• Chapter 8: Conclusion of this work along with the summary, the originality, and suggested recommendations for future works.
CHAPTER 2
LITERATURE REVIEW
What are biosensors and their properties? Why are they needed? What are the strategies in fabricating biosensors? What are the roles of nanoparticles and biomolecules in developing a high efficient biosensor? How will it be possible to improve biosensor for smart packaging? This chapter seeks evidence and information from the published scientific reports to answer these questions along with others.
2.1 Sensor
The biosensor is a novel technology widely utilized in the fields such as food safety, medical, process control and biosecurity. Typically, the biosensor evolves two main parts: a receptor and a transducer. The receptor (biorecognition element), known as the heart of any biosensor, is a functionalized platform can specifically capture and recognize the analyte of interest. Due to the interaction between the analyte and biorecognition element, a physical or chemical change is produced which is translated to a measurable signal by the transducer [13]. Regarding the applied approach as a transducer, sometimes an additional device is necessary to modify or amplify the generated signal to a detectable one. Therefore, the measured signal is directly corresponded to the concentration of an analyte, allowing the real-time quantitative and qualitative measurement. Figure 2-1A represents the two main parts of a biosensor and their integration.
Usually, biosensors are classified with respect to the transducer approaches such as optical, electrochemical and mass sensitive. The Figure 2-1B shows the most popular reported biosensor in the field of pathogen detection.
Figure 2-1. (A) a schematic of the integration of a biosensor [7], (B) a popularity of the applied transducers for the pathogen detection [13].
The biosensor will be ideal when it exhibits high selectivity and sensitivity to the specific target analyte. Selectivity is the ability of biosensor to distinguish different substances and not be affected by the presence of other interfering substances. While sensitivity refers to the sensing ability in the range of sub-milligram and lower. The efficiency of these parameters will be defined by the type of receptor, applied transducer and the design integrity.
2.1.1 Receptor
The main receptors which have been exploited for the fabrication of biosensors are antibodies, aptamers, nucleic acids, and bacteriophages [14]. Besides the biomolecule, the use of a specific carbohydrate has been reported for detection of pathogens such as E. coli [15]. The parameters such as stability, ease of immobilization and conjugation to biosensor platform, high affinity in interacting with the specific analyte and low reactivity with interfering contamination are taken into account for the selection of an appropriate bioreceptor that can significantly influence the efficiency and quality of the biosensor. Among them, antibodies are of great interest to researchers as a biorecognition element, explored in the configuration of the various biosensors, especially those used for pathogen detection. The section below clarifies antibodies and their importance in the biosensor fabrication.
2.1.1.1 Antibody
Antibodies (immunoglobulin) have been widely investigated in the development of biosensors as promising receptors for detection of an analyte. The biosensors integrated to antibodies are usually
called as immunosensors [16]. Antibodies, found as monoclonal, polyclonal or recombinant, are discriminated by their affinity of attachment to the analyte. Antibodies are known as a biopolymer composed of different blocks of amino acids that their sequence and composition have shaped a three-dimensional structure. Depending on the type of the antibody, it may possess a different molecular weight, for instance, the abundant type of antibody (immunoglobulin G, IgG) has a molecular weight around 150 kD and approximated dimensions of 14×10×5 nm [16]. Figure 2-2 exhibits a classical schematic of IgG with the different blocks of amino acids chains.
Figure 2-2. The schematic of the IgG structure and its differentiation to the various blocks of amino acids. The dark and light blue chains represent the heavy (H) and light (L) chains of an antibody, respectively. Each one is composed of the variable (V) and constant (C) region [17].
This Y-shape structure of the antibody is due to two parts: 1) two variable fragments, F(ab), contains the binding region to the antigen and 2) the constant region, Fc, is the tail which determines the orientation of the antibody. According to this specific structure, the immobilized antibody will be desirable when it is located on the surface of the substrate through its Fc in an oriented-shape and, as a result, the specific binding regions are free for attachments [17]. So, this “end-on” configuration has a maximum affinity to bind with antigen. While its efficiency can be remarkably reduced by random immobilization referred as “head-on”, “side-on” and “lying-on” [18]. As illustrated in Figure 2-3, in the random immobilization one or both active regions may link to the substrate which would cause their blockage and preventing the interaction with the antigen.
Figure 2-3. The probabilities of an antibody positions after immobilization on the surface of a substrate [18]
The exploited immobilization strategies would thoroughly justify the position of antibodies on the surface of the respective solid substrate [19, 20]. Various functional groups on the surface of antibody derived from amino acids blocks may be targeted for the crosslinking and immobilization strategies [21]. The most applied strategies are covalent binding and affinity immobilization techniques, subjected in detail in the next session.
To develop an immunosensor, antibodies are immobilized on the surface of a transducer which can specify the antibody-antigen binding. Consequently, the binding event is measured and revealed by either the changes in electron charge via impedance measurement or a change in the optical properties of the substrate. The bioassays using the antibody as biorecognition element are very selective, sensitive and robust enough to detect the antigen.
2.1.1.1.1 Antibody immobilization
Functional groups of the antibody are the main targets of its attachment to the chemically engineered surface. Covalent binding can significantly improve the density and reliability of attached antibody and provide a more robust immunosensor. On the other hand, the covalent bond provides a strong immobilization of antibody to the functionalized surface, highly efficient. Various chemistries have been applied for achieving a high-throughout attachment which totally corresponds to the functionality of the surface and the target group on the antibody. Commonly employed groups of the antibody are amine, carboxyl, thiol and carbohydrate moieties [19, 21]. Amine and carboxyl groups are abundantly available on the surface of the antibody. Reactive amino groups are a primary amine side chain, generally derived from amino acid like lysine while
carboxyl groups are mostly derived from amino acids such as glutamate and aspartate [22]. Owing to the widespread presence of these groups especially lysine all over the structure of an antibody, it is difficult to define and justify the immobilization; nevertheless, it remains as the favorite functional group. The common chemistry for amine and carboxyl coupling (between a substrate and protein) is carbodiimide reaction that uses EDC associated with succinimidyl esters, e.g., NHS or S-NHS, as shown in Figure 2-4. This chemistry known as EDC/NHS binding causes the formation of a robust amide bond [20]. This covalent attachment method has been widely applied for immobilization of protein as well as preparation and activation of a surface. By adjusting the conditions of the experiment, researchers have improved the efficiency of attachments through this method. For example, Parolo and coworkers could improve the immobilization of the antibody to the surface of carboxylated gold nanoparticles by simply adjusting the pH of reaction [23]. The activated carboxyl groups of gold nanoparticles by EDC/NHS chemistry were conjugated to antibodies in pH 5 that resulted in a greater contribution of the Lys groups. This strategy prevented the amine groups at the active sites of antibody to be conjugated to AuNP. Therefore, the final platforms demonstrated more sensitivity for capturing the antigen. Likewise, Sun and co-workers have employed a novel approach for oriented immobilization of an antibody through carbodiimide chemistry by controlling the electric field. In their work, the Fc region of the antibody was activated through EDC/NHS, coupled to the self-assembled monolayer of cysteine with amino groups. By inducing an appropriate electric field and adjusting pH, antibodies were immobilized orientally through their native charge [24].
Other active groups in the antibody are disulfide bonds derived from cysteine that are responsible for the 3D structure of an antibody, such as disulfide bonds in the Hinge-region. By reducing this bond with chemical agents such as dithiothreitol (DTT) and 2-mercaptoethylamine (2-MEA), a free thiol bond can be created on the antibodies [26, 27]. Crosslinkers that involve maleimide or iodoacetyl groups are the most efficient for sulfhydryl-directed conjugation. As an example, the thiol groups on the antibody were conjugated to the amine group of a solid surface with Succinimidyl-4-(N-maleimidomethyl) cyclohexane-1-carboxylate (SMCC) containing NHS-ester and maleimide reactive groups [26]. Although the thiol groups (sulfhydryl groups) can directly immobilize on the surface of gold [27], their creation is followed by the pretreatments of antibody. Thus, it causes the fragmentation of the antibody that may influence their active sites [27]. Besides, carbohydrates located in the Fc region of antibodies is another reactive group which can contribute to immobilization. However, these groups are not reactive in their native state, and oxidization treatment is necessary for converting into active aldehydes (–CHO) for coupling [26]. Although this group allows a desired immobilization of antibodies in an oriented shape, the harsh oxidation may affect the other available amino acids in the antibody [28].
Although covalent immobilization can provide a highly stable conjugation, it may lead to randomly oriented placements of an antibody blocking its active sites, necessary for capturing bacteria. It is reported that this approach decreased the capacity of capturing 2-3 fold in compared with the well-oriented antibodies [29].
Another alternative that provides an oriented immobilization of antibodies, free from any chemical reaction, is affinity binding. Remarkably, this method has promoted the immobilization strategies and been widely employed in the biosensor development. The most commonly applied method is to use Protein A, Protein G or recombinant Protein A/G that can bind particularly with the Fc region of the antibody. It allows immobilizing an antibody through a tail-on position that keeps the two active sites free for capturing the antigen. The Protein A and G have two and five binding domains respectively while the protein A/G has the ability of both [18, 28, 30-34]. Extensive studies have investigated the immobilization of these Proteins on various functionalized surfaces by using different experimental conditions. Several researchers had proved the improvement in biosensor performance when it was compared with randomly immobilized antibodies [35-37].
2.2 Transducer
Several types of transducers have been studied for a high-throughout design of biosensors, such as electrochemical, optical and piezoelectric. As illustrated in Figure 2-1Bs, optical and electrochemical biosensors are the most popular approaches for developing of a promising biosensor due to ease of use, rapid, low-cost and portable detection.
2.2.1 Electrochemical sensor
Electrochemical biosensors are also classified as the most widespread recognition tools because of their low-cost, simple operation and multiplex sensing in a chip-like device [8]. This bioassay mainly relies on the measurement of changes in current or potential once the interaction between analyte and sensor occurs. In respect to the measured parameter, the technique of sensing can be identified differently such as current (amperometric), the potential (potentiometric) or impedance (impedimetric) [13].
2.2.2 Optical sensor
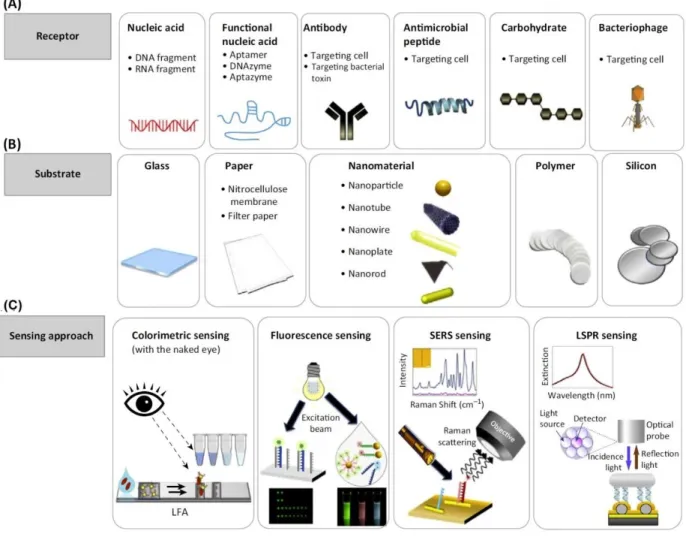
The optical biosensors referring to those use the light (electromagnetic radiation) for the detection technique. Surface plasmon resonance (SPR), surface-enhanced Raman scattering (SERS), fluorescent and colorimetric methods are among the most popular optical sensing technologies [38]. The optical sensing allows a direct visual detection of the analyte whose advantage can surpass other methods [38]. Although for quantitative and precise recognition, the optical signal measurement provides more information, the visual detection would be possible through this approach. Figure 2-5 represents an overview of optical sensors integrated with different parts. Despite the electrochemical sensors, the optical sensors don’t need a conductive substrate, so it makes them an attractive and simple method for detection of vapor or gases in the headspace of food packages. The focus of this dissertation is mainly dedicated to fluorescent-based technique and colorimetric detection as will be explained in the next sessions.
Figure 2-5. A schematic of optical sensing along with the representative components and techniques applied to a biosensor for the detection of pathogen: (A) various types of receptors, (B) the established substrates and (D) the sensing approaches [38].
2.2.2.1 Fluorescent-based detection
There has been a remarkable involvement of fluorescent materials in the design of biosensors as it has proven to be a versatile tool for a myriad of applications. Since the fluorescence technique is a non-invasive sensing technology, the biomolecules are not influenced or damaged during measurements or toxified by hazardous by-products. The fluorescent-based approaches can be measured by either the alteration in their fluorescent intensity or decay time while the last one is mostly used for in-vivo investigations [39, 40].
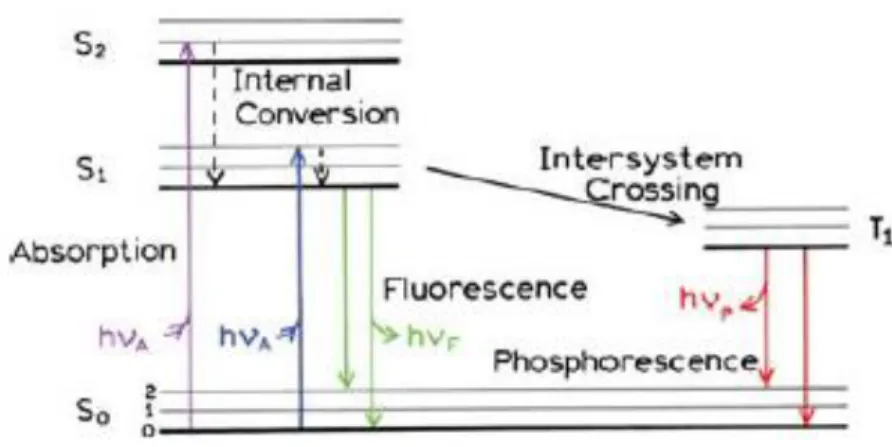
Fluorescent emission is followed by the absorption of light with enough energy. As a result, the fluorophore can be excited and proceeded with several phenomena. As illustrated in the Jablonski
diagram in Figure 2-6, the electronic states of fluorophore molecules can be divided into the singlet states and triplet states. In excited singlet states, all the electrons in the molecule orbits are spin paired. The electronic state of singlet ground, first, second is indicated by S0, S1, and S2, respectively. The transition between states is drawn as vertical lines to illustrate the instantaneous nature of light absorption. During the first absorption step, the molecule is excited from the ground to some higher vibrational level of either S1 or S2 (singlet). It then tends to release the excess of energy by fast relaxation to lower electronic states. This may be done through two possible ways, 1) a non-radiative method called the internal conversion (IC) process, which occurs within 10-12 s that generally completes prior to emission, 2) a radiative way by emitting light, i.e., a fluorescence process with lifetime about 10-8 s [39, 40]. When a molecule possesses a heavy atom, the emission of light from triplet excited states results in Phosphorescence in which the electron in the excited orbital has the same spin orientation as the ground-state electron [39, 40].
By returning the electron to the original ground state, a photon with lower energy will emit. On the other hand, the observed emission wavelength is usually longer than the absorbed light wavelength due to an energy cap, known as Stoke’s shift. This energy cap should be large enough to prevent the interference of emission and absorbance spectra of fluorescent substances [39]
Figure 2-6. An illustration of Jablonski diagram which shows the fluorescent mechanism [39]. Various fluorophores with distinctive structures and features have been used in bioassay tools. They are mainly categorized as intrinsic or natural fluorophores and extrinsic fluorophores. Intrinsic fluorophores show natural fluorescent properties. The most dominant types are the proteins composed of aromatic amino acids groups such as tryptophan (Trp), tyrosine (Tyr) and phenylalanine (Phe). They absorb light near 280 nm with and emit spectra around 350 nm. Thus,
the presence of protein with these amino acids residues in the bacteria causes autofluorescence of bacteria [41]. Consequently, this phenomenon has been considered as a suitable method for rapid detection, identification, and differentiation of the various bacteria, including foodborne pathogenic bacteria [42, 43]. Through fluorescent spectroscopy the limit of detection for E. coli,
Salmonella and Campylobacter were estimated 103 cells/mL [42]. Given the advantages, such as direct detection, low cost, sensitivity and time-saving, this method shows a high potential for rapid bacteria detection.
Extrinsic fluorophores are those linked to the other molecule (with or without spectral properties) to provide fluorescence. The extrinsic fluorophores can conjugate to sample via covalent or non-covalent bonding and are available in the various types of dyes, crystal quantum dots (made from heavy metal or carbon) and green fluorescent proteins [44].
The quantum yield (Q) and the lifetime of fluorescence are the most important features of fluorophores. The quantum yield is defined by the ratio of emitted photons from fluorescence to the absorbed photons. When the fluorophore has the larger quantum yields, it shows brighter photoluminescence. The lifetime is the average time that the fluorophore stays in the excited state before relaxing and returning to ground state. It determines the time that is available for the fluorophore to interact with its environment. Also, fluorescence lifetime indicates the time it takes for 69% of the population to emit. Typical fluorescence lifetime is around 10 ns [39].
The fluorescent intensity of a fluorophore can be reduced through various mechanisms which are known as quenching. One possible way is the deactivated of the excited state fluorophore by a contact with another molecule especially in solution, that is called collisional quenching. Also, quenching can occur at the ground state due to the formation of nonfluorescent complexes composed of a quencher and fluorophores [39].
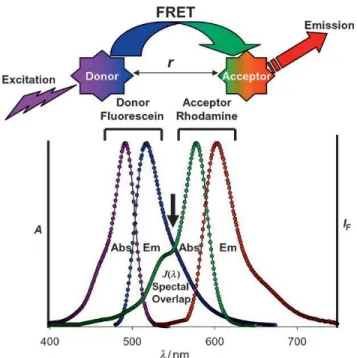
2.2.2.1.1 Fluorescent resonance energy transfer
Besides, the autofluorescent molecules and direct detection of the molecule by fluorophores, some fluorescence-based bioassays employ Förster (fluorescence) resonance energy transfer (FRET). This mechanism is a non-radiative energy transfer from the initially photoexcited fluorophores (donors) to an acceptor molecule which can absorb the energy transfer. This phenomenon causes a reduction in the fluorescent intensity of the donor or even its quenching while the fluorescent intensity of acceptor increases if it is another fluorophore. The energy transfer would effectively
occur when the emission spectrum of a donor has maximum overlap with the absorbance spectra of the acceptor molecule. Moreover, the donor and acceptor molecules should be located close enough together, approximately between 10–100Å [45, 46].
Figure 2-7 shows a schematic of FRET phenomena and interaction between a donor and acceptor.
Figure 2-7. A schematic of FRET process and the overlap between the absorbance spectra of acceptor and emission spectra of donor [47].
The efficiency of the energy transfer is defined as the ratio of the photons absorbed by the donor to the parts that are transferred to the acceptor [48]. FRET efficiency for a single donor and acceptor pair in the defined distance is estimated by the following equation
𝐸 = 𝑅0
6
𝑅06+ 𝑟6
Whereas r is the distance between the donor and acceptor. 𝑅0 is Fӧrster distance where the FRET efficiency is 50% and it depends on donor-acceptor characteristics as illustrated in Figure 2-8.
Figure 2-8. Demonstrating the dependence of FRET efficiency on the distance between donor and acceptor [48].
As the size of biomolecules is comparable with the Fӧrster distance, FRET has widely used to measure the nanometer scale changes in the biomolecules either in-vitro or in-vivo. On the other hand, it has been introduced as a powerful technique to measure the distance changes between specific sites on macromolecules upon their conformational changes or moving domains in the proteins [39, 49].
Varieties of materials have been explored to develop high-efficient FRET structures. Generally, they can be classified into different categories: organic materials such as traditional dye fluorophores, dark quencher, and polymers; inorganic materials such as metal or semiconductor nanoparticles and fluorophores originated from biological components such as fluorescent proteins or amino acids [47]. According to the experimental design, these materials may serve as an acceptor or a donor or even both since a selected pair is compatible with FRET criteria.
Owing to the unique optical properties of semiconductor QDs and gold nanoparticles, these are a promising FRET pair according to their interaction [23, 50-56]. As such, their application in FRET-based bioassays has been extensively studied and are still the main focus of many researchers. The following parts will explain their properties and the proposed applications in bioassay systems.
2.3 Quantum Dots
2.3.1 Quantum dots properties
Quantum dots (QDs) are semiconductor nanocrystals composed of elements of groups II-VI, III-V and IV-VI of the periodic table. Typically, they have spherical or approximately ellipsoidal shape with a range size of 1-10 nm. Their optical and electronics features have made them distinctive over the usual fluorescent dyes. Those remarkable characters are: size-tuned and narrow emission spectra, broad absorbance spectrum, photostability, high resistance to photobleaching and chemical degradation as well as their high quantum yield in comparison with fluorescent dyes [44, 57, 58]. Figure 2-9 exhibits a schematic of core/shell quantum dot and the dependency of color and emission spectra of QD on the size of the nanocrystal.
Figure 2-9. (A) a schematic and TEM image of a quantum dot composed of CdSe/ZnS core/shell, (B) the change in the emission spectra and color of CdSe/ZnS with increasing the nanocrystal size [57].
The most popular ones have the core of CdSe and CdTe which may cover with an inorganic shell layer such as ZnS to improve not only their luminescence properties but also protect them from oxidation. Due to the use of insoluble salts in the synthesis of QDs, they are usually insoluble in water. So, the decorated QDs with various types of biofunctional groups have improved their solubility and facilitated their conjugation to the desired biomolecules [58, 59]. Given these properties, QDs remain favorite candidate applied as biomarkers and the development of FRET-based bioassays.
2.3.2 Quantum dot applications in bioassay
The application of a quantum dot as the biomarker for monitoring foodborne pathogens such as
Salmonella Typhimurium [60], E. coli [61, 62] and Listeria monocytogenes [63] or their toxin [64]
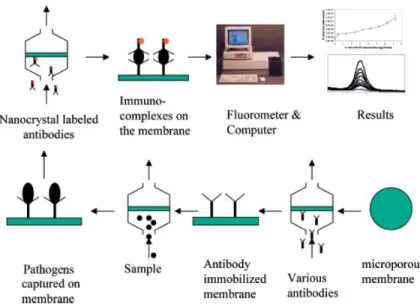
has been widely investigated. Mainly, the pathogen is detected through forming a sandwich model which is established between the QD conjugated antibody/ pathogen/ and a secondary antibody conjugated to magnetic nanoparticles or immobilized on the surface of a membrane, as illustrated in Figure 2-10. The obtained fluorescent intensity of the separated and collected sandwich model corresponds linearly to the concentration of pathogen.
Figure 2-10. An illustration of the detection of bacteria through establishing a sandwich model. [62].
Aside from that, QDs have been assessed as a donor in various configurations for the development of FRET-based bioassays for the recognition of bacteria. For instance, in the proposed design by
Morales et al., the whole cell of E. coli was detected by energy transfer from the QD to graphene oxide (GO) acting as the acceptor [65]. This approach was introduced as “on and off state” method. In this case, the GO was added to the platform after capturing the bacteria using QD conjugated antibodies. In the presence of bacteria, the system was “on-state” because the distance between GO and QD was large enough to prevent the energy transfer. While in the absence of bacteria the system was “off-state” resulted from the interaction of GO through π-π stacking with the antibody, followed by the FRET occurrence and quenching of QD. Moreover, Duan and coworkers developed a simultaneous detection of two pathogenic bacteria, Vibrio parahaemolyticus and Salmonella typhimurium, by using green and red emitting QDs conjugated to their respective aptamers [66]. Their developed method relied on the competitive affinity binding between aptamer-carbon nanoparticles and aptamer-analyte. While the QDs didn’t fluoresce in the presence of carbon nanoparticles as the result of affinity binding, their fluorescent light detected upon the addition of the target analyte. It was due to the attachment of QDs-aptamer to the target followed by dissociating from the carbon nanoparticles.
Moreover, QD acting as a donor may quench another QD of different size. Wang and coworkers have developed a FRET-based immunosensor for the detection of Salmonella Enteritidis on an eggshell by a pair of QDs with two different emitting photoluminescence [67]. The green and orange emitting QD were conjugated to anti-S. Enteritidis produced in rabbit and anti-rabbit antibody produced in goat. Similar to the previously described FRET, in the absence of bacteria, the antibodies were linked together through their affinity binding which allowed an efficient energy transfer from the green emitting QD (donor) to the orange one (acceptor). In the presence of bacteria (S. Enteritidis), the green QD conjugated anti-S. Enteritidis was attached to bacteria due to its higher affinity and the increase in the photoluminescence of the green QD which successfully revealed the pathogen. FRET-based immunosensor have shown a high sensitivity to detect the analyte of interest.
2.4 Noble metal nanoparticles in bioassay
Noble metal nanoparticles especially gold and silver nanoparticles have been widely explored in the development of optical bioassay owing to the unique optical properties, biocompatibility, ease of modification and conjugation to a biomolecule, size-tunable synthesis and high surface ratio [56]. The optical properties of these nanoparticles strongly rely on the localized surface plasmon
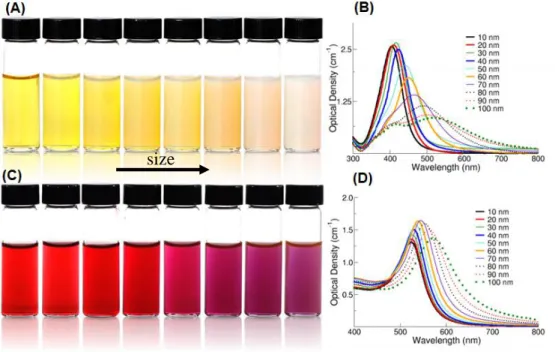
resonance (LSPR), which is resulted by the collective oscillation of their conductive electrons when they are excited by electromagnetic wavelength larger than the metal nanostructure [68, 69]. The LSPR spectral position is extremely dependent on the particles size, the distance between the particles, dimension and also the reflective index of surrounding the environment [70]. As the primary consequence of LSPR feature, the nanoparticles have the potential to scatter and absorb light at a specific wavelength [71], which is the main reason of their use as the plasmonic nanoparticles for sensitive transducers. When nanoparticles undergo an alteration as the result of a change in one of the mentioned parameters, it would be revealed in their absorption band and plasmonic peak. Consequently, the accurate measurement of these changes would be directly recorded by UV-Vis spectroscopy. Figure 2-11 exhibits the dependency of absorbance spectrum and color of monodispersed silver and gold nanoparticles on the change of their size.
Figure 2-11. Colors change of various sized monodispersed (A) silver nanoparticles and (C) gold nanoparticles. (B) and (D) graphs show the respective UV-Vis spectra of dispersed silver and gold nanoparticles, respectively [72].
Additionally, LSPR enables metal nanoparticles to quench the photoexcited fluorophores which have a spectral overlap with them. Given to this feature, they are known as strong quenchers used in the FRET technique. Among the noble metal nanoparticles, gold nanostructures have drawn more attention due to the chemical stability and no-toxicity. Although silver nanoparticles show a
![Figure 2-3. The probabilities of an antibody positions after immobilization on the surface of a substrate [18]](https://thumb-eu.123doks.com/thumbv2/123doknet/2332833.32110/31.918.242.657.107.326/figure-probabilities-antibody-positions-immobilization-surface-substrate.webp)
![Figure 2-4. The illustration of EDC/S-NHS chemistry [25].](https://thumb-eu.123doks.com/thumbv2/123doknet/2332833.32110/32.918.126.787.747.971/figure-illustration-edc-s-nhs-chemistry.webp)
![Figure 2-8. Demonstrating the dependence of FRET efficiency on the distance between donor and acceptor [48]](https://thumb-eu.123doks.com/thumbv2/123doknet/2332833.32110/39.918.292.623.103.370/figure-demonstrating-dependence-fret-efficiency-distance-donor-acceptor.webp)
![Figure 2-13. A schematic of the chemical structure of cellulose and effect of hydrogen bonds on its formation [98]](https://thumb-eu.123doks.com/thumbv2/123doknet/2332833.32110/48.918.142.781.106.392/figure-schematic-chemical-structure-cellulose-effect-hydrogen-formation.webp)
![Figure 2-14. The presented figures show the differences in the structure of various nanocelluloses [101]](https://thumb-eu.123doks.com/thumbv2/123doknet/2332833.32110/49.918.182.735.177.846/figure-presented-figures-differences-structure-various-nanocelluloses.webp)
