HAL Id: hal-01008286
https://hal.archives-ouvertes.fr/hal-01008286
Submitted on 22 Nov 2018HAL is a multi-disciplinary open access archive for the deposit and dissemination of sci-entific research documents, whether they are pub-lished or not. The documents may come from teaching and research institutions in France or abroad, or from public or private research centers.
L’archive ouverte pluridisciplinaire HAL, est destinée au dépôt et à la diffusion de documents scientifiques de niveau recherche, publiés ou non, émanant des établissements d’enseignement et de recherche français ou étrangers, des laboratoires publics ou privés.
Image Processing based Damage Detection of Offshore
Infrastructural Elements using Texture Information
Michael O’Byrne, Bidisha Ghosh, Vikram Pakrashi, Franck Schoefs
To cite this version:
Michael O’Byrne, Bidisha Ghosh, Vikram Pakrashi, Franck Schoefs. Image Processing based Damage Detection of Offshore Infrastructural Elements using Texture Information. 5th European Conference on Structural Control (EACS 2012), Jun 2012, Gènes, Italy. �hal-01008286�
*
Corresponding author
Image Processing based Damage Detection of Offshore Infrastructural Elements
using Texture Information
Michael O'BYRNE, Bidisha GHOSH
Trinity College Dublin, Department of Civil, Structural and Environmental Engineering Dublin 1, Ireland
[email protected], [email protected]
Vikram PAKRASHI*
University College Cork, Department of Civil and Environmental Engineering College Road, Cork, Ireland
Franck SCHOEFS
LUNAM Université, Université de Nantes-Ecole Centrale de Nantes-CNRS, GeM, Institute for Research in Civil and Mechanical Engineering, UMR 6183 & IXEAD/CAPACITES Scociety, University of Nantes
2, rue de la Houssinière BP 92208 44322 Nantes Cedex 3, France. [email protected]
ABSTRACT
The current approach to Structural Health Monitoring (SHM) for offshore infrastructural elements is largely based on feedback provided by divers who may lack the desired level of inspection training, resulting in an undependable perspective of the damage present. There is thus a requirement for a robust, reliable and reproducible means for non-destructive testing. This paper presents a texture analysis based image segmentation using Support Vector Machine (SVM) classification for the purposes of detecting and classifying damaged regions on the surface of infrastructural elements. For the texture analysis stage, a Grey Level Co-occurrence Matrix (GLCM) was employed to calculate seven texture measures, namely; contrast, homogeneity, correlation, angular second moment (ASM), skewness, entropy and kurtosis. SVM was then used to classify regions as being either damaged or undamaged. As an example, the technique was applied to images of a corroding metallic surface in marine environment. Texture analysis is especially useful when regions of interest in an image are more distinguishable from the background based on their texture rather than pixel intensity. The effectiveness of this Non-Destructive Testing (NDT) technique is evaluated through the use of performance coordinates in the Receiver Operating Characteristic (ROC) space.
Keywords: Structural Health Monitoring, Damage Detection, Image Processing, Texture Analysis, Offshore Marine Structures, Grey Level Co-occurrence Matrix (GLCM), Support Vector Machines (SVM).
1 INTRODUCTION
Regular inspections of structures are vital to ensure their safety and operability. Currently, many structures are assessed using a regime of visual inspections. The levels of inspection cover a range of detail. It can be a cursory check, a principal inspection involving detailed examination of
all surfaces, or special inspections where the employment of invasive, semi-invasive and non-invasive tests may become necessary. Most inspection still depends on visual observations and the quality of data collected largely depends on the ability of the inspectors to observe and objectively record details of damage. Output from visual inspections can markedly vary and can have a lower level of accuracy and repeatability of detection compared to other inspection methods [1]. Furthermore, in the case of offshore structures, inspections are typically carried out by divers who may lack the desired level of inspection training and are unlikely to be an engineer. This has the potential to introduce additional sources of error. An image processing based detection approach not only acts as a relatively inexpensive tool to facilitate maintenance management, but also offers a far greater reproducible and measurable performance over visual inspection techniques. This approach allows for captured images to be archived for possible monitoring and assessment of degradation over time. Image processing based techniques have received a lot of attention in many other fields but have not been explored to their full potential for Structural Health Monitoring (SHM).
Image based analysis for SHM is a form of Non-destructive testing (NDT) that can provide useful information on the state of the structure, often keeping it in operation. This information can also be a part of an Infrastructure Management System (IMS). The output from an IMS can assist in determining the course of action the engineer or owner should take, as well as enabling informed decisions to be made when prioritising resources towards the correction of deficiencies. Furthermore, information acquired from NDT techniques increase understanding of defect initiation and propagation and provide a fundamental basis for both improving ageing laws for real structures, and for updating existing models to predict the behaviour of a particular structure and thus achieve a more reliable and suitable management strategy. This aspect has attracted a growing interest in recent years as the importance of life cycle optimisation and the related financial benefits continue to be recognised [2, 3] . The most suitable choice of NDT for a given application will largely depend on the damage to be detected and will require an in-depth knowledge of the advantages and limitations associated with each option. The measure of the on-site performance of a NDT tool is still an outstanding question in most cases [4]. Image processing based techniques in conjunction with powerful detection algorithms can be considered as an accessible, inexpensive, and easily deployable technique for visual inspection. The primary limitations are the lack of penetration below the surface of the material and the requirement of good visibility and lighting conditions. Previous image processing based methods have relied on colour information [5, 6], textural information [7], or a combination of the two [8] to segment and extract regions of interest in images.
Texture and colour based segmentation approaches are the primary modes of segmentation employed for image analysis. While both approaches have important applications in image processing methods, the colour based methods have been researched to a much greater extent. Texture may be considered as an innate property of surfaces. It may be qualified by terms such as fine, coarse, smooth, rippled, molled, irregular, or lineated [9]. Texture segmentation finds particular relevance in cases where the regions of interest are more separable from the background based on their texture than colour. This paper presents an enhanced texture based detection technique [5] involving Grey Level Co-occurrence Matrix (GLCM). GLCM is a well-established texture analysis method and offers a highly accurate approach for quantifying the perceived texture in an image. Support Vector Machines (SVM) are subsequently used to classify regions based on the statistics derived from the GLCM. While GLCM had been used previously in conjunction with SVM classification to classify woven fabrics [10, 11], the proposed algorithm incorporates a number of additional statistics which produces a feature vector that is well-rounded and offers a better described representation of the texture in the image.
Detection of corrosion on the surface of infrastructural elements in marine environment has been chosen as the illustrative application in this paper for several reasons. Firstly, offshore structures typically represent large initial investments and are exposed to harsh environmental conditions. This means that stakeholders are likely to place an increased emphasis on SHM in order
to maximise the structure's operational lifetime. Secondly, damage detection in itself is an important field of research and has significant financial and safety implications as demonstrated in a recent study. Thirdly, texture segmentation is especially relevant in cases where the regions of interest are more separable from the background based on their texture than colour. This scenario is encountered to a greater extent when considering underwater or near-surface infrastructural elements, where challenging lighting conditions and reflections introduce inherent chromatic and luminous complexities. These complexities tend to have a greater effect on colour based segmentation techniques where only pixel intensity values are considered rather than texture based segmentation techniques where it is the relationship between adjacent pixel intensity values that is considered [12].
2.0 Methodology
An image based damage detection algorithm has been proposed in this paper. The algorithm involves two steps; the first step is to develop a texture characteristics map of a colour image of a damaged surface using a GLCM approach. GLCM is primarily designed to work on greyscale images, however, it may be readily extended to colour images which consist of three channels by operating on each channel separately. The second step is classifying the damaged regions in the image using a SVM classifier. These two steps are discussed in detail in the following subsections.
2.1 Texture Characteristics Map
A texture characteristics feature vector {vf}a,b,c has to be generated for each pixel within the
original image, I, for each separate colour channel, c, where f indicates the index of the vector element, and a and b indicate the spatial coordinates of the pixel. Each element of {vf}a,b,c is
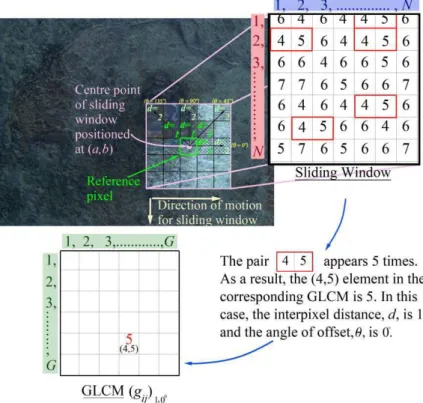
obtained by computing statistics derived from a GLCM. The process in which the GLCM is created is illustrated in Figure 1.
Figure 1- Overview of the GLCM process
The GLCM is a matrix of frequency values of paired combinations of pixel intensities as they appear in certain specific spatial arrangements within an image or sub-image. In this paper, the GLCM for each pixel is generated through a sub-image that is a sliding window, SW, centred on the
pixel. The centre is indicated as (a,b) and the size of the window (N-pixel x N-pixel) is optimised for best performance.
Each element, gij, of the GLCM corresponds to the number of occurrences of a paired grey
level combination where i denotes the grey level in the reference pixel, j denotes the grey level in the destination pixel; the GLCM is defined for a certain interpixel distance, d, and a certain angle of offset, θ between neighbouring pixels. The grey levels are defined using integer values between 1 and G. In this paper, the grey levels are defined on a scale of 1 – 12 (G =12) instead of a typical scale of 1 - 255. Quantizing in this manner allows computational parsimony and avoids sparse matrices.
Paired combinations of intensities of pixels that are spatially close together tend to be more relevant than combinations that involve spatially distant pixels. Accordingly, a value of 1 was chosen for d to ensure certain level of spatial proximity. The angle along which the interpixel distance was counted was defined as the angles of offset and the four angles for the offset that were chosen are, θ = 0°, θ = 45°, θ = 90°, θ = 135°. So, this generated a set of 4 GLCMs (d =1; θ = 0°, 45°, 90°, 135°) for each colour channel at each pixel in this paper.
The GLCM for each pixel is populated as:
( )
, , 1 1 1 if and where 0 otherwise d N N uv uv ij d u v w i w j g A A θ θ = = = = = = ∑ ∑
(1)where, wuv, is the pixel intensity expressed in quantised grey levels for the reference pixel located at
row u and column v within the sliding window; wuvd, θ
, is the pixel intensity expressed in quantised grey levels for the destination pixel located at an interpixel distance d along an angle θ from the reference pixel. The GLCMs are normalised as
( )
, , ( , ) ( 1) ij d d g p i j N N θ θ = − (2)There are seven texture features calculated from the GLCM, namely: Angular Second Moment (ASM), homogeneity, contrast, correlation, skewness, entropy, and kurtosis. They are defined as follows:
1. Angular Second Moment (ASM) represents the uniformity of distribution of grey level in the image.
{
}
2 1 , , 1 1 ( ) ( , ) G G f d d i j v = θ p i j θ = = =∑∑
(3)ASM ranges from 1/G2 to 1. A value of 1 indicates a constant image. 2. Homogeneity gives a measure of the similarity in the image.
2 , , 1 1
(
)
( , )
where
G G f d d i jv
= θn p i j
θn
i - j
= ==
∑ ∑
⋅
=
(4)3. Contrast is a measure of the local variations present in an image. If there is a high amount of variation the contrast will be high.
1 2 3 , , 0 1 1 ( f )d G G G ( , )d n i j v = θ − n p i j θ = = = =
∑
∑ ∑
(5)Contrast ranges from 0 to (G-1)2. A value of 0 indicates a constant image.
4. Correlation is a measure of image linearity. Correlation will be high if an image contains a considerable amount of linear structure.
, 1 2 4 , 1 1 1 2 ( ) ( , ) ( ) G G d f d i j ij p i j v θ θ
µ µ
σ σ
= = = − =∑ ∑
(6)whereµ ,1 µ ,2 σ1 and
σ
2are the means and standard deviations of the marginal probabilitymatrices, p1 and p2, obtained by summing the rows and columns of p(i,j)d,θ respectively. Correlation ranges from -1 to 1. A value of 1 indicates a perfectly positively correlated image. An undefined value is returned in the case of a constant image.
5. Entropy is a statistical measure of randomness.
5 , , 2 , 1 1 ( ) ( , ) log ( , ) G G f d d d i j v = θ p i j θ p i j θ = = = −
∑ ∑
(7) Entropy can range from 0 to infinity.6. Skewness is a measure of the asymmetry of the data around the sample mean. An estimate for the skewness is:
3 6 , 2 3 , 1 1 1 ( ) ( ( , ) ) ( 1) G G f d d i j v p i j m G θ
σ
θ = = = = − −∑ ∑
(8)where m and σ are the mean and standard deviation over G2 observations. Skewness ranges from 0 to (G-1)2. A value of 0 indicates a constant image.
7. Kurtosis is a measure of how outlier prone a distribution is. A positive value for kurtosis indicates that the distribution has a greater peakedness than that predicted by a normal distribution, while a negative value indicates that the distribution is less peaked than predicted by a normal distribution. An estimate for the kurtosis is given by:
4 7 , 2 4 , 1 1
1
(
)
( ( , )
)
3
(
1)
G G f d d i jv
p i j
m
G
θσ
θ = = ==
−
−
−
∑ ∑
(9)Kurtosis ranges from 0 to (G-1)2. A value of 0 indicates a constant image.
In certain cases undefined values may result for some statistics such as correlation, skewness and kurtosis when the intensity values in the window are perfectly uniform, i.e. when the standard deviation is equal zero. These undefined values are ignored by the SVM classifier.
Each texture measure in the feature vector is an average of the four texture measure values as calculated in the four GLCM matrices for each combination of d and θ.
( )
, 1 f f d d v v R θ θ = ∑∑
(10)where R is the number of all possible combinations of d and θ.
Some of texture features relate to certain texture characteristics in the image such as homogeneity or contrast. Other features describe aspects such as image complexity or the transition of pixel intensity values. However, in spite of each of the aforementioned features containing some degree of information about the texture characteristics of the image, it is difficult to establish which textural trait is represented by each feature.
2.2 Linear SVM Classification
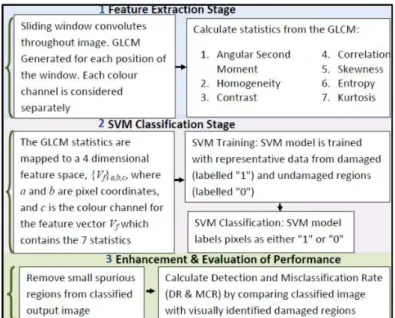
Support Vector Machines (SVM) are used to classify pixels as being either damaged or undamaged, based on the feature vector assigned to each pixel. SVM is a supervised learning classifier based on statistical learning theory. The linear SVM lies on both maximum margin hyper-plane and kernel function concepts. The later is selected for the computational challenge of products in high dimensional space [13-15]. The goal of SVM is to produce a model based on the training data which predicts the target values of the test data given only the test data attributes. In this case, the pixels are the test data while the feature vector corresponding to each pixel provides the test data attributes. The first stage in the classification process involves training in the data. Representative samples from damaged and undamaged regions in each image were selected and the texture features corresponding to these regions provided the basis for separation. Each pixel in the image was then classified based on the texture features corresponding to that pixel. A schematic of the methodology is presented in Figure 2.
3 EVALUATION OF TECHNIQUE
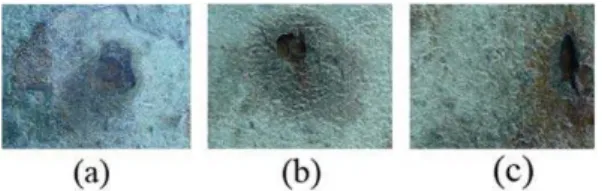
The proposed technique was performed on three images of pitting corrosion all taken from the same structure (Figure 3).
Figure 3 - Sample Images of Pitting Corrosion from the Same Structure
3. 1 Classification Enhancement
It is necessary to enhance the classification results following the SVM stage in order to remove small insignificant regions that are classified as damaged regions. With knowledge of the nature of the damage type, it is clear that these regions of negligible area are merely spurious artefacts as oppose to actual damaged regions so they may be removed by specifying that regions below a certain size are to be discarded. For illustrative purposes, the detected regions for Image (a) directly after the classification stage are shown in Figure 4 (a). A cleaner and more accurate image is presented in Figure 4 (b) which shows the smaller sections removed.
Figure 4 - (a) Detected Regions with smaller sections, (b) detected regions with smaller sections removed
3.2 Performance Evaluation
The final detected regions using the proposed technique are presented in Figure 5.
Figure 5 - Detected Regions from the Proposed Technique
The performance of the proposed technique is evaluated by plotting performance points in the Receiver Operating Characteristic (ROC) space. The ROC space provides a common and convenient tool for graphically characterising the performance of NDT techniques and its usage has recently been extended to image detection [16]. A box counting approach similar to the procedure described in [17] was employed to calculate the Detection Rate (DR) and Misclassification Rate (MCR) for each image. This involved visually segmenting the images (Figure 6) through box counting and comparing them with the SVM classified images.
Figure 6 - Visually Identified Damaged Regions
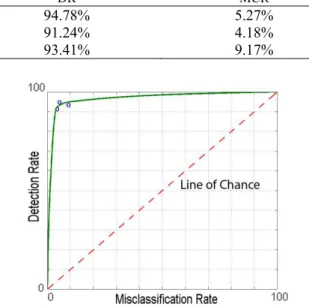
The DR and the MCR associated with each image provide the coordinates for the performance point in the ROC space which allows for a graphical representation of the performance of the technique. A convenient way for comparing and analysing the performance points is achieved through the use of the alpha-delta method [18, 19]. Essentially, this method relies on calculating the angle, α, and the Euclidean distance, δ, between the best performance point (coordinates (0,100%)) and the considered point to give a measure of the performance of the considered point. For this situation only the delta, δ, parameter is required. A low value for δ is indicative of a strong performing technique. The detection and misclassification rates are summarized in Table 1 and the associated points in the ROC space, along with a fitted curve, are illustrated in Figure 7.
Table 1 - Performance of the Proposed Technique.
Image DR MCR δ
Image (a) 94.78% 5.27% 0.07
Image (b) 91.24% 4.18% 0.10
Image (c) 93.41% 9.17% 0.11
Figure 7 - Performance Coordinates in the ROC Space for the Proposed Technique
The proposed technique performed well both in terms of identifying the location of damaged regions as well as defining their shape and size. It may be observed from Figure 4 that the detected regions are relatively homogenous, with only minor speckles of undetected regions being enclosed by the damaged areas. Although only three sample images are considered, the tight nature of the scatter points in the ROC space (Figure 7) suggests that the technique demonstrates a high degree of repeatability.
4 CONCLUSION
A texture based image processing technique to detect damage on the surface of infrastructural elements has been proposed. Although popular in other fields, image processing techniques have received little attention in the field of Structural Health Monitoring (SHM). As a case study, the proposed technique was successfully performed on three images of a corroded metallic surface in marine environment. There was a strong correlation between the detection and misclassification rates for each of the images which demonstrates the high level of repeatability of this approach.
The texture is described at each point in the image by a feature vector that contains seven texture related statistics derived from a Grey Level Co-occurrence Matrix (GLCM). This large feature vector ensures that a well-rounded description of the texture is created. This aspect also increases the robustness of the technique as some statistics which may be good at differentiating regions in one image may not necessarily be particularly useful in another image.
The use of Support Vector Machines (SVM) as a classifier in this two-class task is particularly suited to the large data sets. A procedure for removing small spurious regions formed in the SVM classification stage has been outlined.
ACKNOWLEDGMENTS
The authors wish to thank the Irish Research Council for Science, Engineering and Technology (IRCSET) for providing a grant to support this research and CAPACITES/IXEAD society for the practical and financial assistance.
REFERENCES
1. Agin, G.J., Computer Vision Systems for Industrial Inspection and Assembly. Computer, 1980. 13(5): p. 11-20.
2. Sheils, E., et al., Development of a two-stage inspection process for the assessment of deteriorating bridge structures. Reliability Engineering and System Safety, 2010. 95(3): p. 182-194.
3. Schoefs, F., Bernard, O., Capra, B. & Aduriz X. , Comparison of additional costs for several replacement strategies of randomly ageing reinforced concrete pipes, . Computer Aided Civil and Infrastructure Engineering (CACAIE), Wiley ed, 2009. 24(7): p. 492-508. 4. Schoefs, F., Abraham, O., Popovics, J. , Quantitative evaluation of NDT method
performance: application example based on contactless impact echo measurements for void detection in tendon duct. Construction and Building Materials (CBM), 2012a(Special Issue ‘NDT’).
5. Iyer, S. and S.K. Sinha, - Segmentation of Pipe Images for Crack Detection in Buried Sewers. 2006. - 21(- 6): p. - 410.
6. Tsai, Y. and Y. Huang, - Automatic Detection of Deficient Video Log Images Using a Histogram Equity Index and an Adaptive Gaussian Mixture Model. 2010. - 25(- 7): p. - 493. 7. Cord, A. and S. Chambon, - Automatic Road Defect Detection by Textural Pattern
Recognition Based on AdaBoost. 2011: p. - no.
8. Wu, J. and Y. Tsai, - Enhanced Roadway Inventory Using a 2-D Sign Video Image Recognition Algorithm. 2006. - 21(- 5): p. - 382.
9. Haralick, R.M., K. Shanmugam, and I.H. Dinstein, Textural Features for Image
Classification. Systems, Man and Cybernetics, IEEE Transactions on, 1973. 3(6): p. 610-621.
10. Xian, G.-M., An identification method of malignant and benign liver tumors from ultrasonography based on GLCM texture features and fuzzy SVM. Expert Systems with Applications, 2010. 37(10): p. 6737-6741.
11. Ben Salem, Y. and S. Nasri, Automatic recognition of woven fabrics based on texture and using SVM. Signal, Image and Video Processing, 2010. 4(4): p. 429-34.
12. Shevell, S.K. and F.A.A. Kingdom, Color in Complex Scenes. Annual Review of Psychology, 2007. 59(1): p. 143-166.
13. Boser, B.E., I.M. Guyon, and V.N. Vapnik, A training algorithm for optimal margin classifiers, in Proceedings of the fifth annual workshop on Computational learning theory. 1992, ACM: Pittsburgh, Pennsylvania, United States. p. 144-152.
14. Cortes, C. and V. Vapnik, Support-vector networks. Machine Learning, 1995. 20(3): p. 273-97.
15. Cristianini, N. and J. Shawe-Taylor, An Introduction to Support Vector Machines and other Kernel-based Learning Methods. 2000: Cambridge University Press.
16. Pakrashi, V., et al., ROC dependent event isolation method for image processing based assessment of corroded harbour structures. Structure and Infrastructure Engineering, 2010.
6(3): p. 365-378.
17. O'Byrne, M., et al., Receiver Operating Characteristics of a Modified Edge Detection for Corrosion Classification, in Forum Bauinformatik 23rd European Conference. 2011: Cork, Ireland.
18. Schoefs F., B.J., Clément A., Capra B. , The αδ method for modelling expert Judgment and combination of NDT tools in RBI context: application to Marine Structures, Structure and Infrastructure Engineering: Maintenance, Management, Life-Cycle Design and
performance (NSIE). SMonitoring, Modeling and Assessment of Structural Deterioration in Marine Environments, 2012b. 8(Special Issue): p. 531-543.