HAL Id: hal-01506074
https://hal.archives-ouvertes.fr/hal-01506074
Submitted on 26 Apr 2019
HAL is a multi-disciplinary open access
archive for the deposit and dissemination of
sci-entific research documents, whether they are
pub-lished or not. The documents may come from
teaching and research institutions in France or
abroad, or from public or private research centers.
L’archive ouverte pluridisciplinaire HAL, est
destinée au dépôt et à la diffusion de documents
scientifiques de niveau recherche, publiés ou non,
émanant des établissements d’enseignement et de
recherche français ou étrangers, des laboratoires
publics ou privés.
Comparative study of particle structure evolution
during water sorption: Skim and whole milk powders
Ingrid Murrieta-Pazos, C Gaiani, Laurence Galet, Bernard Cuq, S. Desobry,
J. Scher
To cite this version:
Ingrid Murrieta-Pazos, C Gaiani, Laurence Galet, Bernard Cuq, S. Desobry, et al.. Comparative
study of particle structure evolution during water sorption: Skim and whole milk powders. Colloids
and Surfaces B: Biointerfaces, Elsevier, 2011, 87 (1), pp.1-10. �10.1016/j.colsurfb.2011.05.001�.
�hal-01506074�
Comparative study of particle structure evolution during water sorption:
Skim and whole milk powders
I. Murrieta-Pazos
a, C. Gaiani
a,∗, L. Galet
b, B. Cuq
c, S. Desobry
a, J. Scher
aaLIBio, Laboratoire d’Ingénierie des Biomolécules, 2 Avenue de la forêt de Haye, B.P. 172, 54505 Vandœuvre-lès-Nancy Cedex, France
bRAPSODEE Centre de Recherche d’Albi en génie des Procédés des Solides Divisés, de l’Energie et de l’Environnement, FRE CNRS 3213, Ecole des Mines d’Albi, Campus Jarlard, 81013
Albi Cedex 09, France
cMontpellier SupAgro INRA, UMR 1208 Unit for Emerging Technology and Polymer Engineering, 2, Place Viala, 34060 Montpellier Cedex 1, France
Keywords: Dairy powder Sorption isotherm Microstructure Surface composition
a b s t r a c t
Surface composition of dairy powders influences significantly a quantity of functional properties such as rehydration, caking, agglomeration. Nevertheless, the kinetic of water uptake by the powders was never directly related to the structure and the composition of the surface. In this work, the effect of relative humidity on the structural reorganization of two types of dairy powder was studied. The water–powder interaction for industrial whole milk powder, and skim milk powder was studied using dynamic vapor sorption. The water sorption isotherms were fitted with a Brunner–Emmet–Teller model and each stage of the sorption curve was analyzed with a Fickian diffusion. The water content in the monolayer predicted for each powder and the moisture diffusivity calculated were discussed and compared. Concurrently, powders microstructure and powders surface under variable relative humidity were assessed by X-ray photoelectron spectroscopy, scanning electron microscopy coupled with energy dispersive X-ray and atomic force microscopy. A correlation between the data obtained from the sorption isotherms and the modifications of structure allowed us to conclude that powder microstructure and chemical state of the components could play an important role in determining the water diffusivity.
Contents
1. Introduction . . . 2
2. Materials and methods. . . 2
2.1. Materials . . . 2
2.2. Microscopy techniques . . . 2
2.2.1. Atomic force microscopy (AFM) . . . 2
2.2.2. Scanning electron microscopy (SEM) . . . 2
2.3. Particles size . . . 2
2.4. Surface composition . . . 3
2.4.1. X-ray photoelectron spectroscopy . . . 3
2.4.2. Energy dispersive X-ray analysis . . . 3
2.5. Dynamic vapor sorption . . . 3
3. Results and discussion . . . 4
3.1. Surface and size characterization of powders freshly manufactured . . . 4
3.2. Effect of water uptake on powder structure and particle size . . . 5
3.2.1. Powder structure . . . 5
3.2.2. Particle size . . . 7
Abbreviations:AFM, atomic force microscopy; aw, water activity; BET, Brunauer–Emmett–Tellet; DVS, dynamic vapor sorption; EDX, energy dispersive X-ray; Ra, mean
roughness; RH, relative humidity; SEM, scanning electron microscopy; SMP, skim milk powder; WMP, whole milk powder; XPS, X-ray photoelectron spectroscopy. ∗ Corresponding author.
3.3. Water sorption isotherms . . . 7
3.4. Relationships between moisture diffusivity, powder structure and surfaces . . . 8
4. Conclusion. . . 9
Acknowledgments . . . 9
References . . . 9
1. Introduction
One of the most important physical phenomena occurring in dairy powder during milk reconstitution[1,2]or humid storage
[3–6]is water transfer. During reconstitution, water transfer opti-mization is fundamental to obtain a quick process. This depends on the succession of different steps: the wettability, the sinkabil-ity, the dispersibility; and finally the solubilsinkabil-ity, which is the ability of components to dissolve in water[7–11]. During storage, diffu-sion of water inside the powder particles was often studied with the determination of the water sorption isotherms. The case of a complex matrix (e.g. dairy powders) in which the structure is het-erogeneous was often investigated[3,12–15]. Water diffusivity was already studied in detail for complex food structures such as cakes
[16], bread crust[17,18], or starches[19–21]. Model food systems were also investigated[22,23]. Furthermore, little is known about how the dairy powder structure is modified when the moisture content of the material increases. Microstructure and diffusivity relationships in a porous food system were investigated[16]. It was observed that the level of porosity in the structure was directly related to the water diffusion. Nevertheless, deep studies coupling sorption isotherms and water diffusivity are lacking in the dairy powder field.
Recently, some authors have demonstrated that dairy powder surface influences some functional properties[3,24–31]. The appli-cation of X-ray photoelectron spectroscopy (XPS) was extensively developed by these authors. From the C, O and N percentages, sur-face contents in protein, lactose and fat were calculated. These surface contents are representative of the extreme surface of the particle (around 5 nm)[32]. Another approach is also possible with the development of scanning electron microscopy (SEM) coupled with energy dispersive X-ray (EDX). This complementary technique rends possible the surface analysis at a different depth (up to few micrometers for EDX)[33]. Nevertheless, this technique was never applied to food powders.
Applicable conclusions on the influence of processes or storage parameters on dairy powder structures can only be evaluated while considering the supra-molecular structure of the material build-ing the particle[34]. For this purpose, industrial skim and whole milk powders (containing 1% and 28% of lipids respectively) were used as different materials. Weights changes at different equili-brating relative humidities (RH) were followed in continue with a dynamic vapor sorption (DVS) equipment. For each relative humid-ity, diffusivity value was determined using the second Fick’s law. Concurrently, the structure was characterized by SEM, XPS, EDX and Atomic Force Microscopy (AFM). Finally, the variations in water sorption and diffusivity were related to milk powders surface and microstructure modifications.
The aim of this paper was to study milk powder/water inter-actions considering sorption and diffusion in humid air and integrating swelling and crystallization occurring during powder water vapor hydration.
2. Materials and methods 2.1. Materials
Two industrial milk powders obtained from Lactalis (Laval, France) were studied. The following compositions (% w/w) were
measured respectively for skim milk powder (SMP): water (3.8), proteins (37.1), lactose (52.0), lipids (1.4) and ashes (5.7) and whole milk powder (WMP): water (3.9), proteins (26.2), lac-tose (36.7), lipids (27.3) and ashes (5.9). These powders were sieved at 75 !m to present a similar particle size. The sieving did not affect the chemical composition of the powders (data not shown).
Samples were equilibrated at 25◦C during 3 days at various
water activities in hermetic vessels containing saturated salt solu-tions (Sigma–Aldrich) of known RH: 0.11 (LiCl); 0.22 (CH3COOK);
0.33 (MgCl2); 0.43 (K2CO3); 0.54 (Mg(NO3)2); 0.69 (KI); 0.75 (NaCl);
0.79 (NH4Cl); 0.85 (KCl); 0.94 (KNO3) and 0.97 (K2SO4).
2.2. Microscopy techniques
2.2.1. Atomic force microscopy (AFM)
Images were recorded using an MFP3D-BIO instrument (Asy-lum Research Technology, Atomic Force F&E GmbH, Mannheim, Germany). Silicon nitride cantilevers of conical shape were purchased from Veeco (MLCT-AUNM, Veeco Instruments SAS, Dourdan, France), and their spring constants were determined using the thermal calibration method[35], providing values of ∼10.4 ± 1.7 pN nm−1. Prior to experiment, the geometry of the tip
was systematically controlled using a commercial grid for 3-D visu-alization (TGT1, NT-MTD Compagny, Moscow, Russia). Curvature of the tip in its extremity was found to lay in the range ∼20–50 nm. Experiments were performed in air at room temperature. For pow-der immobilization a piece of wax (Tempfix mounting adhesive, Spi Supplies, USA) was placed on a metal disk support and was warmed up until the wax softens (around 70◦C). After the wax softens, the
metal was removed from the heater. The powder was gently spread when the surface of the wax just starts to solidify. Finally, the sam-ple was ready for imaging when the thermal wax becomes totally solid
To evaluate the surface topology, the mean roughness (Ra) of the powders was calculated according to Eq.(1):
R =N1 xNy
!
Ny i=1!
Ny j=1"
"
zij− zmean"
"
(1)where zijis the height of a given pixel, zmeanis the average height
of the pixel, and Nxand Nyare the numbers of pixels in the x and y
directions.
2.2.2. Scanning electron microscopy (SEM)
The powders were examined with a Hitachi SEM S2500 instru-ment operating at 10 kV. They were spread at the surface of a sticky plastic circle fixed on a support. Then the samples were covered with gold particles by sputtering (Bio-Rad type SC 502).
2.3. Particles size
Analyses were performed using a laser light diffusion gran-ulometer at a wavelength of 632.8 nm (Mastersizer S, Malvern instruments, UK). The Malvern apparatus is equipped with a sam-ple dispersion module which is suited for powders in suspension. For each measure, 0.25 g of the powder was dispersed in 75 ml of ethanol (to obtain a good obscuration and to avoid particles
super-position). A monomodal Gaussian distribution was obtained. As a consequence, three measurements of the d50were conducted with
each powder sample. 2.4. Surface composition
2.4.1. X-ray photoelectron spectroscopy
XPS is a quantitative spectroscopic technique that measures the elemental composition up to 5 nm depth[36]. It provides elemen-tal and chemical state data in solid samples. XPS is performed in ultra high vacuum (10−8kPa) which may limit the technique in the
food fields (liquids). Nevertheless, it is not an inconvenient in the case of food powders.[37]The use of XPS was extended for the last 10 years to the surface composition of dairy powders[25,38]. From the C, O and N percentages, the contents in protein, lactose and fat at surface were calculated with a matrix formula, the elemental composition in the sample is assumed to be a linear combination of pure components conforming the sample. Milk powders are gen-erally composed of fat, proteins and lactose but also vitamins and traces of mineral elements. By using the precedent matrix, only lac-tose, fat and protein are take into account; others components are neglected[38,39]
The XPS analyses were carried out with a Kratos Axis Ultra (Kratos Analytical, Manchester, UK) photoelectron spectrometer. The instrument uses a monochromatic Al K" X-ray source. The powder samples were attached to the sample holder with a dou-ble side conductive tape. The analyzed area was currently about 700 × 300 !m. Spectra were analyzed using the Vision software from Kratos (Vision 2.2.0). Quantification was performed using the photoemission cross-sections and the transmission coefficients given in the Vision package.
2.4.2. Energy dispersive X-ray analysis
EDX was carried out on a Philips CM20 microscope. This micro-scope works at 200 kV and has an Oxford EDX detector with an atmospheric thin window and a link analytical system. An aver-age elemental composition of the samples was obtained by a data collection at 3 different mm2sized windows on the powder surface
2.5. Dynamic vapor sorption
Sorption isotherms of powders were obtained with a dynamic vapor sorption analyzer DVS (Surface Measurement Systems Ltd., London, UK) equipped with a Cahn microbalance. The experiments were carried out at a constant temperature (20◦C) and different
relative humidity values ranging between 0% and 98%. Approxi-mately 15 mg of powder was loaded onto the quartz sample pan. First, the samples were dehydrated in the DVS chamber (RH = 0%) for 200 min. Then, the samples were submitted to a program allow-ing hydration with 10% RH steps. The samples were considered to be at equilibrium when the value dm/dt (slope of the changing in mass with time) was set to be <0.002 mg min−1 or equilibration
time exceeded 1000 min. Experiments were performed in triplicate for each sample.
The Brunauer–Emmett–Tellet (BET) equation has been often used to model water sorption data from 0% to 50% RH[3,15,40–42]. The BET isotherm model is given by:
X = Xm(1 − a CBET aw
w) (1 − aw+ CBETaw) (2)
In Eq.(2), aw is the water activity, X is the moisture content
(g 100 g−1), Xmis the monolayer moisture capacity (g 100 g−1) and
CBETis a constant related to the water binding energy. The fitting
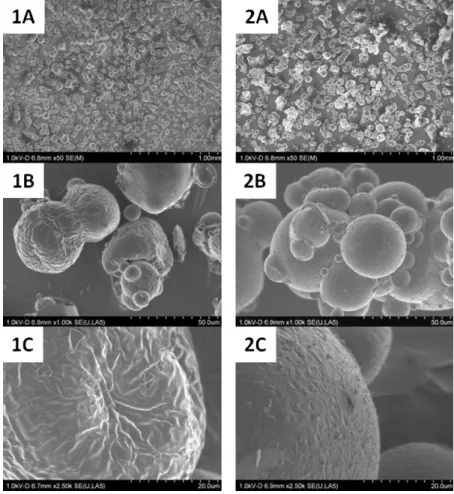
Fig. 2. Atomic force microscopy images (10 × 10 !m) of skim milk powder (1) and whole milk powder (2) at high resolution (A) and the 3D projection (B).
of BET model was checked by calculating the R2with the Origin 6.1
software (OriginLab Corporation, Northampton, USA). 3. Results and discussion
3.1. Surface and size characterization of powders freshly manufactured
Whole milk and skim milk powders were observed by SEM. Due to the particle sieving, the particle size was relatively homogeneous (Figs.1A and2A). As observed in Figs.1B and2B the average size of each sample was 50 !m. Nevertheless, the surface microstruc-ture of the powders was totally different depending on the powder composition (Figs.1C and2C). WMP particles presented a regu-lar surface whereas SMP particles were characterized by a “brain type” surface with some deep and shallow folds. The lactose was in an amorphous state as no sharp crystals were noticed for each powder (and confirmed by DSC, data not shown). All these features were typical for fresh whole and skim milk powders[28].
Concurrently, AFM was performed on the same powders to bet-ter analyze the particles surfaces (Fig. 2). Up to now, AFM imaging in tap-mode has never been realized on dairy powders. The AFM images obtained by 3-D projection were in total agreement with those obtained by SEM. In addition, the average surface
rough-ness (Ra) was determined and was respectively found around 306 nm for SMP and 146 nm for WMP for a definite surface area (10 × 10 !m). The smoother visual aspect of WMP surface in com-parison with SMP surface (a “brain” type surface) was associated with the lower Ra value. The surface composition was determined by XPS with the matrix formula develop in detail for milk powders
[25,26,28,43–45]. It was measured that the surface of WMP was composed at 91.8% of fat, 7.2% of proteins and 0.8% of lactose. The SMP surface presented more proteins and lactose at the surface (45.8% and 30.8% respectively) and less fat (22.3%). Trace miner-als were measured at the surface of each powder. These surface compositions were in total agreement with others studies done by XPS on milk powders[28,46]. The over-representation of fat at the surface in comparison with the bulk composition of the powders is now generally accepted and well understood[3,26,47,48]. It is postulated that, during the spray drying of fat-containing materi-als (e.g. whole milk) larger fat globules are preferentially present at the surface of droplets and so fat appears in high concentra-tion on the powder surface[48]. In addition, during spray-drying, there is a further increase in the amount of fat probably due to segregation of components within the drying[26]. It is assumed that, even when fat is present at low concentrations (e.g. skim milk) in the milk droplet, residual fat may be preferentially present at the air/droplet interface, and thus may appears at relatively
Table 1
Composition (%) of milk powders: bulk composition, surface composition calculated from XPS analyses (≈5 nm) and surface composition calculated from EDX (≈1 !m). Mean of at least two independent analyses.
Proteins Lactose Lipids Minerals Water
Bulk composition (%)
Skim milk powder 34.1 ± 0.2 53.9 ± 0.3 1.5 ± 0.0 6.5 ± 0.0 4.0 ± 0.1
Whole milk powder 25.2 ± 0.3 38.8 ± 0.1 26.2 ± 0.1 5.0 ± 0.5 3.8 ± 0.1
First 5 nm composition from XPS (%)
Skim milk powder 45.8 ± 1.4 30.8 ± 1.2 22.3 ± 1.1 1.1 ± 0.1 –
Whole milk powder 7.2 ± 0.5 0.8 ± 0.1 91.8 ± 2.1 0.2 ± 0.0 –
First 1 !m composition from EDX (%)
Skim milk powder 34.0 ± 1.8 16.8 ± 0.8 46.4 ± 2.3 2.8 ± 0.6 –
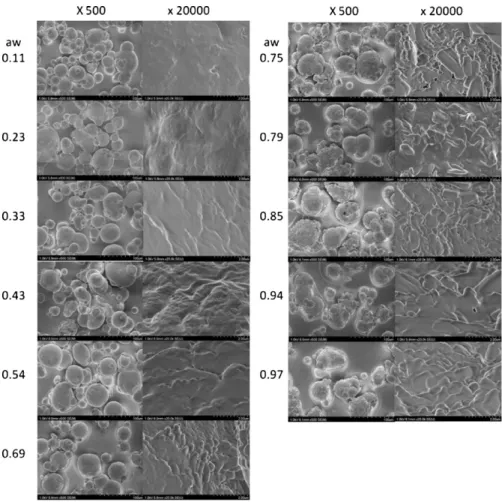
Fig. 3. Surface characterization of whole milk particles observed by scanning electron microscopy at variable relative humidity (from 0.11 to 0.97). high concentration on the powder surface after complete drying
[3,30,49]. This phenomenon may explain the presence of 22% fat at the surface of SMP whereas the particle bulk was composed of only 1.5%. In the presence of surface active components (such as pro-teins), it appears that this component accumulates at the surface of a milk droplet/particle at the expense of lactose during drying
[28,44,45,50]. Indeed, only 30% of lactose was observed at the sur-face of SMP instead of 54% in the bulk. In complement to XPS, EDX analyses were performed. These two techniques were for the first time coupled to analyze the surface of dairy powders at differ-ent deepness. Therefore, EDX analyses were performed to evaluate the surface at 1 !m depth whereas XPS was operating at 5–10 nm depth. It was observed inTable 1that under the surface established by XPS, the WMP presented proteins (25.8%), lactose (13.7%), lipids (58.6%) and minerals (1.9%). In comparison with the first 5 nm, EDX measurements suggested that the surface of WMP may be exter-nally covered by a thin layer of fat (observed by XPS) with a matrix of proteins, lactose and minerals under this layer. For SMP, EDX measures gave the following percentages: proteins (34.0%), lactose (16.8%), lipids (46.6%) and minerals (2.8%). Contrary to WMP, the lipids were more present in the first micrometer layer in compari-son with the five first nanometers. These results may be explained by the dominance of proteins at the surface (more tensioactive); more fat being located just under. For each powder, minerals were more located in the first 5 nm.
3.2. Effect of water uptake on powder structure and particle size 3.2.1. Powder structure
Each powder was introduced in saturated atmospheres during 4 days allowing water exchanges between the powder of low water
activity (aw) and the relative humidity of the surrounding air. SEM
was performed on powders equilibrated at 11 awranging between
0.11 and 0.97. For WMP,Fig. 3indicates that some changes in sur-face structure with relative humidity occurred. Between aw= 0.11
and 0.33, the surface was relatively smooth and regular. From aw= 0.43, an irregular surface appears corresponding to lactose
crystals formation. These crystals were assumed to be localized just under the surface. As reported previously[50,51]and in agreement with the XPS results (Table 1), it was not possible to observe sharp lactose crystals at the surface of WMP certainly due to the fact that the surface was mainly covered with a layer of fat. At higher aw
values, lactose crystals were more present but still localized under the surface. Surface evolution of SMP with the relative humidity was totally different (Fig. 4). A substantial amount of needle like lactose crystals was observed on the surface, which confirmed that the lactose was transformed from the rubbery state to the crys-talline state around a relative humidity of 54%. Then, the number of dents at the particle surface increased regularly from aw= 0.54 until
0.75. The relationship between the extent of crystallization and relative humidity was found parabolic with the maximum crystal-lization at a relative humidity around 0.7[52]. Nevertheless, these assumptions are not obvious on our SEM images.
In freshly spray-dried milk powders (Fig. 1) and at low relative humidity (Figs. 3 and 4) lactose was in the metastable amorphous state. In this state, lactose is hygroscopic and forms a continu-ous matrix containing embedded fat globules, protein, minerals and air vacuoles. In contact to a high relative humidity and/or an increased temperature, the amorphous state present in the pow-der may progress into a stable crystalline state. Moreover, previous research has shown that crystallization of lactose may be delayed in the presence of proteins[13,53]. Indeed, preferential sorption of
Fig. 4. Surface characterization of skim milk particles observed by scanning electron microscopy at variable relative humidity (from 0.11 to 0.97).
water by non-amorphous constituents was found to delay the rate at which lactose endured a change from the glassy to the rubbery form[13]. It may also be the case with WMP and SMP (Figs. 3 and 4). In SMP, the total protein content was higher (Table 1) and the
presence of crystal was observed for slightly higher relative humid-ity than WMP. Hypothesis for this delay was also supported by the fact that proteins may significantly lower the availability of water for plasticization and crystallization of lactose[13,45].
Fig. 5. Evolution of particle size (d50, !m) at 11 different aw(from 0.11 to 0.97) for skim and whole milk powders determined with a Malvern apparatus. Mean of three
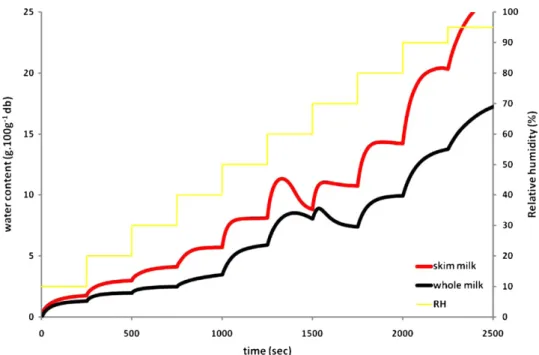
Fig. 6. Example of kinetic data obtained during water adsorption of milk powders at 20◦C and measured by DVS automatic sorption analyzer (powders sieved at 50 !m). 3.2.2. Particle size
Particle size was followed during water uptake for WMP and SMP (Fig. 5). First, a significant size increase was observed for each powder between 11% and 43% RH (Fig. 5). Up to 43% RH, the d50
increases may be attributed to particle swelling due to water migra-tion into the amorphous molecular matrix. Then, a particle size decrease was found around 54% RH and may be explain by the col-lapse of the amorphous matrix (lactose/proteins/lipids) triggered by crystallization of lactose. This relative humidity was well corre-lated with the apparition of crystals on microscopy images (Figs. 3 and 4). Finally, the particle size increases strongly from 54% RH. This phase, related to powder caking was already strongly documented
[6,12,13,15,30,54]. For WMP, the caking may be mainly attributed to the presence of fat at the surface even if significant caking has
been observed principally in powders containing a total fat con-tent of at least 40%[55]. For SMP, lactose may be responsible of the caking phenomena even if lactose under its crystalline form is less sensitive to caking than amorphous lactose[34].
3.3. Water sorption isotherms
Kinetic data obtained during water adsorption of SMP and WMP at 20◦C are given inFig. 6. Extend of hydration was the lowest for
whole milk powder particularly at high RH. Indeed, fat in whole milk powder is not a water-absorbing component, consequently fat containing samples exhibit little moisture sorption[34]. If the mois-ture content was calculated on a non-fat basis, the isotherms of SMP and WMP are almost similar which was also observed by others
Fig. 7. Experimental and predicted water vapor sorption isotherms (mean of three independent analyses). Determination of the monolayer moisture content (Xm) and
Fig. 8. Moisture diffusivity of skim milk and whole milk powders as a function of aw. Mean of three independent analyses.
studies[2,56,57]. In agreement with electron microscopy images, lactose crystallization was observed. As crystalline form has a lower water capacity than amorphous form[34], water is liberated and is characterized by a decrease in the sorption curve at around 50% RH. The BET monolayer moisture contents for SMP and WMP was calcu-lated at 4.45 and 2.44 g 100 g−1dry solid respectively (Fig. 7). These
values were in agreement with the literature and are dependent of the powder chemical, composition, the temperature[34]. 3.4. Relationships between moisture diffusivity, powder structure and surfaces
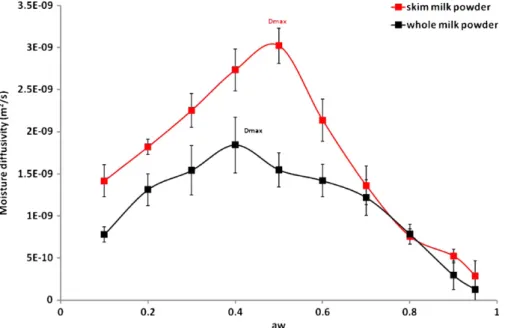
Apparent moisture diffusion (called diffusivity in the continu-ation of the paper) as a function of relative humidity at 20◦C is
presentedFig. 8. This representation is based on the assumption that moisture sorption kinetic is limited by the diffusion. Water diffusivity in whole milk and skim milk powders was calculated for each RH level from the water sorption kinetic curve (Fig. 6) mea-sured using the DVS and the slope method developed by others
[20]. For this purpose, different hypothesis were formulated. First, the diffusivity was assumed to be constant for each RH level and could change from one stage to another. Second, particles size is assumed to be homogeneous (average diameter apply to all parti-cles) when placed in the DVS pan. Third, in this work, to improve the method, swelling during adsorption was considered. As indicated byFig. 5, the powder size was variable upon water sorption and has been taken into account for a more accurate diffusivity deter-mination[19]. The resultant diffusivity values were plotted as a function of the average water activity of level for all the successive RH levels investigated (Fig. 8). A bell like curve was obtained for each powder in agreement with a great number of studies[19–23]. The maximum diffusivity value was observed at aw= 0.41 for skim
milk powder and awbetween 0.41 and 0.53 for whole milk
pow-der. Dmaxwas respectively at 3.1 × 10⁻⁹and 1.7 × 10⁻⁹m2s−1for
SMP and WMP. These calculated values were in the range of those reported in literature for food products[16,58]. Comparison with dairy powders was impossible due to lack of data in this field up to now. As observed by others[16], Dmaxvalues were not related to
the moisture content corresponding to the monolayer value (4.45 and 2.44 g 100 g−1for SMP and WMP respectively) but were slightly
higher. Nevertheless, the amorphous-crystallized transition of
lac-tose was estimated to be at about aw= 0.43 for WMP and 0.54 for
SMP from MEB observation. This corresponds well to the point where the maximum in diffusion rate is observed inFig. 8. The Dmax
was dependent on the state of the sample[18]and also on differ-ences in the method used to determined the moisture diffusivity
[16,58].
The bell like curves obtained may be explained by different pro-cesses occurring during water uptake. Comparison between curves obtained for WMP and SMP (Fig. 8) reveals that at low aw, the
mois-ture diffusivity was lower for WMP. During this first phase, water adsorbs to the surface of the particles. As expected, powders pre-senting important surface fat coverage (WMP) were less prone to adsorb water and the rate of sorption was lower than lactose con-taining powders (SMP). Water diffusion is known to be accelerated in polar hydrophilic matrices[34]. In addition, the average surface roughness of SMP particles was significantly higher (Figs. 1 and 2) increasing the effective area. Next to the maximum, the diffu-sivity decrease may be attributed to change in lactose state. It is well established that the permeability of crystalline and amorphous substance differs significantly. As a consequence, crystalline lactose has a lower water capacity and a lower water diffusion than amor-phous lactose[34]. This can be explained by differences in the free volume of these two types of matrices. The low free volume and the small hole size in crystalline structure may be responsible of a lower diffusion. As a consequence, when the quantity of crystallized lactose increases, the diffusivity decreases. Others incriminated the caking of the macroscopic structure[59]which in turn reduce the effective area exposed to the solvent and therefore decrease the sorption rate or changes in particle porosity[16]. Nevertheless, in this work, the evolution of particle size (swelling, collapse and cak-ing) was taken into account in the mathematical calculation of the moisture diffusivity. Another possible phenomenon may be that at these humidities the transport of water vapor through the air may be a limiting factor. An important and unexpected decrease of the diffusivity value was observed for high relative humidity. Indeed, an additional phenomenon may occur and the Fickian model used to obtain the diffusivity value may be not entirely appropriate to represent this different diffusional mechanism. Indeed, water that migrates into the dry matrix (low RH) will probably do that at a different rate as compared to water migrating into the already hydrated matrix[18].
4. Conclusion
Water diffusion in dairy powders was studied coupled with structure and surface investigations. A relationship between lac-tose state and water diffusivity was highlighted. The differences observed were also related to the surface composition (more or less lipids). In the future, knowledge of these factors can be used to better control powder ageing and rehydration. Moreover, the com-bination of XPS and EDX, to estimate the surface composition of powders at different depth, with SEM and AFM, to investigate the structure of the powder particles, may be a promising method to better understand the repartition of components under the surface and their structure. An in-depth study is actually under develop-ment (with pure milk components) to validate the use of XPS and EDX in the field of dairy powders.
Acknowledgments
ANR funding from program “Reactive Powder” are gratefully thanks. LCPME laboratory (Laboratoire de Chimie Physique et de Microbiologie pour l’Environnement, Nancy) is thanks for perform-ing XPS and AFM analyses.
References
[1] C. Gaiani, S. Banon, J. Scher, P. Schuck, J. Hardy, Use of a turbidity sensor to char-acterize micellar casein powder rehydration: Influence of some technological effects, J. Dairy Sci. 88 (2005) 2700–2706.
[2] K.D. Foster, J.E. Bronlund, A.H.J. Paterson, The prediction of moisture sorption isotherms for dairy powders, Int. Dairy J. 15 (2005) 411–418.
[3] C. Gaiani, P. Schuck, J. Scher, J.J. Ehrhardt, E. Arab-Tehrany, M. Jacquot, S. Banon, Native phosphocaseinate powder during storage: lipids released onto the sur-face, J. Food Eng. 94 (2009) 130–134.
[4] E. Haque, B.R. Bhandari, M.J. Gidley, H.C. Deeth, S.M. Moller, A.K. Whittaker, Pro-tein conformational modifications and kinetics of water-proPro-tein interactions in milk protein concentrate powder upon aging: effect on solubility, J. Agric. Food Chem. 58 (2010) 7748–7755.
[5] A.S. Pereyra Gonzales, G.B. Naranjo, G.E. Leiva, L.S. Malec, Maillard reaction kinetics in milk powder: effect of water activity at mild temperatures, Int. Dairy J. 20 (2010) 40–45.
[6] N. Silalai, Y.H. Roos, Roles of water and solids composition in the control of glass transition and stickiness of milk powders, J. Food Sci. 75 (2010). [7] B. Freudig, S. Hogekamp, H. Schubert, Dispersion of powders in liquids
in a stirred vessel, Chem. Eng. Process.: Process Intensification 38 (1999) 525–532.
[8] C. Gaiani, J. Scher, P. Schuck, J. Hardy, S. Desobry, S. Banon, The dissolution behaviour of native phosphocaseinate as a function of concentration and tem-perature using a rheological approach, Int. Dairy J. 16 (2006) 1427–1434. [9] C. Gaiani, P. Schuck, J. Scher, S. Desobry, S. Banon, Dairy powder rehydration:
Influence of protein state, incorporation mode, and agglomeration, J. Dairy Sci. 90 (2007) 570–581.
[10] A.J. Baldwin, Insolubility of milk powder products – A minireview, Dairy Sci. Technol. 90 (2010) 169–179.
[11] A.J. Baldwin, W.B. Sanderson, Factors affecting the reconstitution properties of whole milk powder, N. Z. J. Dairy Sci. Technol. 8 (1973) 92–100.
[12] M. Mathlouthi, B. Rogé, Water vapour sorption isotherms and the caking of food powders, Food Chem. 82 (2003) 61–71.
[13] S.A. Hogan, D.J. O’Callaghan, Influence of milk proteins on the development of lactose-induced stickiness in dairy powders, Int. Dairy J. 20 (2010) 212–221. [14] S. Sun, J.R. Mitchell, W. MacNaughtan, T.J. Foster, V. Harabagiu, A. Yihu Song, Q.
Zheng, Comparison of the mechanical properties of cellulose and starch films, Biomacromolecules 11 (2010) 126–132.
[15] A.K. Shrestha, T. Howes, B.P. Adhikari, B.R. Bhandari, Water sorption and glass transition properties of spray dried lactose hydrolysed skim milk powder, LWT – Food Sci. Technol. 40 (2007) 1593–1600.
[16] V. Guillard, B. Broyart, C. Bonazzi, S. Guilbert, N. Gontard, Moisture diffusivity in sponge cake as related to porous structure evaluation and moisture content, J. Food Sci. 68 (2003) 555–562.
[17] M.B.J. Meinders, T. van Vliet, Modeling water sorption dynamics of cellular solid food systems using free volume theory, Food Hydrocolloids 23 (2009) 2234–2242.
[18] N.H. Van Nieuwenhuijzen, M.B.J. Meinders, R.H. Tromp, R.J. Hamer, T. Van Vliet, Water uptake mechanism in crispy bread crust, J. Agric. Food Chem. 56 (2008) 6439–6446.
[19] F. Chivrac, H. Angellier-Coussy, V. Guillard, E. Pollet, L. Avérous, How does water diffuse in starch/montmorillonite nano-biocomposite materials? Carbo-hydr. Polym. 82 (2010) 128–135.
[20] X. Yu, A.R. Schmidt, L.A. Bello-Perez, S.J. Schmidt, Determination of the bulk moisture diffusion coefficient for corn starch using an automated water sorp-tion instrument, J. Agric. Food Chem. 56 (2008) 50–58.
[21] J.I. Enrione, S.E. Hill, J.R. Mitchell, Sorption and diffusional studies of extruded waxy maize starch–glycerol systems, Starch/Staerke 59 (2007) 1–9. [22] E. Roca, B. Broyart, V. Guillard, S. Guilbert, N. Gontard, Predicting moisture
transfer and shelf-life of multidomain food products, J. Food Eng. 86 (2008) 74–83.
[23] E. Roca, V. Guillard, B. Broyart, S. Guilbert, N. Gontard, Effective moisture dif-fusivity modelling versus food structure and hygroscopicity, Food Chem. 106 (2008) 1428–1437.
[24] P. Faldt, B. Bergenstahl, Spray-dried whey protein/lactose/soybean oil emul-sions. 2. Redispersability, wettability and particle structure, Food Hydrocolloids 10 (1996) 431–439.
[25] C Gaiani, J.J. Ehrhardt, J. Scher, J. Hardy, S. Desobry, S. Banon, Surface com-position of dairy powders observed by X-ray photoelectron spectroscopy and effects on their rehydration properties, Colloids Surf. B. Biointerfaces 49 (2006) 71–78.
[26] C. Gaiani, M. Morand, C. Sanchez, E.A. Tehrany, M. Jacquot, P. Schuck, R. Jeantet, J. Scher, How surface composition of high milk proteins powders is influ-enced by spray-drying temperature, Colloids Surf. B. Biointerfaces 75 (2010) 377–384.
[27] C. Gaiani, J. Scher, J.J. Ehrhardt, M. Linder, P. Schuck, S. Desobry, S. Banon, Rela-tionships between dairy powder surface composition and wetting properties during storage: importance of residual lipids, J. Agric. Food Chem. 55 (2007) 6561–6567.
[28] E.H.J. Kim, X.D. Chen, D. Pearce, Surface characterization of four industrial spray-dried dairy powders in relation to chemical composition, structure and wetting property, Colloids Surf. B. Biointerfaces 26 (2002) 197–212. [29] E.H.J. Kim, D.C. Xiao, D. Pearce, Effect of surface composition on the flowability
of industrial spray-dried dairy powders, Colloids Surf. B. Biointerfaces 46 (2005) 182–187.
[30] J.J. Nijdam, T.A.G. Langrish, The effect of surface composition on the functional properties of milk powders, J. Food Eng. 77 (2006) 919–925.
[31] C. Vega, Y.H. Roos, Invited review: spray-dried dairy and dairy-like emulsions – Compositional considerations, J. Dairy Sci. 89 (2006) 383–401.
[32] D. Briggs, M.S. Seah, Practical Surface Analysis, Auger and X- ray Photoelectron Spectroscopy, (1994).
[33] S. Kaciulis, A. Mezzi, C. Ferdeghini, A. Martinelli, M. Tropeano, Chemical compo-sition of superconducting SmFeAsO doped with fluorine, Surf. Interface Anal. 42 (2010) 692–695.
[34] S. Palzer, The relation between material properties and supra-molecular struc-ture of water-soluble food solids, Trends Food Sci. Technol. 21 (2010) 12–25. [35] R. Lévy, M. Maaloum, Measuring the spring constant of atomic force
micro-scope cantilevers: thermal fluctuations and other methods, Nanotechnology 13 (2002) 33–37.
[36] Practical Surface Analysis (2nd Edition ed.), Auger and X-ray Photoelectron Spectroscopy Wiley, 1990.
[37] B.J. James, B.G. Smith, Surface structure and composition of fresh and bloomed chocolate analysed using X-ray photoelectron spectroscopy, cryo-scanning electron microscopy and environmental scanning electron microscopy, LWT – Food Sci. Technol. 42 (2009) 929–937.
[38] P Faldt, B. Bergenstahl, G. Carlsson, The surface coverage of fat on food powders analyzed by ESCA (electron spectroscopy for chemical analysis), Food Struct. 12 (1993) 225–234.
[39] P. Faldt, B. Bergenstahl, The surface composition of spray-dried protein-lactose powders, Colloids Surf. Physicochem. Eng. Aspects 90 (1994) 183–190. [40] M.K. Haque, Y.H. Roos, Water sorption and plasticization behavior of
spray-dried lactose/protein mixtures, J. Food Sci. 69 (2004).
[41] M.K. Haque, Y.H. Roos, Water plasticization and crystallization of lactose in spray-dried lactose/protein mixtures, J. Food Sci. 69 (2004).
[42] M. Mohamad Saad, C. Gaiani, J. Scher, B. Cuq, J.J. Ehrhardt, S. Desobry, Impact of re-grinding on hydration properties and surface composition of wheat flour, J. Cereal Sci. 49 (2009) 134–140.
[43] P. Faldt, B. Bergenstahl, The surface composition of spray-dried protein–lactose powders, Colloids Surf. Physicochem. Eng. Aspects 90 (1994) 183–190. [44] M. Jayasundera, B. Adhikari, P. Aldred, A. Ghandi, Surface modification of spray
dried food and emulsion powders with surface-active proteins: a review, J. Food Eng. 93 (2009) 266–277.
[45] A.K. Shrestha, T. Howes, B.P. Adhikari, B.J. Wood, B.R. Bhandari, Effect of protein concentration on the surface composition, water sorption and glass transi-tion temperature of spray-dried skim milk powders, Food Chem. 104 (2007) 1436–1444.
[46] E.H.J Kim, X.D. Chen, D. Pearce, Surface composition of industrial spray-dried milk powders. 3. Changes in the surface composition during long-term storage, J. Food Eng. 94 (2009) 182–191.
[47] S. Kentish, M. Davidson, H. Hassan, C. Bloore, Milk skin formation during drying, Chem. Eng. Sci. 60 (2005) 635–646.
[48] E.H.J. Kim, X.D. Chen, D. Pearce, Surface composition of industrial spray-dried milk powders. 2. Effects of spray drying conditions on the surface composition, J. Food Eng. 94 (2009) 169–181.
[49] E.H.J. Kim, X.D. Chen, D. Pearce, On the mechanisms of surface formation and the surface compositions of industrial milk powders, Drying Technol. 21 (2003) 265–278.
[50] N. Özkan, N. Walisinghe, X.D. Chen, Characterization of stickiness and cake formation in whole and skim milk powders, J. Food Eng. 55 (2002) 293–303.
[51] P. Faldt, B. Bergenstahl, Changes in surface composition of spray-dried food powders due to lactose crystallization, Lebensmittel-Wissenschaft und-Technologie 29 (1996) 438–446.
[52] K. Jouppila, J. Kansikas, Y.H. Roos, Glass transition, water plasticization, and lactose crystallization in skim milk powder, J. Dairy Sci. 80 (1997) 3152–3160.
[53] A. Nasirpour, V. Landillon, B. Cuq, J. Scher, S. Banon, S. Desobry, Lactose crys-tallization delay in model infant foods made with lactose, [beta]-lactoglobulin, and starch, J. Dairy Sci. 90 (2007) 3620–3626.
[54] J.J. Fitzpatrick, M. Hodnett, M. Twomey, P.S.M. Cerqueira, J. O’Flynn, Y.H. Roos, Glass transition and the flowability and caking of powders containing amor-phous lactose, Powder Technol. 178 (2007) 119–128.
[55] K.D. Foster, J.E. Bronlund, A.H.J. Paterson, The contribution of milk fat towards the caking of dairy powders, Int. Dairy J. 15 (2005) 85–91.
[56] K. Jouppila, Y.H. Roos, Water sorption and time-dependent phenomena of milk powders, J. Dairy Sci. 77 (1994) 1798–1808.
[57] S.X.Q. Lin, X.D. Chen, D.L. Pearce, Desorption isotherm of milk powders at ele-vated temperatures and over a wide range of relative humidity, J. Food Eng. 68 (2005) 257–264.
[58] T.P. Labuza, C.R. Hyman, Moisture migration and control in multi-domain foods, Trends Food Sci. Technol. 9 (1998) 47–55.
[59] E. Roca, B. Broyart, V. Guillard, S. Guilbert, N. Gontard, Controlling moisture transport in a cereal porous product by modification of structural or formula-tion parameters, Food Res. Int. 40 (2007) 461–469.