HAL Id: hal-03188069
https://hal.sorbonne-universite.fr/hal-03188069
Submitted on 1 Apr 2021
HAL is a multi-disciplinary open access
archive for the deposit and dissemination of
sci-entific research documents, whether they are
pub-lished or not. The documents may come from
teaching and research institutions in France or
abroad, or from public or private research centers.
L’archive ouverte pluridisciplinaire HAL, est
destinée au dépôt et à la diffusion de documents
scientifiques de niveau recherche, publiés ou non,
émanant des établissements d’enseignement et de
recherche français ou étrangers, des laboratoires
publics ou privés.
Alessandro Ottaiano, Luisa Circelli, Angela Lombardi, Stefania Scala, Nicola
Martucci, Jerome Galon, Manuela Buonanno, Giosuè Scognamiglio, Gerardo
Botti, Fabienne Hermitte, et al.
To cite this version:
Alessandro Ottaiano, Luisa Circelli, Angela Lombardi, Stefania Scala, Nicola Martucci, et al.. Genetic
trajectory and immune microenvironment of lung-specific oligometastatic colorectal cancer. Cell Death
and Disease, Nature Publishing Group, 2020, 11 (4), pp.275. �10.1038/s41419-020-2480-6�.
�hal-03188069�
A R T I C L E
O p e n A c c e s s
Genetic trajectory and immune microenvironment
of lung-speci
fic oligometastatic colorectal cancer
Alessandro Ottaiano
1, Luisa Circelli
2, Angela Lombardi
3, Stefania Scala
4, Nicola Martucci
5, Jerome Galon
6,
Manuela Buonanno
7, Giosuè Scognamiglio
8, Gerardo Botti
8, Fabienne Hermitte
9, Giovanni Savarese
2, Luigi D
’Amore
2,
Fabiana Tatangelo
8, Annabella Di Mauro
8, Giuseppina Liguori
8, Anna Maria Trotta
4, Maria Napolitano
4,
Monica Capozzi
10, Salvatore Tafuto
10, Francesco Perri
11, Antonello La Rocca
5, Michele Caraglia
3,12and
Guglielmo Nasti
1Abstract
Genetics and immunologic dynamics pushing the evolution of colorectal cancer (CRC) from the primary tumor to the metastases are largely unknown; cancer heterogeneity makes challenging both therapy and mechanistic studies. We selected patients developing CRC with lung-limited metastatic disease as only illness during their life in order tofind any relevant genotype–phenotype relationship. Analysis of 523 cancer-relevant genes and of immune cells infiltration in primary and metastatic tissues revealed atypical genomic trajectories (TMB decrease, KRAS and SMAD4 regressive mutations), specific genetic events (ERBB2 point mutations) and scarce T-cell infiltration. These insights provide novel information in oligometastatic CRC biology and new perspectives for cancer monitoring and anti-cancer therapeutic strategies.
Introduction
Colorectal cancer (CRC) is the third most frequent neo-plasm and the second cause of cancer-related deaths worldwide1,2. In clinical practice, most of metastatic CRC patients present with disseminated nodules (pluri-metastatic disease, pMD) involving liver (about 40%) or more than one organ (about 50%) (Fig. 1a and b); the remaining mCRC patients (5–10%) present with indolent and low burden disease (liver and/or lung,≤3 nodules per organ)3(Fig.1c–e). Identifying the genetic and immunologic events in deter-mining the clinical behavior and the evolution of a neoplasm,
in time and space, is a new frontier of cancer research since the introduction of high-throughput genetic analyses. Such analyses provide novel insights in cancer biology and are crucial to identify new therapeutic strategies.
Many studies in pMD of CRC and other cancers have revealed heterogeneous results in genetics of primary tumors (PT) and matched metastatic lesions (as evidenced by de novo variations) with concordance rates (shared point mutations/total number of point mutations) varying from 0 to 100% (median: 45%)4–8(Supplementary File S1). The last evidences suggest that, when genetically similar, the cancer might evolve via epigenetic or regulatory modifications otherwise, crucial genetic events might switch on the meta-static/aggressive phenotypes (uncontrolled and sustained proliferation, spread to distant specific organs, resistance to therapy, etc.). Furthermore, according to the immunoediting hypothesis9, the large part of tumors, before developing immuno-evasive mutations, would be recognized and sculptured by lymphocytes. However, the timing as well as the clinical effects of such internal clash among altered
© The Author(s) 2020
Open Access This article is licensed under a Creative Commons Attribution 4.0 International License, which permits use, sharing, adaptation, distribution and reproduction in any medium or format, as long as you give appropriate credit to the original author(s) and the source, provide a link to the Creative Commons license, and indicate if changes were made. The images or other third party material in this article are included in the article’s Creative Commons license, unless indicated otherwise in a credit line to the material. If material is not included in the article’s Creative Commons license and your intended use is not permitted by statutory regulation or exceeds the permitted use, you will need to obtain permission directly from the copyright holder. To view a copy of this license, visithttp://creativecommons.org/licenses/by/4.0/.
Correspondence: Alessandro Ottaiano (ale.otto@libero.it)
1Department of Abdominal Oncology, SSD-Innovative Therapies for
Abdominal Cancers, Istituto Nazionale Tumori di Napoli, IRCCS“G. Pascale”, , Via M. Semmola, 80131 Naples, Italy
2AMES-Centro Polidiagnostico Strumentale, Srl, Naples, Italy
Full list of author information is available at the end of the article. These authors contributed equally: Alessandro Ottaiano, Luisa Circelli, Angela Lombardi
These authors jointly supervised this work: Michele Caraglia, Guglielmo Nasti Edited by G. Blandino 1234567890() :,; 1234567890( ):,; 1234567890() :,; 1234567890( ):,;
neoplastic cells and host lymphocytes are extremely complex and still largely unknown.
Previous studies of evolution of CRC metastatic lesions as compared to the primary tumors suffer of the extreme heterogeneity in terms of patients, disease features, anti-cancer treatments, disease spread and sites of metastases. These factors could account for heterogeneous results and interfere with the cancer phenomenology study.
Thus, in the present study, an a priori strict enrolment was conducted to select mCRC patients in order to (i) minimize any clinical and environmental interferences and (ii)find any specific genotype–phenotype relationships. Our aim was to investigate the impact of cancer heterogeneity (through next-generation sequencing—NGS) and patients’ immunologic dynamics (through characterization of cancer immune microenvironment) on the development of lung-limited, single-nodule metastatic disease (Fig.1e) in CRC. Such clean model can contribute to explore and generate hypotheses on the genetic trajectories and immunologic dynamics under-lying oligometastatic CRC evolution and lung site-specific dissemination.
Results
Patients, disease characteristics and genetic concordance From 2006 to 2016, 97 patients underwent to lung wedge resections for CRC oligometastases (1–3 nodules).
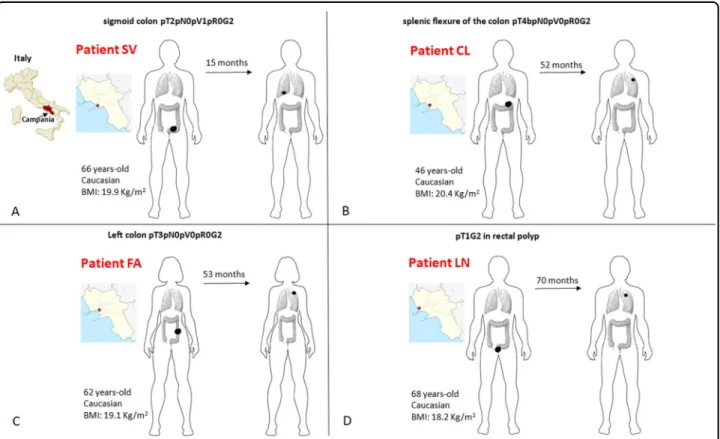
As reported above, a strict selection of those patients was subsequently applied in order to identify CRC patients who developed a single metastasis and were free from disease recurrence at a minimum follow-up of three years after lung resection. In addition, patients who had received long-lasting adjuvant chemotherapy (more than four cycles of fluoropirimidines and oxaliplatin) or pre-sented with any chronic illness (diabetes, hypertension or other cardiovascular diseases, chronic infections, auto-immune or inflammatory diseases, other cancers) were also excluded. The complete inclusion and exclusion criteria with the relative flow-chart are showed in (Sup-plementary File S2). Such strict selection should minimize potential interferences to explore the genotype–phenotype evidence relevant for the evolution from primary to single-nodule metastatic disease in CRC. Four CRC patients were selected (SV, CL, FA, LN). The cases’ plotting order in figures and tables reflects the time-to-lung metastases (from the shortest to the longest time elapsed: SV 15 m, CL 52 m, FA 53 m, LN 70 m). Sites, initials, genders, ages at diagnosis, body mass indexes, pathologic stages, localizations of PT and MT (metastatic tumor), dates of diagnosis and lung recurrence are shown in Fig. 2. Patients and tumor characteristics according to tumor mutation burden (TMB) and genetic sharing between PTs and MTs are shown in Table 1. TMB Fig. 1 Some common clinical patterns of CRC metastasis formation. Pluri-metastatic disease with a wide diffusion to liver or b to multiple organs (most frequently including liver, lungs, lymphnodes), and oligometastatic disease with“low burden” single organ involvement (liver in c, lungs in d). The disease pattern here studied is depicted in e.
decreased from PT to MT except for CL in which TMB increased (CL case: 7.0 mut/Mb PT vs 694.3 mut/Mb MT). The genetic sharing is high in SV (81.9%) and LN (95.9%), low in CL (12.2%) and FA (13.3%). Furthermore, to describe the matched mutational profiles of primary and metastatic lesions, mutational signatures (Methods) were depicted in (Supplementary File S3). Interestingly, patients CL and FA had also higher PT/MT differences in terms of mutational profiles [>80% of the 96 combinations with a Δfrequencies (MT-PT) of specific base-pair mutation types >25%] compared to SV and LN.
Mutations’ evolution and MSI testing
The genetic tumor evolution from PT to MT is shown in (Fig. 3a–d) according to strong/potential/unknown
(Tier1-3) AMP/ACMG prioritization of variants. The genetic sharing PT/MT is also depicted in Venn Diagrams embedded into Fig. 3; the TMB ranged from 1.6 muta-tions/Mb (SV metastasis) to 694.3 mutations/Ml (CL metastasis). In all cases except one (CL), there was a reduction in TMB from PT to MT. All cases were MSS in both PT and MT. MSI-associated genes of potential clinical significance are indicated with a red arrow; only SV and LN MLH variant was common (p.Ile219Val).
The spectrum of CRC “driver mutations”, in a case-matched manner, is reported in Table2. NGS allows the identification of hundreds of potentially significant mutations in cancer tissue specimens. Despite tumor heterogeneity, it is disputed and hypothesized that some backbone mutations might represent key events in determining cancer-specific phenotypes. Moreover, mutational concordance represents an indirect evidence that those mutations may have an important role in an evolution trajectory and/or in the establishment of metastases. Therefore, in order to identify genetic com-mon patterns in both PT and MT, Venn diagrams of shared mutations have been depicted for both PTs (Fig.4a, pattern A) and MTs (Fig. 4b, pattern B). The identified
genes are described with ClinVar dataset ID and their role in cancer. Interestingly, some mutations of unknown or potential clinical significance recurred in all PTs (AURKA, EPCAM, ERCC5, FAT1, LATS2, PTPRS, TP53) and MTs (ANKRD26, ERBB2, LATS2, TP53). The genetic altera-tions shared (pattern A and B) in our series were different from that previously reported in pluri-metastatic CRC (see Supplementary File S1). In particular, SMAD4 was present only in PT of CL case, APC was not present in PT of FA and MT of CL. Most surprisingly, KRAS mutations Fig. 2 Detailed clinico-pathological characteristics of patients. Schematic representation (a–d) of patients’ geographical origin, stage at diagnosis, age, race, body mass index (BMI), localization of primary tumor, time elapsed from the initial diagnosis to the development of radiologically evident lung metastasis (above the arrow), localization of lung metastasis. The cases’ panel order reflects the time-to-lung metastases (from from the shortest to the longest time elapsed: SV 15 m, CL 52 m, FA 53 m, LN 70 m).
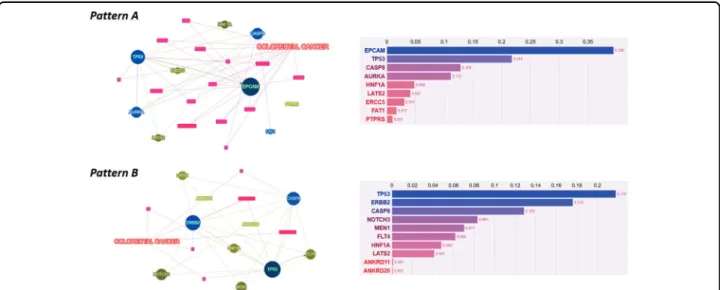
were not concordant in two cases. CL lost KRAS mutation in MT and LN lost a pathogenic mutation of KRAS in MT. ERBB2 p.Pro1170Ala was present in all cases except for PT of FA. Furthermore, we submitted our genetic results to Phenolyzer to depict relevance and relationships between any“seed” genetic variants and “secondary” ones (Methods). In PTs EPCAM, TP53, CASP8 were the most dominant and interrelated genes, in MTs TP53, ERBB2 and CASP8 (Fig.5).
Tumor microenvironment characteristics
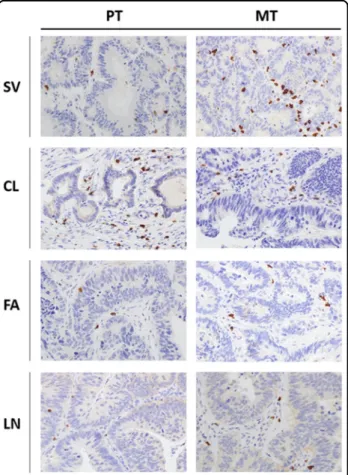
Since the adaptive immune context of CRC has been associated with prognosis, CD3+, CD8+, FoxP3+ and GrzB+ cells were quantified in matched PT and MT tis-sues by IHC. The density of each T-cell subset is shown in Table3. Notably, the density means of CD8+and GrzB+ cells (the principal anti-tumor effectors) recorded in PTs (68 and 36 cells/mm2, respectively) were below the upper limit of the lowest quartile reported in a previous referral study10(235 and 100 cells/mm2, respectively) as well as in our internal validation datasets. Results of total CD3+and FoxP3+cells are also reported in Table3and compatible with the previous report. Example of CD8+T-cell subsets IHC staining (high-powerfield ×40) in PTs and matched MTs is reported in Fig.6. In summary, our results point out a scarce T-cell effectors infiltration into PT samples. An external validation, blinded to clinical information and to our IHC results, was carried out by performing Immunoscores11on three out four PTs (LN failed because of technical issues). To date, Immunoscore is the most objective (through digital pathology and a dedicated image-analysis software) and complex evaluation of the intra-tumoral immune context; it integrates information about types, density and location of tumor-infiltrating lymphocytes. Results of Immunoscore analysis are also shown in Table1. The assessed cases did not present high Immunoscore consistently with our IHC analyses. Density
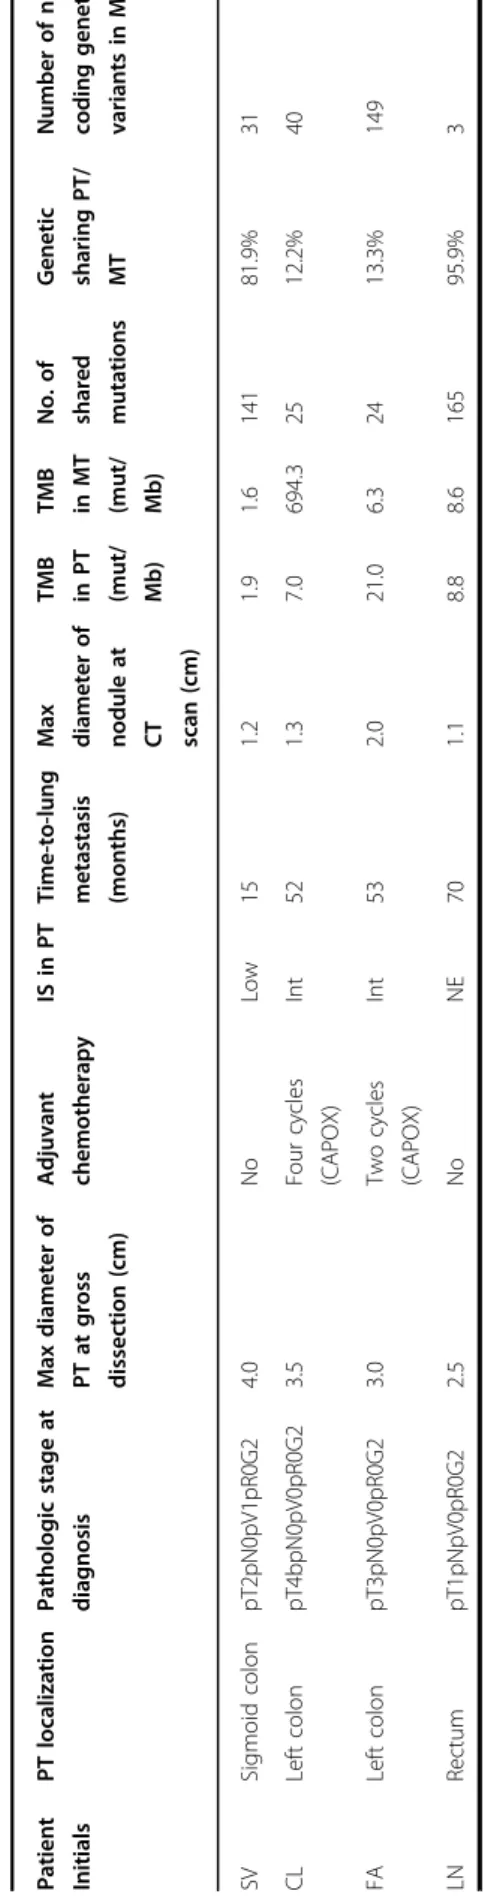
Table 1 Clinicopathological characteristics and genetic concordance in the enrolled patients. Pat ient Init ials PT localiza tion Patho logic stage at diagnos is Max diame ter of PT at gross dissec tion (cm) Adjuva nt chemo therap y IS in PT Time-to-lung metas tasis (months) Max diamete r o f nodule at CT scan (cm) TMB in PT (mut/ Mb) TMB in MT (mut/ Mb) No. of share d mut ations Ge netic sharing PT/ MT Numbe r o f new coding genetic variant s in M T SV Sigm oid co lon pT2p N0pV1pR0 G2 4.0 No Low 15 1.2 1.9 1.6 141 81. 9% 31 CL Left co lon pT4b pN0pV0pR0G2 3.5 Four cy cles (CAPOX) Int 52 1.3 7.0 694.3 25 12. 2% 40 FA Left co lon pT3p N0pV0pR0 G2 3.0 Two cycles (CAPOX) Int 53 2.0 21.0 6.3 24 13. 3% 149 LN Rec tum pT1p NpV0pR0G 2 2.5 No NE 70 1.1 8.8 8.6 165 95. 9% 3 CAPOX capecitabine and oxaliplatin, CT computed tomography, Int intermediate, IS ImmunoScore, MT metastatic tumor, NE not evaluable, PT primary tumor; TMB tumor mutation burden.
Table 2 Summary of patient by patient CRC key driver mutated genes (strong or potential clinical significance according to four-tiered structure of AMP/ACMG consensus).
Patient PT mutated genes MT mutated genes
SV APC, ERBB2, TP53 APC, ERBB2, TP53
CL APC, ERBB2, KRAS, PI3KCA, SMAD4, TP53
ERBB2, TP53
FA RASA1, TP53. APC, BRAF, ERBB2, TP53
LN APC, ERBB2, KRAS (two pathogenic mutations KRASp.Gly12Val and KRASp.Cly13Asp), TP53
APC, ERBB2, KRAS (p. Gly12Val), TP53
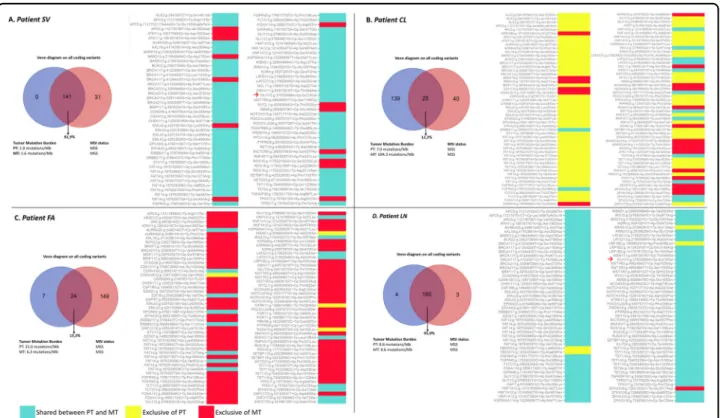
Fig. 3 Primary and metastatic tumor genes comparison. Venn Diagrams, tumor mutation burden (TMB), microsatellite instability (MSI) status (left panel) and descriptive pairwise comparison heatmap of all coding genetic variants of strong or potential/unknown clinical significance (right panel) for each patient (a SV, b CL, c FA, d LN). Cyan indicates shared genetic variations, yellow PT private variations, red MT private variations. Coding variations in MSI-associated genes of potential clinical significance are indicated, if present, with a red arrow. “Variant calling” and “TMB calculation” were based on not related algorithms, thus the real number of coding variants cannot be derived from TMB and vice versa (see Manufacturer Instructions athttps://emea.support.illumina.com/).
Fig. 4 Tumors’ genetic sharing. Venn Diagrams on variants shared by primary tumors (a) and metastatic tumors (b). Benign variants are not highlighted and are excluded from pattern A and pattern B definition (see also Results section). Variants are indicated with gene name, genomic and protein change, their role in cancer, their ClinVar ID with clinical significance interpretation (see also Methods section).
of T-cell subsets in metastases were much more variable and were reported in Table 3 and depicted in Fig. 7. A phenotypic and functional characterization of peripheral lymphocytes is also reported in (Supplemen-tary Files S4–8).
Discussion
The evolutionary dynamics of cancer are highly debated and still largely unknown. It is not clear which are “tim-ings” and “triggers” pushing the evolution of cancer from a single localized mass to a diffuse distant progeny. Our knowledge is very limited and only recently we started to approach the basic research with new technologies and methodologies. To this regard, the extended genomic characterization of primary and paired metastatic lesions from the same individuals represents the most meaningful approach to identify drivers genes or mechanisms involved in tumor progression. In vitro assays and/or animal models, although useful in an exploratory and “hypothesis-generating” sense, are too far from the human mechanistic physiology. Some studies with “high-throughput” DNA sequencing techniques have already compared primary CRC tumors with paired metastases particularly in pluri-metastatic disease4–8; they are het-erogeneous in terms of involved organs, treatments and patients’ characteristics. We have used those data as genomic referral patterns of pluri-metastatic CRC and to compare them with our results (Supplementary Table S1). Comparing our genetic patterns to the pluri-metastatic disease we focused on KRAS and SMAD4. Interestingly, in all studies of pluri-metastatic disease the RAS mutation status of PT is maintained in the matched MT; by con-verse, in some cases KRAS mutations are exclusive events of metastases. In two cases of the present report, this
condition is not satisfied (MT of CL lost KRAS mutation, MT of FA lost a KRAS pathogenic mutation); the scarce immune cell infiltrate would suggest that this phenom-enon is more likely related to “back mutations” rather than to immune-mediated sub-clonal selection. These data were repeated and confirmed with PEPP re-sampling and KRAS mutation PCR-based testing (data not shown). Interestingly, we have recently reported that the inflam-matory status in KRAS mutated mCRC patients does not predict the response to TSPP (thymidylate synthase poly-epitope-peptide) vaccine and, in our series, 2 out of 4 PTs had KRAS mutations and scarce immune cell infiltrate12. SMAD4 is a downstream effector of the transforming growth factor (TGF)-β signaling pathway which has a critical role in CRC progression (angiogenesis and EMT). SMAD proteins (2 and 3) are phosphorylated by activated TGF-β receptors, and thus bind SMAD4. The resulting complex translocate into the nucleus where it acts pre-dominantly as a tumor-suppressor gene of TGF-β-related genes. SMAD4 has been demonstrated, in advanced CRC, as an independent prognostic factor for both reduced disease-free and overall survival13–15. In our cases, we found mutation of SMAD4 only in PT of CL. This is another evidence of“back mutation”. Interestingly, it was also reported that CCL15 secreted from SMAD4-deficient CRC cells recruited CCR1+cells, promoting their meta-static activities to the lung. IHC analysis of lung metas-tases from CRC patients revealed that CCL15 expression was significantly correlated with loss of SMAD4, and that CCL15-positive metastases recruited ~1.9 times more numbers of CCR1+cells than CCL15-negative metastases. Immunofluorescent staining showed that most CCR1+ cells around lung metastases were tumor-associated neutrophils, although a minor fraction was granulocytic Fig. 5 Genetic variants prioritization. Phenolyzer genetic variants prioritization according to a pattern A (previously defined in primary tumors) and b pattern B (previously defined in metastatic tumors).
myeloid-derived suppressor cells16. Future studies are needed to explore in deep the role of SMAD4 genetic variations in both oligometastases and lung-specific metastatic homing.
Venn diagrams and Phenolyzer tools were used to select and depict both genetic changes and their relevance. The most shared and relevant genetic changes occurred in EpCAM (Epithelial cell adhesion molecule), TP53 and caspase-8 in primary tumors and in TP53, ERBB2 and caspase-8 in metastatic ones. Interestingly, EpCAM and caspase-8 have been also involved in regulating pro-liferation, migration and adhesion to lung tissue; their alteration could be, at least in part, responsible for the homing towards lungs17–20. Another observation that arises from our data is that ERBB2 was frequently mutated (3 PTs, all MTs: p.Pro1170Ala). As a non-synonymous coding variant, this Ala variant of the ERBB2 may alter the spatial conformation of the tail region and may affect tyrosine kinase activity21,22. ERBB2 is a member of the ERBB family of membrane tyrosine kinase receptors. Other members are the epidermal growth factor receptor
Table 3 Distribution of T-cell subsets densities (cells/mm 2 ) in primary and metastatic tumors. Prim ary tum ors Meta static tum ors CD 3 + CD 8 + Foxp3 GrzB CD 3 + CD 8 + Fox p3 Gr zB Pat ients TC IM TC IM TC IM TC IM TC IM TC IM TC IM TC IM SV 170 ± 12.0 460 ± 20.5 80 ± 5.5 170 ± 12.5 10 ± 1.4 30 ± 4.2 60 ± 3.7 20 ± 3.1 340 ± 10.2 1350 ± 25. 6 580 ± 20.3 2140 ± 30. 9 0 ± 0.0 20 ± 1.6 35 ± 3.5 50 ± 1.1 CL 140 ± 7.0 875 ± 17.5 150 ± 10. 6 152 ± 12.2 0 ± 0.0 5 ± 0.9 20 ± 0.8 0 ± 0.0 680 ± 15.3 2020 ± 32. 4 8 0 ± 5.8 650 ± 18.7 0 ± 0.0 0 ± 0.3 0 ± 0.4 30 ± 3.2 FA 160 ± 9.5 365 ± 13.1 15 ± 1.2 75 ± 8.4 0 ± 0.0 0 ± 0.0 60 ± 5.1 115 ± 9.6 220 ± 9.9 1015 ± 23. 8 140 ± 10.2 120 ± 8.7 5 ± 0.7 10 ± 1.3 0 ± 0.0 0 ± 0.0 LN 720 ± 16.5 230 ± 10.0 30 ± 2.4 95 ± 11.5 0 ± 0.0 0 ± 0.8 5 ± 0.6 0 ± 1.2 140 ± 7.2 625 ± 20.1 25 ± 2.2 85 ± 5.5 0 ± 0.0 5 ± 0.6 120 ± 11.2 100 ± 9.8 Foxp3 forkhead box P3, GrzB Granzyme B, IM invasive margins, TC tumor core.
Fig. 6 Tumor microenvironment immune context. Representative immunohistochemistry of CD8+cells infiltrating primary (PT, left panels) and matched lung metastatic tumors (MT, right panels) (magnification: ×40 HPF—high-power field) for each patient (SV, CL, FA, LN).
(EGFR), erbB-3 (which lacks kinase domain), and erbB-4. Notably, no ligands for ERBB2 have yet been identified but it can hetero-dimerize with any of the other three ERBB family receptors upon ligand binding. Hetero-dimerization activates autophosphorylation of the cyto-plasmic tyrosine residues, which are able to bind a variety of signaling molecules involved in proliferation, migration and angiogenesis. Evidence have been accumulated on the role of ERBB2 amplification in cancer, while very little is known on the role of point mutations23. It was recently reported that patients with ERBB2-negative breast cancer with the Pro1170Ala polymorphism variant exhibit a decreased survival outcome24. Another study suggested that the Ala variant increased the risk of lung cancer, indicating that it may promote ERBB2 activity25. How-ever, Minn et al.26 and Guttlein et al.27 showed that, in ERBB2 overexpressing breast cancer cell lines, lung colonization is predominant and mediated by SPARC (secreted protein acidic and rich in cysteine).
Although a quite convergent genotypic evolution was observed in case SN and LN, in cases CL and FA, there were much more private events in their metastatic lesions, with a genetic concordance of 12.2% and 13.3%, respec-tively. A similar result was obtained with mutational profiles. The latter (Methods) can be used as a powerful approach to depict the molecular similarity between PTs and MTs, representing the mutational underlying mechanisms specific for each tumor. Patients CL and FA had also high PT/MT differences in mutational profiles.
Interestingly, these patients underwent adjuvant che-motherapy with capecitabine and oxaliplatin (FA two cycles, CL four cycles) (Table1) before surgical resection of lung metastases. CL, who is the unique patient with increasing TMB (from 7.0 to 694.3 mut/Mb) was the patient who received more cycles of chemotherapy. The intriguing hypothesis supported by these data is that the treatment would concur to the heterogeneity of sub-sequent progressing cancer cells.
In the present study, we did a great methodological effort to minimize any external/internal factors interfering with the dynamics under study. Our challenge was to explore what happens from a genetic point of view in patients who devel-oped CRC and a single metastatic lesion to lung. There are no data on such genotype/phenotype correlation in literature. We identified a quite homogeneous oligometastatic model: did it represent the extreme of the metastatic CRC“spectrum” or a specific disease? Surprisingly, our results were consistent with some of the rules which govern the evolution of species28–31. In fact, previous studies demonstrated that metastatic tumors derive from individual clones of heterogeneous primary tumors and follow the rules of Darwinian evolution30,31. Although our model was highly clean and very selected, we cannot establish, due to the small sample size, neither that chemotherapy induces genetic remodeling or back mutations (i.e. patient CL) during cancer evolution nor that these phe-nomena occurred spontaneously (i.e. patient LN). Similarly, we cannot rule out the hypothesis that the common scarce immune cell infiltration could be the consequence of other Fig. 7 Box-and-wisher plots reporting lymphocytes densities (cells/mm2) in tumor cores (TC) and invasive margins (IM) of pooled primary
unknown underlying molecular alterations. Additional studies are needed to understand the forces regulating such genetic/ immunologic trajectories. However, here, we suggest that in the oligometastatic phenotype the tumor clones might follow genetic trajectories (i.e. back mutations in specific genes) which differ from those of clones with polymetastatic prop-erties (Supplementary Table S1). The identification of these differences can be pivotal in identifying prognostic/predictive markers as well as in planning revolutionary therapeutic strategies. Furthermore, while the “effect” of back mutated KRAS in reducing spread/aggressiveness of metastases is expected and reasonable, at this stage, we cannot exclude any compensatory unrevealed alteration justifying the oligometa-static behavior in the other patients without back mutations. It has also to be considered that the low Immunoscore of 3 out of 4 PTs and the scarce immunological infiltrate in all PTs suggest the development of a PT with poor immunogenicity and low propensity to diffusely metastasize but with some affinity for lung colonization.
Therefore,“back mutations” of driver genes and absence of an evolutionary pushing (i.e. immune system recognition) could be responsible of “tuning down” the evolutionary tra-jectory (aggressiveness/progression) of the cancer (Supple-mentary File S9). Future studies are urgently needed to explore the potential clinical applications of this small albeit intriguing piece to cancer evolution mosaic that here we provide. Subjects and methods
Tumor specimens and sequencing
Matched formalin-fixed and paraffin-embedded (FFPE) tissue specimens of primary CRC and single-nodule lung metastases were collected from selected patients. The study was approved by the Scientific Directorate of our Institution (Prof. Gerardo Botti). Written informed con-sent was obtained from patients before starting the translational studies on peripheral blood and FFPE tissues. A complete list of inclusion and exclusion selection cri-teria is reported in Supplementary File S2. 10 mM-serial sections were cut from each tissue specimen for micro-dissection of tumor cells under morphological control. DNA isolation was performed through the MGF03-Genomic DNA FFPE One-Step Kit, according to the manufacturer’s protocol (MagCore Diatech). DNA quality was established in triplicate using the FFPE QC Kit according to the manifacturer’s protocol (Illumina, San Diego, USA). Libraries were prepared with Tru-SigtTMOncology 500 kit, based on target enrichment that analyzes 523 cancer-relevant genes (the list is reported in Supplementary File S10). The assay detects small nucleotide variants (SNVs), indels, splice variants and immunotherapy biomarkers such as tumor mutational burden (TMB) and microsatellite instability (MSI) (see below). Sequencing was performed on an Illumina NovaSeq 6000 (San Diego, USA) platform.
Tumor mutational burden (TMB), microsatellite instability (MSI) and mutational profiles
TMB was measured by exome sequencing according to Chalmers et al.32 counting all coding, somatic base sub-stitutions and indels in the targeted regions, including synonymous alterations.“Variant calling” and “TMB cal-culation” were based on not related algorithms, thus the real number of coding variants cannot be derived from TMB and vice versa (see Manufacturer Instructions at
https://emea.support.illumina.com/). The size of the tar-geted (coding) genomic region was 1.9 Mb. MSI as result of impaired DNA mismatch repair represents a phenotype of clinical significance in CRCs. A highly accurate exome-based predictive model for the MSI phenotype was used, it resides on a statistical MSI classifier from somatic mutation profiles that separates MSI-H (MSI-high) from MSS (MS stable) tumors33. The MSI classifier was trained using 999 exome-sequenced TCGA tumor samples with known MSI status (i.e. assayed from mononucleotide markers), and obtained a positive predictive value of 98.9% and a negative predictive value of 98.8% on an independent test set of 427 samples.
The set of somatic mutations observed in a cancer and distinct patterns of substitution types reflect the specific mutational processes that have been active during its life history. Here, with a descriptive aim, we reported the matched mutational profiles of primary and metastatic lesions displaying the fraction of mutations found in each trinucleotide context. A mutational signature is the com-bination of the frequencies of all base-pair mutation types (C:G>A:T, T:A>G:C, etc.) and theirflanking nucleotides; the convention is to annotate mutations from the pyr-imidine (C>A, T>A, etc.). Thefigures plot all 96 possible combinations of mutation types and neighboring bases. Tumor-infiltrating lymphocytes analysis
Analysis of T-cell subsets in tumor microenvironment was conducted through immunohistochemistry (IHC). Formalin-fixed, paraffin-embedded 4-μm tissue sections of primary CRC and lung metastases were immunostained according to a biotin-streptavidin-peroxidase method (YLEM kit, Rome, Italy). Before incubation with primary antibodies, sections were subjected to (i) routine depar-affinization, (ii) rehydration, (iii) treatment with Dako target retrieval solution, (iv) incubated for 10 min on a hot plate (95–99 °C), (v) allowed to cool for 20 min, (vi) incubated for 10 min in 3% hydrogen peroxide in distilled water, (vii) washed in PBS thrice for 5 min, (viii) incubated with 10% normal horse serum in PBS for 30 min, and (ix) washed with PBS buffer. Treatment with primary anti-bodies [anti-human CD3, anti-human CD8, anti-human FoxP3, anti-human Granzyme B34] was done for 2 h at room temperature. The antigens were then revealed through a biotin-labeled secondary
antibody/streptavidin-peroxidase/diaminobenzidine tetrahydrochloride method: sections were incubated with biotin-labeled secondary antibody (1:30), streptavidin-peroxidase (1:30) for 20 min each, and stained for 5 min with 0.05% 3,3′-diamino-benzidine tetrahydrochloride freshly prepared in 0.05 mol/L Tris-HCl buffer (pH 7.6) containing 0.024% hydrogen peroxidase. Finally, slides were counterstained with hematoxylin, dehydrated, and mounted in Diatex. Negative controls were obtained by substituting the pri-mary antibody with a mouse myeloma protein of the same subclass at the same concentration as the monoclonal antibody. Slides were scanned through an automated scanning microscope and image-analysis system (Genetix, San Jose, CA). Cell density was expressed as cells/mm2. All qualitative and quantitative analyses of T-cell subsets were reviewed by two pathologists (G.B., F.T.) blinded to all clinical information. The tumor microenvironment was morphologically divided into tumor core (TC) and invasive margins (IM) as previously described11.
Bioinformatics analysis and data presentation
Illumina TruSigth Oncology 500 bioinformatics pipeline was applied to analyze sequencing results. A median of 118 million reads were generated for each sample and the coverage in the target region was above manufacturer’s suggested threshold of 150X. Sequence data were aligned to the human reference genome GRCh37 (http://www. ncbi.nlm.nih.gov/projects/genome/assembly/grc/human/ index.shtml) using the Burrows–Wheeler Aligner with
default parameters35. Both population- and cancer-specific variants were intersected with GENCODE, dbNSFP, ICGC-PCAWG, COSMIC, 1000Genomes, ClinVar, CancerMine, OncoScore, CIViC, CBMDB data-bases to assess the clinical significance of the found mutations. Variants werefiltered with unmatched normal datasets and removed if the global minor allele frequency was <1%. The prioritization of variants was done according to a four-tiered structure, adopting the joint consensus recommendation by AMP/ACMG36. Variants of strong clinical significance in cancer were defined considering items with strongest evidence levels in the database for (i) clinical interpretations of variants in cancer (CIViC, civicdb.org) and (ii) Cancer Biomarkers (cancergenomeinterpreter.org/biomarkers). Results about variants shared between PTs and metastatic tumors (MTs) are shown with ID according to ClinVar; however, variants were also manually curated to exclude residual false positives. The scenario in which interpretation for the clinical consequence of a variant was“benign”, but the review status quality was scored <2/4 or reporting con-flicting results, was defined as “probably benign”. The TP53 p.Pro72Arg variant was reported in this study as potentially relevant for CRC. In fact, while the codon 72 SNPs have limited impact on cancer risk for WT P53,
many different research groups showed independently that this SNP markedly influences the activity of tumor-derived mutant forms of p53 (TP53) both in vitro and in vivo37–41. Complete sequences results can be accessed upon a signed justified request sent to genetica@cen-troames.it and ale.otto@libero.it.
The genetic sharing was indicated as the percent of mutational concordance in matched PTs and derivative MTs in all coding variations. Venn Diagrams were depicted in order to plot intersections among genetic results and Phenolyzer was used to evidence relevance and relationships between any“seed” genetic variants and “secondary” ones.
Phenolyzer is a computational tool that prioritize genes on the basis on updated existing knowledge (protein–protein interactions, sharing of biological path-ways or gene family, gene–gene transcriptional regulation, etc.). It integrates OMIM, Orphanet, ClinVar, Gene Reviews and GWAS Catalog as gene-disease databases. However, for a complete methodology description see Yang et al.42Results are expressed through a score system and a network visualization tool that integrates gene–gene and gene–cancer relationships providing readers with a panoramic view of the interactional context.
The disease-free interval (DFI) was measured in months and it represented the time elapsed from the surgical removal of PTs to the occurrence of lung metastases.
Densities of T-cell subsets were expressed as cells/mm2 and results represented with the arithmetic averages ± 2 standard deviations (SD). Cells were also manually counted by two Pathologists three times each. Box-and-wisher plots graphs with means ± 95% confidence inter-vals (CI) were also reported to provide an overview of results’ heterogeneity as well as to depict potential trends (means were compared with the t-test with Welch cor-rection in case of unequal variances, P < 0.05 was con-sidered statistically significant).
Acknowledgements
We acknowledge the LILT (Lega Italiana per la Lotta contro i Tumori– sezione di Napoli) for the precious collaboration and Mrs. Antonietta Nacca for the financial support.
Author details
1Department of Abdominal Oncology, SSD-Innovative Therapies for
Abdominal Cancers, Istituto Nazionale Tumori di Napoli, IRCCS“G. Pascale”, , Via M. Semmola, 80131 Naples, Italy.2AMES-Centro Polidiagnostico Strumentale,
Srl, Naples, Italy.3Department of Precision Medicine, University of Campania“L. Vanvitelli” , Via L. De Crecchio, 7, 80138 Naples, Italy.4Functional Genomics,
Istituto Nazionale Tumori, IRCCS“G. Pascale” , Via M. Semmola, 80131 Naples, Italy.5Department of Thoracic Surgery and Oncology, Istituto Nazionale Tumori
di Napoli, IRCCS“G. Pascale” , Via M. Semmola, 80131 Naples, Italy.6INSERM, Laboratory of Integrative Cancer Immunology, Equipe Labellisée Ligue Contre le Cancer, Sorbonne Université, Université Sorbonne Paris Cité, Université Paris Descartes, Université Paris Diderot, Centre de Recherche des Cordeliers, 75006 Paris, France.7Center for Radiological Research, Department of Radiation
Oncology, Columbia University Medical Center, New York, New York, NY, USA.
8Department of Pathology, Istituto Nazionale Tumori di Napoli, IRCCS“G.
10Department of Abdominal Oncology, Clinical and Experimental Abdominal
Oncology, Istituto Nazionale Tumori di Napoli, IRCCS“G. Pascale”, Via M. Semmola, 80131 Naples, Italy.11Head and Neck Cancer Medical Oncology Unit,
Istituto Nazionale Tumori di Napoli, IRCCS“G. Pascale”, Via M. Semmola, 80131 Naples, Italy.12Biogem Scarl, Institute of Genetic Research, Laboratory of
Precision and Molecular Oncology, Ariano Irpino, Italy Conflict of interest
The authors declare that they have no conflict of interest.
Publisher’s note
Springer Nature remains neutral with regard to jurisdictional claims in published maps and institutional affiliations.
Supplementary Information accompanies this paper at (https://doi.org/
10.1038/s41419-020-2480-6).
Received: 31 December 2019 Revised: 10 April 2020 Accepted: 10 April 2020
References
1. Herszényi, L. & Tulassay, Z. Epidemiology of gastrointestinal and liver tumors. Eur. Rev. Med. Pharmacol. Sci. 14, 249–258 (2010).
2. Altekruse, S. F. et al. SEER Cancer Statistics Review, 1975–2007 (National Cancer Institute, Bethesda, MD, 2010).http://seer.cancer.gov. Accessed 30 September 2019.
3. Hellman, S. & Weichselbaum, R. R. Oligometastases. J. Clin. Oncol. 13, 8–10 (1995).
4. Brannon, A. R. et al. Comparative sequencing analysis reveals high genomic concordance between matched primary and metastatic colorectal cancer lesions. Genome Biol. 15, 454 (2014).
5. Lee, S. Y. et al. Comparative genomic analysis of primary and synchronous metastatic colorectal cancers. PLoS ONE 9, e90459 (2014).
6. Kim, R. et al. Co-evolution of somatic variation in primary and metastatic colorectal cancer may expand biopsy indications in the molecular era. PLoS ONE 10, e0126670 (2015).
7. Vignot, S. et al. Comparative analysis of primary tumour and matched metastases in colorectal cancer patients: evaluation of concordance between genomic and transcriptional profiles. Eur. J. Cancer 51, 791–799 (2015). 8. Kovaleva, V. et al. Spatio-temporal mutation profiles of case-matched
color-ectal carcinomas and their metastases reveal unique de novo mutations in metachronous lung metastases by targeted next generation sequencing. Mol. Cancer 15, 63 (2016).
9. Schreiber, R. D., Old, L. J. & Smyth, M. J. Cancer immunoediting: integrating immunity’s roles in cancer suppression and promotion. Science 331, 1565–1570 (2011).
10. Nosho, K. et al. Tumour-infiltrating T-cell subsets, molecular changes in col-orectal cancer, and prognosis: cohort study and literature review. J. Pathol. 222, 350–66 (2010).
11. Pagès, F. et al. International validation of the consensus Immunoscore for the classification of colon cancer: a prognostic and accuracy study. Lancet 391, 2128–2139 (2018).
12. Correale, P. et al. Systemic inflammatory status predict the outcome of k-RAS WT metastatic colorectal cancer patients receiving the thymidylate synthase poly-epitope-peptide anticancer vaccine. Oncotarget 9, 20539–20554 (2018). 13. Kawaguchi, Y. et al. Mutation status of RAS, TP53, and SMAD4 is superior to
mutation status of RAS alone for predicting prognosis after resection of col-orectal liver metastases. Clin. Cancer Res.https://doi.org/10.1158/1078-0432.
CCR-19-0863(2019).
14. Oyanagi, H. et al. SMAD4 alteration associates with invasive-front pathological markers and poor prognosis in colorectal cancer. Histopathology 74, 873–882 (2019).
15. Mehrvarz Sarshekeh, A. et al. Association of SMAD4 mutation with patient demographics, tumor characteristics, and clinical outcomes in colorectal cancer. PLoS ONE 12, e0173345 (2017).
16. Yamamoto, T. et al. Loss of SMAD4 promotes lung metastasis of colorectal cancer by accumulation of CCR1+ tumor-associated neutrophils through CCL15-CCR1 axis. Clin. Cancer Res. 23, 833–844 (2017).
17. de Wit, S. et al. The detection of EpCAM(+) and EpCAM(-) circulating tumor cells. Sci. Rep. 5, 12270,https://doi.org/10.1038/srep12270(2015).
18. Huang, L. et al. Functions of EpCAM in physiological processes and diseases. Int J. Mol. Med 42, 1771–1785 (2018).
19. Stupack, D. G. Caspase-8 as a therapeutic target in cancer. Cancer Lett. 332, 133–140 (2013).
20. Barbero, S. et al. Caspase 8 association with the focal adhesion complex promotes tumor cell migration and metastasis. Cancer Res. 69, 3755–3763 (2009).
21. Zhang, X., Gureasko, J., Shen, K., Cole, P. A. & Kuriyan, J. An allosteric mechanism for activation of the kinase domain of epidermal growth factor receptor. Cell 125, 1137–1149 (2006).
22. Wood, E. R. et al. A unique structure for epidermal growth factor receptor bound to GW572016 (Lapatinib): relationships among protein conformation, inhibitor off-rate and receptor activity in tumor cells. Cancer Res. 64, 6652–6659 (2004).
23. Mazières, J. et al. Lung cancer that harbors an HER2 mutation: epidemiologic characteristics and therapeutic perspectives. J. Clin. Oncol. 31, 1997–2003 (2013).
24. Si, P. et al. HER2 Pro1170Ala polymorphism is associated with decreased survival rate in HER2-negative breast cancer. Oncol. Lett. 13, 3793–3798 (2017). 25. Jo, U. H. et al. The genetic polymorphisms of HER-2 and the risk of lung cancer
in a Korean population. BMC Cancer 8, 359 (2008).
26. Minn, A. J. et al. Genes that mediate breast cancer metastasis to lung. Nature 436, 518–524 (2005).
27. Güttlein, L. N. et al. Predictive outcomes for HER2-enriched cancer using growth and metastasis signatures driven by SPARC. Mol. Cancer Res. 15, 304–316 (2017).
28. Cairns, J. Mutation selection and the natural history of cancer. Nature 255, 197–200 (1975).
29. Nowell, P. C. The clonal evolution of tumor cell populations. Science 194, 23–28 (1976).
30. Huber, C. D., Kim, B. Y., Marsden, C. D. & Lohmueller, K. E. Determining the factor driving selective effects of new nonsynonymous mutations. Proc. Natl Acad. Sci. USA 114, 4465–4470 (2017).
31. Basener, W. F. et al. The fundamental theorem of natural selection with mutations. J. Math. Biol. 76, 1589–1622 (2018).
32. Chalmers, Z. R. et al. Analysis of 100,000 human cancer genomes reveals the landscape of tumor mutational burden. Genome Med. 9, 34 (2017). 33. Cortes-Ciriano, I., Lee, S., Park, W. Y., Kim, T. M. & Park, P. J. A molecular portrait
of microsatellite instability across multiple cancers. Nat. Commun. 8, 15180 (2017).
34. Mazzaschi, G. et al. Low PD-1 expression in cytotoxic CD8(+) tumor-infiltrating lymphocytes confers an immune-privileged tissue microenvironment in NSCLC with a prognostic and predictive value. Clin. Cancer Res. 24, 407–419 (2018).
35. Li, H. & Durbin, R. Fast and accurate short read alignment with Burrows-Wheeler transorfm. Bioinformatics 25, 1754–1760 (2009).
36. Li, M. M. et al. Standards and guidelines for the interpretation and reporting of sequence variants in cancer: a joint consensus recommendation of the association for molecular pathology, American Society of Clinical Oncology, and College of American Pathologists. J. Mol. Diagn. 19, 4–23 (2017). 37. Dumont, P., Leu, J. I., Della Pietra, A. C. 3rd, George, D. L. & Murphy, M. The
codon 72 polymorphic variants of p53 have markedly different apoptotic potential. Nat. Genet. 33, 357–365 (2003).
38. Jeong, B. S., Hu, W., Belyi, V., Rabadan, R. & Levine, A. J. Differential levels of transcription of p53-regulated genes by the arginine/proline polymorphism: p53 with arginine at codon 72 favors apoptosis. FASEB J. 24, 1347–1353 (2010). 39. Banks, L. p53 polymorphic variants at codon 72 exert different effects on cell
cycle progression. Int. J. Cancer 108, 196–199 (2004).
40. Pim, D. et al. p53 mutation arising in Arg72 allele in the tumorigenesis and development of carcinoma of the urinary tract. Clin. Cancer Res. 8, 1192–1195 (2002).
41. Basu, S. et al. Mutant p53 controls tumor metabolism and metastasis by regulating PGC-1α. Genes Dev. 32, 230–243 (2018).
42. Yang, H., Robinson, P. N. & Wang, K. Phenolyzer: phenotype-based prioritiza-tion of candidate genes for human diseases. Nat. Methods 12, 841–843 (2015).