PoS(NuFact2019)087
M. L. Wong∗†Laboratoire de Physique de Clermont on behalf of the AlCap collaboration
E-mail:[email protected]
COMET (J-PARC) and Mu2e (Fermilab) are two experiments currently under construction that aspire to discover the neutrino-less muon to electron conversion BSM process. As a cooperation between the two experiments, AlCap was created to measure low energy particle emission spectra after nuclear muon capture in target materials aluminium and titanium. These measurements are important for understanding noise hit rates and radiation damage in COMET and Mu2e’s detector systems. AlCap also explored muonic x-ray measurement methods that could be used for muon normalization. This talk will report the preliminary results collected at the Paul Scherrer Institut(PSI) in Switzerland during the 2015 run.
The 21st international workshop on neutrinos from accelerators (NuFact2019) August 26 - August 31, 2019
Daegu, Korea
∗Speaker.
PoS(NuFact2019)087
1. Introduction
Nuclear muon capture on aluminium
µ−+2713Al→ νµ+ X + {n, p, d,t, α} (1.1)
is a dangerous background process for µ−to e−conversion experiments COMET[1] and Mu2e[2]. Their tracking detectors may have to be shielded depending on the rate and energy spectrum of the emitted protons after nuclear muon capture. This deteriorates the momentum resolution, while emitted neutrons can induce noise and electronic damage. Proton emission rate data for Al would be able to conclusively determine the need for such shielding but unfortunately, muon cap-ture studies that were done in the past[3] had much higher energy threshold. Nuclear activation experiments[4] gave estimates of proton emission rates but with large errors. The best estimate so far was from charged particle emission spectra for silicon[5] as an approximate replacement for Al but Hungerford[6] notes that27Al would have much less charged particle emission. Therefore the
urgent need for new measurement.
Figure 1: Experimental layout
Type Thickness [µm] DAQ run time [hr]
Al 50 25.2
Al 100 25.6
Si 52 8.4
Ti 50 10.4
Table 1: Run time of other target materials.
The AlCap experiment ran with ∼26 MeV/c muons at a rate of 6-8 kHz from the PSI πE1 beam line. The setup consists of a high-purity germanium (HpGe) detector for muonic x-ray energy and time measurement along with two silicon detectors located perpendicular to the beam direction and labelled left- and right-silicon in Figure1. The left(right) silicon detector consists of a thin, 52(53) µm and thick 1.535(1.545) mm sub-detector and for the right, a working veto1of 1.5 mm thickness. Muons pass through a silicon entrance detector, then a collimator before hitting the target. The analysis here use data from the Al 50 µm target. Other target data are shown in Table1.
2. Analysis
Muons that enter through the entrance detector are defined by a 200 keV energy threshold cut to separate them from electrons. Muon pile-up events are those that occur within ±10 µs and they are rejected to prevent double counting of muonic x-rays and charged particles. Some muons scatter
PoS(NuFact2019)087
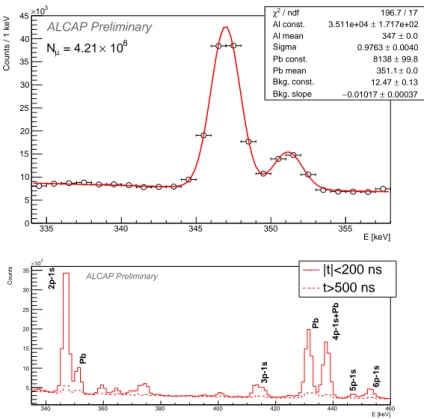
from the collimator and/or chamber walls but a vast majority reach the target. The muon beam wasoptimized for stopping muons in the center of the target by maximizing the x-ray count. Muons stopped in the Al atomic E-field emit x-rays of various energies before reaching the ground state. They can then either decay in orbit or be captured by the nucleus. Figure2 shows the strongest
/ ndf
2
χ 196.7 / 17 Al const. 3.511e+04 ± 1.717e+02 Al mean 347 ± 0.0 Sigma 0.9763 ± 0.0040 Pb const. 8138 ± 99.8 Pb mean 351.1 ± 0.0 Bkg. const. 12.47 ± 0.13 Bkg. slope −0.01017 ± 0.00037 335 340 345 350 355 E [keV] 0 5 10 15 20 25 30 35 40 45 3 10 × Counts / 1 keV / ndf 2 χ 196.7 / 17 Al const. 3.511e+04 ± 1.717e+02 Al mean 347 ± 0.0 Sigma 0.9763 ± 0.0040 Pb const. 8138 ± 99.8 Pb mean 351.1 ± 0.0 Bkg. const. 12.47 ± 0.13 Bkg. slope −0.01017 ± 0.00037 8 10 × = 4.21 µ N ALCAP Preliminary 340 360 380 400 420 440 460 E [keV] 5 10 15 20 25 30 35 3 10 × Counts |t|<200 ns t>500 ns 2p-1s Pb 3p-1s Pb 4p-1s+Pb 5p-1s 6p-1s ALCAP Preliminary
Figure 2: (top) Energy spectrum in the vicinity of the µAl 2p-1s transition. Pile-up protection time cut is used to prevent double counting. (bottom) Other µAl x-ray peaks that transition down to the 1s orbital.
peak from µAl 2p-1s transition with an emission probability per muon stop, P = 0.798 ± 0.008[7]. A background from µ206Pb at about 351 keV can also be accounted for by performing a fit with a double Gaussian(with shared σ ) and approximate the Compton background with an exponential function. The number of detected 2p-1s x-rays from Figure2is 85337 ± 1766 obtained by taking the integral of the Gaussian. The number of stopped muons is then Nstop= (161 ± 4) × 106from
Equation2.1.
Nstop=
C
ε × P (2.1)
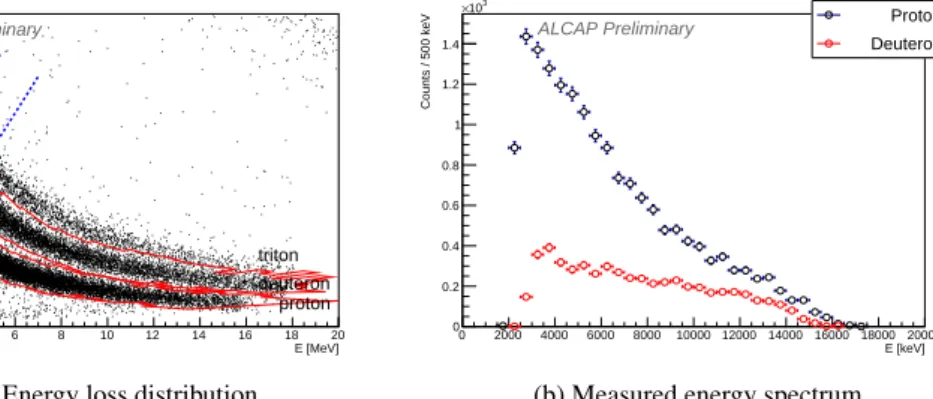
where the HpGe detector acceptance at 347 keV is ε = 6.63 ± 0.10 × 10⁻⁴ obtained from152Eu efficiency calibration. For charged particles, we start from the energy loss plot drawn by taking the energy deposit of the silicon thin detector, dE against total energy deposit, E. Figure3shows the plot for the right detector with proton and deuteron selection bands. The selection bands are constructed by first rotating the log10of both axes 45◦counterclockwise
PoS(NuFact2019)087
(E, dE) → ( 1p(2)(log10E− log10dE, 1
p(2)(log10E+ log10dE)) (2.2) and then applying a triple Gaussian and a constant fit. (µ, σ ) from the fit results for all the ytrans slices can be used for varying the PID cut tightness. Figure3is obtained with selection cuts
from Table2. 0 2 4 6 8 10 12 14 16 18 20 E [MeV] 0 0.5 1 1.5 2 2.5 3 3.5 dE [MeV] ALCAP Preliminary width σ 3 proton deuteron triton
(a) Energy loss distribution
0 2000 4000 6000 8000 10000 12000 14000 16000 18000 20000 E [keV] 0 0.2 0.4 0.6 0.8 1 1.2 1.4 3 10 × Counts / 500 keV Proton Deuteron ALCAP Preliminary
(b) Measured energy spectrum
Figure 3: (left) Identification of the proton and deuteron bands in the left plot. A sample rotated-bin is indicated by dashed blue lines. (right) After the PID 3σ and other selection cuts are applied, the Edetectorspectrum for protons and deuterons are shown.
Reject pileup time tPP<10 µs
Accept coincidence time |t2− t1| <100 ns Accept lifetime t2>500 ns
Accept PID within 3σ
Reject veto e3! = 0
Table 2: Selection cuts for reducing accidentals and contamination from muonic lead capture. Cut efficiencies are close to 0.99.
3. Energy Unfolding & Systematic Errors
One of the challenges was due to charged particles of interest losing energy when traversing target material. It is necessary to employ unfolding techniques[8] to recover the initial energies. Using this method, a transfer matrix, M which is a map of probabilities relating Edetector with
Etruthis generated with Monte Carlo using GEANT4.10.03.p02 which also includes the Si detector
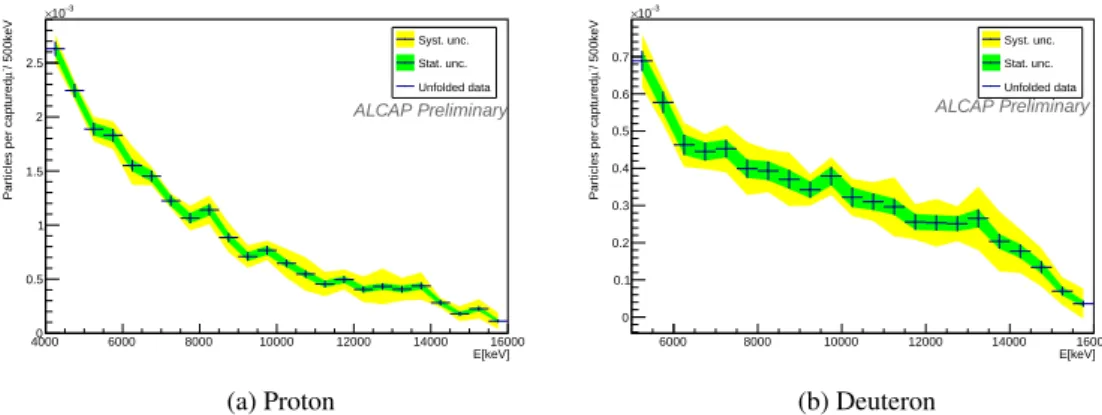
acceptance. Muon stopping positions are inferred from active Si data which are assumed to be initial positions of emitted charged particles. Initial energies generated for protons are uniformly distributed from 0 to 20 MeV and up to 34 MeV for deuterons. The transfer matrix, M is generated from Etruthand Edetector and used for unfolding. Figure4shows the unfolded results for protons
and deuterons normalised to the number of muons captured by the Al nuclei (probability of muons captured from orbit[9] is 0.609.) and the lifetime cut is corrected with a factor of 0.56.
PoS(NuFact2019)087
4000 6000 8000 10000 12000 14000 16000 E[keV] 0 0.5 1 1.5 2 2.5 3 − 10 × / 500keV -µParticles per captured
Syst. unc. Stat. unc. Unfolded data ALCAP Preliminary (a) Proton 6000 8000 10000 12000 14000 16000 E[keV] 0 0.1 0.2 0.3 0.4 0.5 0.6 0.7 3 − 10 × / 500keV -µ
Particles per captured
Syst. unc. Stat. unc. Unfolded data ALCAP Preliminary ALCAP Preliminary (b) Deuteron
Figure 4: The unfolded energy spectrum for protons and deuterons.
The systematic errors are calculated for each 500 keV bin. For Gaussian-like distributions like coincidence time and PID, the discrepancy between 1σ and 3σ after unfolding is regarded as systematic errors. Also, charged particle of different energies have different arrival time spreads and therefore the cuts need to be applied separately with 1 MeV bins. For lifetime cuts, the 300 ns (correction factor 0.71) and 500 ns cut results are compared. These are shown as yellow bands in Figure4. Unfolding uncertainties are still under evaluation. Our detectors could measure energies down to 2 MeV but the energies of protons below 4 MeV and deuterons below 5 MeV could not be reliably unfolded due to missing entries in the transfer matrix so we do not show them.
References
[1] G. Adamov et al. COMET Phase-I Technical Design Report. submitted to PTEP, 2018. [2] R. H. Bernstein. The Mu2e Experiment. Front.in Phys., 7:1, 2019.
[3] K. S. Krane, T. C. Sharma, L. W. Swenson, D. K. McDaniels, P. Varghese, B. E. Wood, R. R. Silbar,
H. D. Wohlfahrt, and C. A. Goulding. Energetic Charged Particle Spectrum Following µ−Capture By
Nuclei. Phys. Rev., C20:1873–1877, 1979.
[4] A. Wyttenbach, P. Baertschi, S. Bajo, J. Hadermann, K. Junker, S. Katcoff, E. A. Hermes, and H. S. Pruys. Probabilities of Muon Induced Nuclear Reactions Involving Charged Particle Emission. Nucl. Phys., A294:278–292, 1978.
[5] Stanley E. Sobottka and Edward L. Wills. Energy Spectrum of Charged Particles Emitted Following Muon Capture in Si28. Phys. Rev. Lett., 20(12):596, 1968.
[6] V. Hungerford. Comments on Proton Emission after Muon Capture. MECO Note 34 (1999), 2018. [7] Stocki Trevor J. Moftah Belal A. Measday, David F. and Heywood Tam. Gamma rays from muon
capture in Al-27 and natural Si. Phys. Rev., C76:035504, 2007.
[8] T. Adye. Unfolding algorithms and tests using RooUnfold. In Proceedings, PHYSTAT 2011 Workshop on Statistical Issues Related to Discovery Claims in Search Experiments and Unfolding,
CERN,Geneva, Switzerland 17-20 January 2011, pages 313–318, Geneva, 2011. CERN, CERN. [9] Measday D. F. Suzuki, T. and J. P. Roalsvig. Total nuclear capture rates for negative muons. Phys. Rev.