HAL Id: hal-01544780
https://hal.archives-ouvertes.fr/hal-01544780
Submitted on 22 Jun 2017HAL is a multi-disciplinary open access archive for the deposit and dissemination of sci-entific research documents, whether they are pub-lished or not. The documents may come from teaching and research institutions in France or abroad, or from public or private research centers.
L’archive ouverte pluridisciplinaire HAL, est destinée au dépôt et à la diffusion de documents scientifiques de niveau recherche, publiés ou non, émanant des établissements d’enseignement et de recherche français ou étrangers, des laboratoires publics ou privés.
Contribution of high-resolution remotely sensed
thermal-infrared imagery to high-throughput field
phenotyping of an apple progeny submitted to water
constraints
N. Virlet, D. Gomez Candon, V.. Lebourgeois, S. Martinez, A. Jolivot, P.E.
Lauri, E. Costes, S. Labbe, J Regnard
To cite this version:
N. Virlet, D. Gomez Candon, V.. Lebourgeois, S. Martinez, A. Jolivot, et al.. Contribution of high-resolution remotely sensed thermal-infrared imagery to high-throughput field phenotyping of an apple progeny submitted to water constraints. XXIX International Horticultural Congress (IHC2014), Aug 2014, Brisbane, Australia. pp.243-250, �10.17660/ActaHortic.2016.1127.38�. �hal-01544780�
243
Contribution of high resolution remotely sensed thermal-infrared
imagery to high-throughput field phenotyping of an apple progeny
submitted to water constraints
N. Virlet1, D. Gómez-Candón1, V. Lebourgeois5, S. Martinez2, A. Jolivot4, P.É. Lauri2, E. Costes2, S. Labbé3, J.L. Regnard1
1
Montpellier SupAgro, UMR Amélioration Génétique et Adaptation des Plantes méditerranéennes et tropicales (AGAP), Av. Agropolis, 34398 Montpellier Cedex 5, France
2
INRA, UMR AGAP, Av. Agropolis, 34398 Montpellier Cedex 5, France
3
IRSTEA, UMR Territoires, Environnement, Télédétection et Information Spatiale (TETIS), 500 rue J.F. Breton, 34093 Montpellier Cedex 5, France
4
CIRAD, UMR TETIS, 500 rue J.F. Breton, 34093 Montpellier Cedex 5, France
5
CIRAD, UMR TETIS, Ligne-Paradis, 7 Ch. de l’IRAT, 97410 Saint-Pierre, France
Abstract
The genetic variability of fruit trees in response to drought stress is scarcely studied. As adaptation of scion varieties to abiotic constraints constitutes a new challenge for fruit production, in particular where water scarcity is likely to occur, development of high-throughput phenotyping strategies applicable in the field to assess the tree response to soil drought among large populations is needed, overcoming the limitations of usual in planta measurements. In this research remotely-sensed images were acquired by ultra-light aircraft (ULA) and unmanned aerial vehicle (UAV) during 4 years in a field trial where an apple progeny (122 hybrids) was studied under contrasted summer irrigation regimes. Ortho-images were simultaneously acquired in visible (RGB), near infrared (NIR) and thermal infrared (TIR) bands. After orthorectification, georeferencing and mosaicking, RGB and NIR images were used to compute different vegetation indices over the field trial, while TIR imaging allowed extracting the vegetation surface temperature (Ts), which was calibrated at ground level by using hot and cold reference targets. The Morans’ water deficit index (WDI), which combines the surface minus air temperature (Ts-Ta) and the Normalized Difference Vegetation Index (NDVI), was used as stress phenotypic variable. WDI estimates the ratio of actual to maximal evapotranspiration (WDI = 1–ETact/ETmax) in discontinuous plant covers. Like the Ts-Ta variable it significantly discriminated the tree water statuses and genotypes. On the basis of different plant- and image-based indices, individual tree behaviour trends (isohydric vs. anisohydric) can be distinguished among the progeny, irrespective of tree vigour. This opens potential applications for plant breeding, and genetic bases of apple tree response to water stress are currently investigated through quantitative trait locus (QTL) detection. Making use of ULA with flights performed at 40-60 m altitude made it possible to strongly improve the TIR image resolution (~10cm) and to limit the number of vegetation/soil mixed pixels. However, it will require careful image post-treatment, possibly including classification and/or segmentation.
Keywords: canopy surface temperature, drought stress, genetic variability, image
resolution, Malus x domestica, transpiration, water deficit index
Acta Hortic. 1127. ISHS 2016. DOI 10.17660/ActaHortic.2016.1127.38. pp. 243-250. 243
XXIX IHC – Proc. Int. Symp. on Plant Breeding in Horticulture Eds.: N. Onus and A. Currie
244 INTRODUCTION
According to current climate change models, increases in average temperatures are expected, with more frequent episodes of drought, notably in the Mediterranean area. Tolerance to abiotic stress resulting from changing climate will necessarily be taken into account in future breeding programmes. As water is of utmost importance for plant yield, optimizing the water use through better plant water use efficiency and/or drought tolerance is becoming a more and more important target in numerous crops (Condon et al., 2004). In fruit trees, tolerance to drought particularly needs to be thoroughly considered because sustainability of fruit production depends on the availability of water resources (Šircelj et al., 2007). However, to date, research on the fruit tree water budget mainly focuses on optimal irrigation scheduling and use of water (Naor, 2006), and most fruit breeding programmes do not explicitly consider responses to abiotic stresses.
Thermal infrared (TIR) remote sensing is increasingly being used to assess crop transpiration and/or drought stress in many crops. As the temperature of plant organs reflects their energy balance, measurement of leaf temperature permits indirect estimation of the flux of water loss and stomatal aperture (Maes and Steppe, 2012). Typically, an increase in the difference between leaf surface temperature and air temperature is a sign of a decrease in transpiration. Stomatal closure under water deficit can occur over more or less short term, depending on the species, and a certain variability of water loss regulation has been found at inter-specific level. Tardieu and Simonneau (1998) classified plant behaviors into two main categories, isohydric and anisohydric, on the basis of stomatal responses. Facing water deficits and/or drier atmospheric conditions, isohydric plants efficiently reduce stomatal conductance upon decreasing soil water potentials (Ψs), which allows water saving and maintaining a moderately negative midday leaf water potential (Ψl), regardless of drought conditions. In contrast, anisohydric plants allow the midday Ψl to decrease more strongly upon higher evaporative demand and/or lower Ψs, while preservation of stomatal aperture permits a continuous carbon acquisition (McDowell et al., 2008). Varietal differences of stomatal conductance and water use efficiency in apple were shown in field conditions (Massonnet et al., 2007), and variability of stomatal closure among a whole apple progeny was further demonstrated in response to vapor pressure deficits (Regnard et al., 2008). TIR imagery was proposed as an approach for phenotyping tolerance to water stress (Jones et al., 2009). More generally non-invasive remotely-sensed phenotyping methods based on multi-spectral or hyper-spectral imagery show promise as capable of screening a wide range of individuals in a short period of time (Berni et al., 2009; González-Dugo et al., 2012; White et al., 2012). These high-throughput approaches are compatible with next-generation sequencing technologies, allowing genome-wide and high-density genotyping (Fiorani and Schurr, 2013).
In this research, we assume that genetic variability of transpiration regulation can be phenotyped in the field among an apple progeny, in response to various soil drought levels. For this purpose, we made use of different image-based vegetation and stress indices in order to assess (i) sensitivity of these variables to soil drought and genotype effects, and (ii) relevance to assess the tree adaptation to drought. As the presence of mixed soil–plant pixels is a recurring problem when thermal imagery is applied for phenotyping plant heterogeneous covers (Hackl et al., 2012; Jones and Sirault, 2014), we also began to assess the improvement that could result from the use of unmanned aerial vehicle (UAV). Making use of this aerial vector, more flexible than ultra-light aircraft (ULA), potentially opens the door to high-resolution multi-spectral imagery (Chapman et al., 2014, Gómez-Candón et al., 2014).
245 MATERIALS AND METHODS
Field set-up
The apple tree progeny studied derived from a ‘Starkrimson’ x ‘Granny Smith’ cross and was known for genetic variability in stomatal behaviour in response to vapour pressure deficits (Regnard et al., 2009). In 2007, 122 hybrids and the 2 parents grafted onto M9 rootstock were randomly planted, 4 replicates each, in an experimental field (6,400 m²) at the INRA Mauguio experimental station (southeast France, 43°36’N, 03°58’E). Trees were disposed along 10 rows orientated northwest–southeast, with a 5x2m spacing. During each summer, a drought treatment was applied on 2 replicates per hybrid, resulting in progressive water stress (WS). Five WS tree rows alternated with 5 well watered rows (WW) where irrigation was scheduled according to soil water potential (s higher than -0.08 MPa). Automated soil resistivity profiling conducted in March 2009 showed that the soil of the trial plot (at depths of 0-50 cm and 50-100 cm) was spatially homogeneous in terms of its water-holding capacity. The field micro-climate was monitored using meteorological sensors that recorded global radiation (Rg), air temperature (Ta), air humidity (HR), wind speed (u) and rainfall. s was measured at depths 30 and 60 cm regularly and just before the flights by WatermarkTM probes. Aluminium targets precisely located by differential GPS (DGPS) were placed at the periphery and at the centre of the field for image geolocation. Ground surface temperatures were measured on cold target (Styrofoam: 2*2 m), hot target (dark painted wood: 2*2 m), bare soil and wet soil, and used to correct atmospheric effects on the airborne TIR images. Thermal resolution was 0.1°C and precision 0.75°C.
Image acquisition and treatment
Whatever the aerial vector used for image acquisition (ULA or UAV), the steps for image treatment comprised calibration, ortho-rectification, georeferencing and mosaicking. These steps are shown in Fig. 1 and detailed in Virlet et al. (2014). Images of surface temperature (Ts) minus air temperature (Ta) were obtained by subtracting from each pixel value of TIR images the air temperature acquired simultaneously.
In 2010 and 2011, the imaging system consisted of an ULA equipped with two EOS 500D digital cameras (15.1 megapixels, Canon, Tokyo, Japan) and one B20HSV TIR camera (320*240 pixels, FLIR Systems Inc., Wilsonville, USA). All cameras pointed in the same vertical direction, and their shutters were synchronized to a single trigger. One camera acquired images in RGB, the second was modified according to Lebourgeois et al. (2008) to obtain NIR images. For the TIR camera, radiation over the 7.5–13 µm spectrum was considered equivalent to Ts, assuming a target emissivity equal to 1. The TIR images had a radiometric resolution of 0.1°C and an absolute precision of 2°C. Most images were acquired at an elevation of 300m and had a 3-cm resolution in RGB and NIR, and a 30-cm resolution in TIR. The whole orchard was covered by one or two images.
In 2012 and 2013 images were acquired using a MikroKopter UAV equipped with two Sigma DP1x digital cameras (4.6 megapixels, one being modified as above to acquire NIR images), and a low weight Thermoteknix Miricle 307K thermal camera (640*480 pixels). UAV image acquisition was mostly carried out at 40m altitude under fully sun conditions at solar noon. A series of 30 UAV navigation waypoints were fixed for each flight, to ensure stable conditions each 9 meters and to obtain net RGB and NIR images covering the whole field. TIR images were extracted from video files by using a
self-246
developed software written in Python language (Python Software, Beaverton, USA) and the avconv command line program for transcoding multimedia files (Libav Open source) (Gómez-Candón et al., 2014). The uncooled thermal camera used had a system for continuous self-calibration, which was set to occur every 4s. Only the first frame after every self-calibration was extracted. Radiometric calibration coefficients were computed by linear interpolation, using the ground temperature data (from hot, cold, and soil targets) acquired at beginning and end of each flight. The two UAV campaigns gathered high-resolution images, including ~10cm TIR images, and 1cm RGB and NIR images.
Pre-processing of spectral image and computation of vegetation and stress indices
The normalized difference vegetation index (NDVI) was used to estimate the crop cover fraction: NDVI = (NIR–R)/(NIR+R), where R and NIR are the digital values recorded by the cameras in the red and near-infrared bands, respectively. Bidirectional reflectance distribution heterogeneity was assumed to be effectively normalized through this band ratio index. As NIR and R corresponded to digital values, the range of NDVI values obtained did not correspond to the typical values mentioned in the literature for NIR and R, but allowed relative comparisons. For each of the 520 trees a zone of interest larger than the crown and containing balanced proportions of ground and tree vegetation was manually drawn to serve as a study mask. After merging these 520 zones, the pixel values of NDVI and Ts-Ta were extracted from the resulting mask for the whole field plot and used to obtain a vegetation index-temperature scatterplot for each date. Representative NDVI and Ts-Ta values were also extracted for each individual tree from a circular 60cm-radius buffer around the centre of the tree. The spatial resolution of the NDVI images was degraded to match the TIR image resolution. Given the resolution of TIR images, each individual tree buffer contained 12 to 16 and 100 to 150 pixels for ULA and UAV images respectively. The water deficit index (WDI) is a stress index adapted to not fully-covering crops (Moran et al., 1994), taking the soil fraction into account. A trapezoid is typically obtained by plotting the NDVI index against Ts-Ta for the whole plot (Fig. 2) in which vertices 1 to 4 represent: 1: well-watered dense vegetation; 2: water-stressed dense vegetation; 3: water-saturated bare soil; 4: dry bare soil. In our study, the left and right oblique boundary lines (1-3 and 2-4), which correspond to the (Ts-Ta_min) and (Ts-Ta_max) wet and dry references, were determined by quantile regression
(Virlet et al., 2014), while the upper and lower limits of the scatterplot were maximum and minimum NDVI values. WDI for each individual tree was computed as the ratio of distances AC/AB, where AC and AB correspond to [(Ts-Ta)-(Ts-Ta_min)] and [(Ts-Ta_max
)-(Ts-Ta_min)]. WDI varies from 0 (no stress) to 1 (full stress), being a proxy for
1-ETreal/ETmax (ET: evapotranspiration). As shown by Virlet et al. (2014) WDI is correlated to the water stress intensity measured by stem water potential. Variation of WDI in response to water deficit traduces the individual stomatal behavior.
Statistical analyses
Analyses were performed for 464 trees, i.e. for 116 genotypes replicated 4 times, with the R software v.2.13.2. Six genotypes, for which one replicate was missing, were not included in the analysis. After normality and homoscedasticity tests, analyses of variance (ANOVA) were performed to test the effects of drought and genotype on the vegetation (NDVI) and stress (Ts-Ta, WDI) indicators. Genetic correlations between variables were estimated, and a hierarchical ascendant classification (HAC) analysis using
247
Ward's criteria allowed us to analyse the structure of the progeny on the basis of the most independent tree traits.
RESULTS AND DISCUSSION
Effects of water deficit and genotype on vegetation and water stress indices
The effect of drought on WDI was tested considering the different dates separately (Fig. 3, 2011 ULA experiment, Virlet et al., 2014). For date 1, as drought was not established in WS (-0.02MPa<s) there were no differences for WDI between WW and
WS. The effect of drought was significant in WS for dates 2 and 3. The date effect was analysed for WW and WS separately. For WW trees, significant variations occurred; the lowest WDI values was observed for Date 2, and related to a higher evaporative demand (VPD=2.51 kPa) than for date 1 (VPD=1.47 kPa). In WS trees, a highly significant increase of WDI was observed on dates 2 and 3. A significant genotype effect (P<0.05) was found at each date, considering the mean WW and WS values (not shown).
Effects of image resolution (UAV vs. ULA imaging)
By using UAV, high-resolution TIR images were obtained thanks to lower flight altitudes. A 10 cm-resolution was obtained for TIR image at 40m in 2013, while it was only 30cm at 150m (Gómez-Candón et al., 2014). Improving the resolution up to 10cm (ca. size of an apple leaf) also increased Ts variability across pixels within individual tree buffer zones (Fig. 4), probably by lowering the proportion of mixed pixels (Prashar et al., 2013). Sensitivity analysis of varying the pixel size must be further investigated, as in vineyard (Bellvert et al., 2014) and use of WDI is questionable for the highest resolutions, in which true surface temperatures can be retrieved by image classification and/or segmentation, opening the possibility to use the crop water stress index (CWSI) in this heterogeneous crop (Berni et al., 2009).
Structuration of the apple population in response to drought
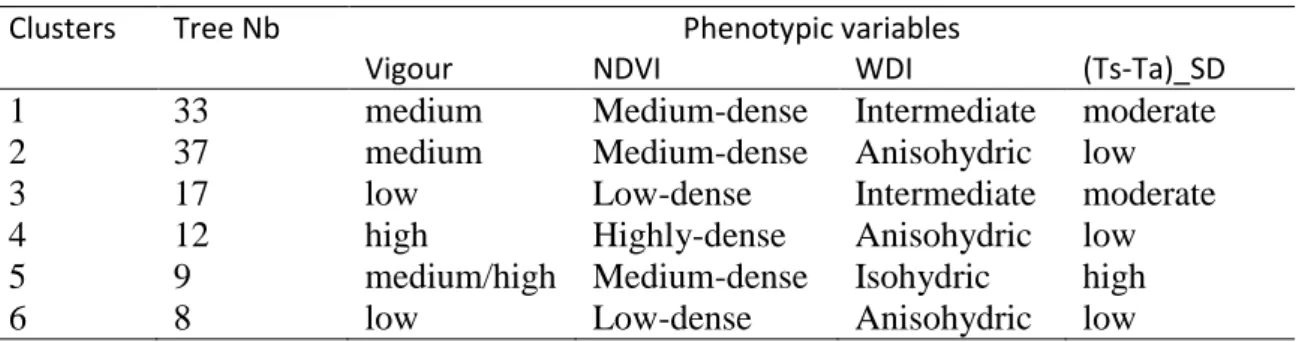
Results obtained through HAC analysis in 2010 for apple hybrids (in WS trees) made it possible to structure the population in 6 clusters according to tree traits (Table 1). The apple population displayed a large range of tree vigour (cf. trunk girth as proxy) and canopy density (NDVI for the latter). The relative transpiration rate estimated by WDI varied independently of these variables, showing a variability of stomatal behaviour in response to drought, and encompassing trends toward isohydry but also anisohydry. The respective adaptation capacity of apple hybrids to drought can be discussed on these bases, according to different scenario of stress period (period, duration and severity).
CONCLUSIONS
High-throughput airborne field phenotyping of an apple segregating population in response to soil drought proved successful and harvested robust results, either by ULA or UAV. The medium- to high-resolution imaging gathered by ULA is a possible option, thanks to the use of WDI index as a stress phenotypic variable. Alternatively, the more flexible UAV phenotyping procedure allows higher-resolution images, and opens the door to analysis of intra-canopy variability. As current research focuses on genetic determinisms for the vegetation and stress phenotypic variables, through QTL analysis (Virlet et al., 2015) and can be applied to different genetic backgrounds, methodological tools and intra-specific variability show promise for future apple breeding programs.
248 ACKNOWLEDGEMENTS
Thanks to S. Feral and G. Garcia for helping in field measurements. The PhD scholarship of N. Virlet was granted by Montpellier SupAgro and the Languedoc- Roussillon Region. The ULA and UAV projects were respectively supported by Telerieg (Interreg IV, contract SOE1/P2/E082) and HiriFAP (Agropolis Fondation ANR-10-LABX-0001-01) programmes. The Agreenium EcoHort programme sponsored the paper.
Literature Cited
Bellvert, J., Zarco-Tejada, P.J., Girona, J., Fereres, E. 2014. Mapping crop water stress in a ‘Pinot-noir’ vineyard: comparing ground measurements with thermal remote sensing imagery from an unmanned aerial vehicle. Precision Agric. 15:361-376.
Berni, J.A.J., Zarco-Tejada, P., Suarez, L. and Fereres, E. 2009. Thermal and narrowband multispectral remote sensing for vegetation monitoring from an unmanned aerial vehicle. IEEE Trans. Geosci. Remote Sens. 47:722-738.
Chapman, S.C., Merz, T., Chan, A., Jackway, P., Hrabar, S., Dreccer, M.F., Holland, E., Zheng, B., Jun Ling, T. and Jimenez-Berni, J. 2014. Pheno-copter: a low altitude, autonomous remote-sensing robotic helicopter for high-throughput field-based phenotyping. Agronomy. 4:279-301. Condon, A.G., Richards, R.A., Rebetzke, G.J. and Farquhar, G.D. 2004. Breeding for high water-use efficiency. J. Exp. Bot. 55:2447-2460.
Fiorani, F. and Schurr, U. 2013. Future scenarios for plant phenotyping. Ann. Rev. Plant Biol. 64:267-291.
Gómez-Candón, D., Labbé, S., Virlet, N., Jolivot, A. and Regnard, J.L. 2014. High resolution thermal and multispectral UAV imagery for precision assessment of apple tree response to water stress. 2nd Int. Conf. on robotics and associated high-technol. and equipments for agriculture and forestry. Madrid, 12-23 May 2014, pp. 279-288.
González-Dugo, V., Zarco-Tejada, P., Berni, J.A.J., Suárez, L., Goldhamer, D. and Fereres, E. 2012. Almond tree canopy temperature reveals intra-crown variability that is water stress-dependent. Agric. For. Meteor. 154:156-165.
Hackl, H., Baresel, J.P., Mistele, B., Hu, Y. and Schmidhalter, U. 2012. A comparison of plant temperatures as measured by thermal imaging and infrared thermometry. J. Agron. Crop Sci. 198:415-429.
Jones, H.G., Serraj, R., Loveys, B.R., Xiong, L.Z., Wheaton, A. and Price, A.H. 2009. Thermal infrared imaging of crop canopies for the remote diagnosis and quantification of plant responses to water stress in the field. Funct. Plant Biol. 36:978-989.
Jones, H.G. and Sirault, X. 2014. Scaling of thermal images at different spatial resolution: the mixed pixel problem. Agronomy 4:380-396.
Lebourgeois, V., Bégué, A., Labbé, S., Mallavan, B., Prévot, L. and Roux, B. 2008. Can commercial digital cameras be used as multispectral sensors? A crop monitoring test. Sensors 8:7300-7322. Maes, W.H. and Steppe, K. 2012. Estimating evapotranspiration and drought stress with ground-based thermal remote sensing in agriculture: a review. J. Exp. Bot. 63:4671-4712.
Massonnet, C., Costes, E., Rambal, S., Dreyer, E., Regnard, J.L. 2007. Stomatal regulation of photosynthesis in apple leaves: Evidence for different water-use strategies between two cultivars. Ann. Bot. 100:1347-1356.
McDowell, N., Pockman, W.T., Allen, C.D., Breshears, D.D., Cobb, N., Kolb, T., Plaut, J., Sperry, J.S., West, A., Williams, D.G. and Yepez, E.A. 2008. Mechanisms of plant survival and mortality during drought: why do some plants survive while others succumb to drought? New Phytol. 178:719-739.
249 Moran, M.S., Clarke, T.R., Inoue, T.R., Vidal, A. 1994. Estimating crop water deficit using the relation between surface-air temperature and spectral vegetation index. Remote Sensing Envir. 49:246-263.
Naor, A. 2006. Irrigation scheduling and evaluation of tree water status in deciduous orchards. Hort. Reviews 32:111-165.
Prashar, A., Yildiz, J., McNicol, J.W., Bryan, G.J. and Jones, H.G. 2013. Infra-red thermography for high throughput field phenotyping in Solanum tuberosum. PLoS One 8(6): e65816.
Regnard, J.L., Ducrey, M., Porteix, E., Segura, V., Costes, E. 2008. Phenotyping apple progeny for ecophysiological traits: how and what for? Acta Hortic. 772:151-158.
Regnard, J.L., Segura, V., Merveille, N., Durel, C.E. and Costes, E. 2009. QTL analysis for leaf gas exchange in an apple progeny grown under atmospheric constraints. Acta Hortic. 814:369-374. Šircelj, H., Tausz, M., Grill, D. and Batič, F. 2007. Detecting different levels of drought stress in apple,trees (Malus domestica Borkh.) with selected biochemical and physiological parameters. Scientia Hortic. 113:362-369.
Tardieu, F. and Simonneau, T. 1998. Variability among species of stomatal control under fluctuating soil water status and evaporative demand: modelling isohydric and anisohydric behaviours. J. Exp. Bot. 49(Special issue):419-432.
Virlet, N., Lebourgeois, V., Martinez, S., Costes, E., Labbé, S., Regnard, J.L. 2014. Stress indicators based on airborne thermal imagery for field phenotyping a heterogeneous tree population for response to water constraints. J. Exp. Bot. 65:5429–5442.
Virlet, N., Costes, E., Martinez, S., Kelner, J.J., Regnard, J.L. 2015. Multispectral airborne imagery in the field reveals genetic determinisms of morphological and transpiration traits of an apple tree hybrid population in response to water deficit. J. Exp. Bot. 66: 5453–5465
White, J.W., Andrade-Sanchez, P., Gore, M.A., Bronson, K.F., Coffelt, T.A., Conley, M., M., Feldmann, K.A., French, A.N., Heun, J.T., Hunsaker, D.J., Jenks, M.A., Kimball, B.A., Roth, R.L., Strand, R.J., Thorp, K.R., Wall, G.W. and Wang, G.Y. 2012. Field-based phenomics for plant genetics research. Field Crops Res. 133:101-112.
Tables
Table 1. Clustering of apple hybrids (WS trees, 2010) obtained through a 4 variable-Hierarchical Ascendant Classification. Trunk girth and NDVI are proxies for tree vigour and canopy density, respectively. Trends to anisohydry and isohydry were assessed according to low and high WDI values, respectively, the lowest and the highest SDs for Ts-Ta being found in the most aniso- and isohydric trees, respectively.
Clusters Tree Nb Phenotypic variables
Vigour NDVI WDI (Ts-Ta)_SD
1 33 medium Medium-dense Intermediate moderate 2 37 medium Medium-dense Anisohydric low 3 17 low Low-dense Intermediate moderate 4 12 high Highly-dense Anisohydric low 5 9 medium/high Medium-dense Isohydric high 6 8 low Low-dense Anisohydric low
250 Figures
.
Figure 3. Date and water regime effects on WDI (2011 data, means ± SD for the water regimes for each date). According to the post-hoc Student-Newman-Keuls test (α = 0.05) different letters indicate significant differences between dates, lower-case and upper-case letters being relative to WW and WS trees, respectively. *, P ≤0.05; ** ≤0.01; *** ≤0.001; ns, not significant.
Fig. 4. Effect of UAV flying altitude on variability of Ts within the trees 60-cm radius central zone (images Sept. 6, 2013; SD mean values per water treatment).
0 0.1 0.2 0.3 0.4 0.5 0.6 0.7 WW WS WW WS WW WS
June 21 July 22 August 11
0.0 0.5 1.0 1.5 0 20 40 60 80 100 120 140 160 WW WS Flying altitude (m) Ts_ SD ( °C) WD I
Figure 1. Flowchart illustrating the steps of multi-spectral image retrieval and treatment, allowing retrieval of spectral values and computation of vegetation and stress indices for any hybrid within the field plot.
Figure 2. Trapezoid plot (Moran et al., 1994) of NDVI against surface- (Ts) minus air temperature (Ta). Vertices 1 to 4 represent extreme states of vegetation development and evapotranspiration rate. For any point C, WDI is equal to the AC/AB ratio.
a B c A b A
*** ***
ns
The author has requested enhancement of the downloaded file. All in-text references underlined in blue are linked to publications on ResearchGate. The author has requested enhancement of the downloaded file. All in-text references underlined in blue are linked to publications on ResearchGate.