HAL Id: hal-00850558
https://hal.archives-ouvertes.fr/hal-00850558
Submitted on 7 Aug 2013HAL is a multi-disciplinary open access archive for the deposit and dissemination of sci-entific research documents, whether they are pub-lished or not. The documents may come from
L’archive ouverte pluridisciplinaire HAL, est destinée au dépôt et à la diffusion de documents scientifiques de niveau recherche, publiés ou non, émanant des établissements d’enseignement et de
Inversion of magnetic forces between microparticles and
its effect on the magnetorheology of extremely
bidisperse magnetic fluids
Modesto Lopez-Lopez, Georges Bossis, J.D.G Duran, Ana Gomez-Ramirez,
Pavel Kuzhir, L. Iskakova, Andrey Zubarev
To cite this version:
Modesto Lopez-Lopez, Georges Bossis, J.D.G Duran, Ana Gomez-Ramirez, Pavel Kuzhir, et al.. In-version of magnetic forces between microparticles and its effect on the magnetorheology of extremely bidisperse magnetic fluids. Journal of Nanofluids, American Scientific Publishers, 2013, 2 (2), pp.85-93. �10.1166/jon.2013.1049�. �hal-00850558�
Inversion of magnetic forces between microparticles and its effect on the
magnetorheology of extremely bidisperse magnetic fluids
M. T. Lopez-Lopez,1 G. Bossis,2 J. D. G. Duran,1 A. Gomez-Ramirez,1 P. Kuzhir,2 L.Iskakova3 and A. Yu. Zubarev3
1
Departamento de Física Aplicada, Facultad de Ciencias, Universidad de Granada, Campus de Fuentenueva, 18071 Granada, Spain
2
Laboratoire de Physique de la Matière Condensée, CNRS UMR 6622, Université de Nice-Sophia Antipolis, Parc Valrose, 06108 Nice Cedex 2, France
3
Ural Federal University, pr. Lenina 51, Ekaterinburg, Russia
We investigate the interaction between micron-sized magnetizable particles dispersed in a nanodisperse ferrofluid upon application of a magnetic field. As expected, at large distances interaction between two particles is governed by the magnetic dipolar force, which is attractive if the angle between the line of the particles centers and the field is lower than 51°. However, when the gap between the surfaces of the microparticles is about one diameter, two approaching particles suddenly stop instead of coming into contact at zero gap. This stopping distance is quite independent on the intensity of the applied magnetic field. On the other hand, by studying two ferrofluids with a different size distribution of the nanoparticles, we found that this stopping distance can be increased a lot by a small change in the average size of the ferrofluid nanoparticles. In addition, the rheological properties of these MR suspensions, constituted by magnetizable microparticles dispersed in ferrofluids, are also appreciably affected by this small change in the ferrofluid particle size distribution. Based on experimental observations of a more concentrated zone of ferrofluid between the microparticles, we demonstrate that this zone is the result of a phase condensation on the ferrofluid nanoparticles. This condensation is induced by the enhancement of magnetic field near the magnetic poles of the microparticles and especially in the zone which separates the micron-sized particles. This concentrated domain of ferrofluid between the microparticles exerts a repulsive magnetic force which results of its tendency to be extended in order to minimize the demagnetizing field. We show that the demagnetizing effects play a dominant role when the microparticles are close enough. Thus, contrary to the classical results of magnetostatic of continuums, magnetic interaction between magnetizable microparticles in
ferrofluids experience inversion from attraction, at large interparticle distances, to repulsion when the particles are close enough.
Key words: Magnetic fluids; bidisperse systems; rheology; structures.
I. INTRODUCTION
It is well known that upon magnetic field application, two magnetizable particles, being aligned in the direction of the field, experience attractive magnetostatic forces. If these particles are free to move, e.g. they are dispersed in a liquid carrier, and the intensity of the applied magnetic field is large enough to overcome the Brownian motion, these particles would attract in order to minimize their magnetostatic energy. The minimum is reached when the particles are in contact and aligned in the field direction. This is the basic phenomenon underlying the magnetorheological (MR) effect, which causes a quick and important change in the rheological properties of MR suspensions upon application of a magnetic field [1-2]. On the other hand, ferrofluids, which are stable dispersions of magnetic nanoparticles, show almost negligible MR effect, except very low shear rate flow, because magnetic attraction is dominated by the Brownian motion [3].
In order to increase the strength of magnetic forces between the microparticles, some attempts have been done to disperse them in ferrofluids. Several authors have actually found that, for the same internal magnetic field, the yield stress of these composed systems (known as bimodal or bidisperse MR fluids) is higher than that of the conventional MR fluids [4-6]. Since then, it has been shown that suspensions of ferromagnetic microparticles in ferrofluids exhibit a better colloidal stability (facing irreversible aggregation and sedimentation) and a more reproducible MR response than the dispersions based on usual nonmagnetic fluids, although these enhanced properties are not explained by the existing theoretical models [7-14].
In a recent communication [15], we presented some preliminary results on the fundamental interactions between two ferromagnetic microparticles in a ferrofluid. Experimental observations clearly showed that upon magnetic field application, magnetizable microparticles dispersed in a ferrofluid approach each other but, instead of coming into contact, they stop at a surface-to-surface distance of the order of particle diameter. In the present paper we shall concentrate on the physical causes that provoke this unexpected behavior and on its effect on the rheological properties of bidisperse MR fluids.
II. EXPERIMENTAL RESULTS A. Physical characterization of the ferrofluids
Ferrofluids used in the experiments consisted of stable suspension of oleate-covered magnetite nanoparticles dispersed in kerosene. Details on their preparation are given in [5, 16]. X-ray diffraction data of the synthesized nanoparticles showed excellent coincidence with the reference lines for magnetite, an indication of the purity and crystalline nature of the synthesized magnetite particles –see Ref. [16]. From measurements of the magnetization curve, saturation magnetization Ms=4.05×10⁵ A/m was obtained for the dry particles [16]. In addition, the synthesized magnetite has a negligible coercivity and remanence, and a value of the magnetic susceptibility i = 5.7 [16]. In order to investigate the effect of the ferrofluid
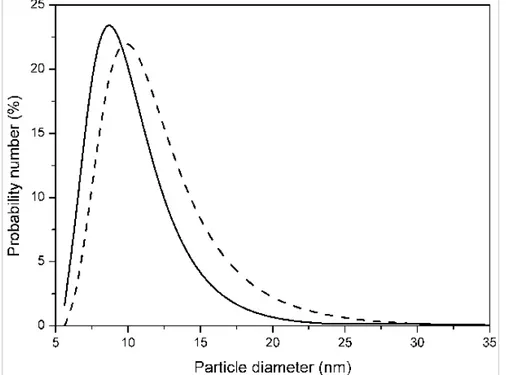
particle size, the initial ferrofluids were centrifuged for 3 hours at 20000g. Particle concentration was adjusted to 5 vol.% in both centrifuged and non-centrifuged ferrofluids. Particle size distribution of both the initial (non-centrifuged) and the centrifuged ferrofluids was measured by light scattering using a Zetasizer instrument (Malvern Instruments, U.K.). Results are shown in Figure 1. By fitting lognormal distributions to the experimental curves shown in Figure 1 mean particle diameters of (9.39 ± 0.10) nm and of (10.80 ± 0.15) are obtained for the particles of the centrifuged and non-centrifuged ferrofluids respectively.
Figure 1. Particle size distribution for the initial (non-centrifuged) ferrofluid (dashed line) and for the 3-hour/20000g centrifuged ferrofluid (continuous line).
As expected, the particle size distribution of the centrifuged ferrofluid is shifted to smaller sizes with respect to the initial ferrofluid. The magnetization curves of these ferrofluids were also measured. Figure 2 shows these curves at low field.
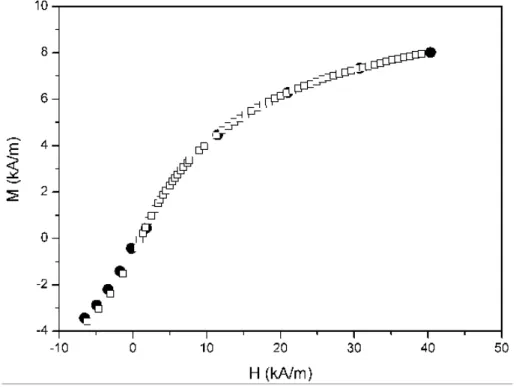
Figure 2. Magnetization curve at low field for the initial (non-centrifuged) ferrofluid (full circles) and for the 3-hour/20000g centrifuged ferrofluid (open squares).
One can see, that they are very similar, with the slightly higher magnetization of the non-centrifuged ferrofluid at the lowest fields being the only appreciable difference. This result is logical, taking into account the results shown in Figure 1.
B. Microscopic observations
Magnetic microparticles of different materials (iron, nickel, silver-coated nickel) and different average sizes (between 1 and 10 m) were used in our experiments; quite similar effects were observed for all samples. The results shown in this manuscript correspond to spherical nickel particles of average diameter 10 m, supplied by Merck KgaA (Germany). The volume fraction of microparticles in the suspension was approximately 0.01% in all these observations. A drop of the suspension was placed between two glass slides and
function of time. A magnetic field was applied parallel to the glass slides with the help of a home-made electromagnet.
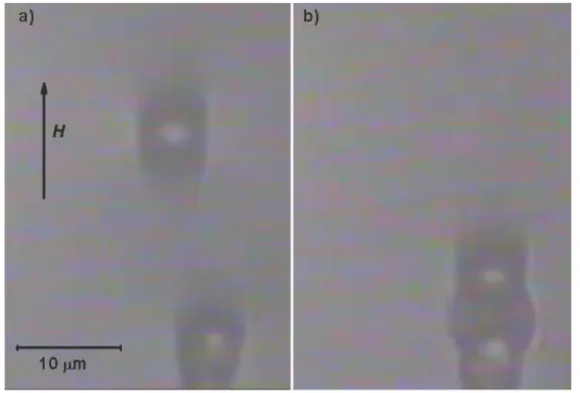
Figure 3 shows snapshots of the approach of two spherical nickel particles dispersed in the centrifuged ferrofluid, upon application of a magnetic field of intensity 22 kA/m.
Figure 3. Snapshots of the collision of two nickel particles dispersed in the 3-hour/20000g centrifuged ferrofluid, upon application of a magnetic field of 22kA/m. Direction of the field is indicated. Ferrofluid solid concentration was 5 vol.%. Snapshot (a) was taken during the approach. Snapshot (b) was taken in the stationary state.
Snapshot shown in Figure 3(a) was taken while the microparticles were approaching each other under magnetic dipolar attraction, whereas snapshot shown in Figure 3(b) was taken in the stationary state. In Figure 3(a) we can see the presence of a zone of more concentrated ferrofluid around the poles of the particles. In the stationary state (Figure 3(b)) this concentrated zone has the shape of a truncated ellipsoid and fills the gap between the particles maintaining them at a distance of about one diameter. This observation is very surprising and contradicts all the theories based on dipolar forces which are always attractive in the direction of the field and lead to the physical contact between the surfaces of the microparticles. This repulsive force obviously takes place due to the magnetic field, and we observed in our experiments that the equilibrium distance between particles was practically
independent on the strength of the applied field in the range of our study (from 5 to 22kA/m). This means that both, the strength of the dipolar magnetic attraction and repulsion between the particles increases in the same way with the applied field intensity, in order to maintain the same equilibrium distance of the “stop effect”.
Let us now point out an interesting observation about the cloud of nanoparticles between interacting microparticles. As seen in Figure 4, which shows a high-luminance photo of two nickel microparticles dispersed in the centrifuged ferrofluid, this cloud of nanoparticles is not homogeneous but presents some denser filaments connecting the two surfaces.
Figure 4. High-luminance photo of two nickel microparticles dispersed in the centrifuged ferrofluid, upon application of a magnetic field of a 17kA/m. Ferrofluid solid concentration was 5 vol.%.
These bridges of nanoparticles between the surfaces of microparticles are reminiscent of domain formation observed in suspensions of Brownian magnetic particles contained
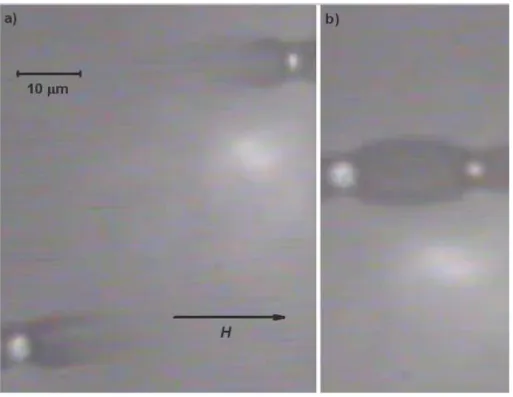
In order to investigate the role of the ferrofluid particle size, microscopic observations were also performed for particles dispersed in the non-centrifuged ferrofluid. Figure 5 shows an example of collision of nickel microparticles in this ferrofluid – a similar behavior was obtained for other pairs of particles, not shown here for brevity.
Figure 5. Same as Figure 2, but for nickel particles dispersed in a non-centrifuged ferrofluid.
As observed in Figure 5(a), and in contrast to Figure 3(a), dense zones of ferrofluid are observed not only closely to the microparticles (where they take the shape of crab’s claws) but also far from them. One can see dark lines along the field direction in all regions. In the stationary state, Figure 5(b), the ellipsoidal cloud of nanoparticles between microparticles is considerably larger than the one observed for the centrifuged ferrofluid (see for example Figure 3(b)). Since this magnetic barrier is strongly increased in the non-centrifuged ferrofluid, we conclude that these are the biggest nanoparticles which undergo a ferrofluid phase separation induced by the applied magnetic field especially in the zone between microparticles, where the local magnetic field is the highest.
C. Magnetorheology of bidisperse MR fluids
In this section we analyze the effect of the ferrofluid (FF) particle size distribution on the rheological properties of the bidisperse MR fluids. These systems have been prepared as described in Ref. [5] by using spherical iron particles of diameter in the range 0.5 – 3 m supplied by BASF (Germany). The concentration of microparticles in these bidisperse MR fluids was always 10 vol.%. We used both centrifuged and non-centrifuged ferrofluids as carrier liquids. The flow properties of these bidisperse MR fluids were measured by using a controlled-stress rotational rheometer (MCR 300 Physica-Anton Paar, Austria), both in the absence and presence of applied magnetic field. The measuring system was a plate-plate geometry with 20 mm in diameter and with the gap of 0.2 mm between the plates. Magnetic fields, of similar intensity to those used in microscopic observations, and with direction perpendicular to the flow, were applied using a solenoid.
Two kinds of experiments were performed: (i) steady-state measurements; and (ii) oscillatory measurements.
Let us start with the experiments corresponding to the steady state. These experiments were carried out as follows: (i) samples were placed in the measuring system and subjected to a large shear rate (~300 s-1) during 60 s; (ii) then the magnetic field was applied and a waiting time of 60 s with no shear was allowed; (iii) finally the samples were subjected to linear shear rate () ramp in the presence of the same magnetic field, applied in the previous step. From these measurements the shear stress ( ) was obtained as a function of the shear rate for each intensity of the applied magnetic field Ha.
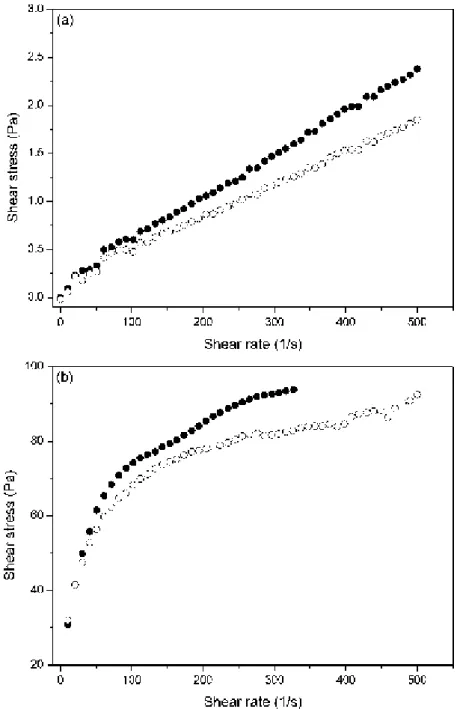
As an example, Figure 6 shows the rheograms (shear stress vs. shear rate curves) at Ha =
Figure 6. Flow curves of suspensions containing 10 vol.% of iron microparticles dispersed in ferrofluids. Ferrofluid nanoparticle concentration is 5 vol.%. Full and open symbols correspond respectively to centrifuged and non-centrifuged ferrofluids. Applied magnetic field strength: 0 kA/m (a); 31kA/m (b).
As can be seen in Figure 6a (Ha = 0 kA/m), the viscosity (slope in the shear stress-shear
rate curve) of the bidisperse MR fluid decreases when the non-centrifuged ferrofluid is used instead of the centrifuged one. In the absence of the applied field, a higher viscosity is an
indication of a more flocculated suspension [18]. This could be explained if we consider our previous hypothesis of the formation of dense clouds of magnetite nanoparticles near the poles of the iron microparticles, as a consequence of the attraction of the nanoparticles into the region with the highest strength of the local magnetic field. Small remnant magnetization of the microparticles can stimulate formation of these clouds (see Ref. [5]). In the absence of the applied field, the clouds of nanoparticles play the role of surfactant layers, preventing from irreversible microparticle aggregation, which can take place due to the van der Waals forces and/or remnant magnetization. It should be noted that for nanoparticles of the mean size (8-10nm), the ratio of energy of their magnetic interaction to kT is about unity. However this ratio grows as the cube of the particle diameter. Thus only the biggest nanoparticles corresponding to the tail of the size distribution can participate formation of the clouds. Thus, since after the ferrofluid centrifugation the biggest nanoparticles are removed (see Figure 1), the thickness of the nanoparticles cloud decreases. That reduces the clouds ability to prevent microparticle aggregation. Consequently, the bidisperse MR fluid with centrifuged FF is expected to present a worse state of the dispersion, in agreement with the results in Figure 6a.
Figure 6b shows the results upon application of the field of intensity 31 kA/m. The similar results were obtained for other fields, not shown here for brevity. Unlike the case of zero magnetic field, presented in Fig. 6a, these results demonstrate decrease of the system effective viscosity (ratio of the stress to shear rate) with the shear rate at the initial parts of the rheological curves. This corresponds to destruction of the chains and other structures, formed by the magnetizable microparticles, under the action of the viscous shear forces.
The second important observation is that the stress curves are higher for the centrifuged ferrofluid than for the non-centrifuged ones. The explanation of this behavior stands in the smaller distance between microparticles in the centrifuged ferrofluid, which is described in section II.B, because smaller distances are associated with stronger interaction forces between the microparticles.
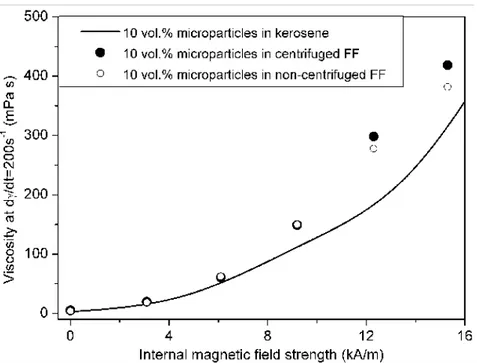
In Figure 7, the viscosity at a given shear rate (here 200 s-1) is plotted versus the internal field Hi=Ha/s, where s is the suspension magnetic permeability.
Figure 8. Viscosity at a shear rate of 200 s-1 as a function of the internal magnetic field strength for bidisperse MR fluids. Results for a conventional MR fluid, based on pure kerosene, are also included for comparison.
This magnitude has been approximated by the Maxwell-Garnett equation:
( 1 2 ) (1 ) s f , (1)
where is the magnetic contrast factor (
2 p f
p f
) with p being the magnetic
permeability of the microparticles. In the present work is close to unity since p>>f. We
see that the difference between the viscosities of the centrifuged and non-centrifuged ferrofluids increases with the field, indicating a stronger effect of the size of the nanoparticles at the highest field, something that is related to a stronger phase separation as we shall see in the next section. Besides that one can see that for the same internal magnetic field the magnetoviscous effect in the bidisperse MR fluids is stronger than that in the conventional MR fluids (solid line in Figure 7). This is in agreement with the results of refs. [4-6].
Let us now pass to the oscillatory measurements. We have performed two kinds of the oscillatory tests: amplitude sweeps and frequency sweeps. In both cases experiments were carried out as follows: (i) the samples were placed in the measuring system and subjected to a large shear rate (~300 s-1) during 60 s; (ii) then the magnetic field was applied and a
waiting time of 60 s with no shear was allowed; (iii) in amplitude sweeps the samples were subjected to oscillatory shear stresses of fixed frequency (1 Hz) and increasing amplitude in the range 0-20 Pa; in frequency sweeps the frequency was increased from 1 to 33 Hz and the amplitude of the shear maintained fixed at 0.2 Pa. In both cases the storage (G’) and loss (G’’) modulus were measured, either as a functions of the shear stress amplitude or the frequency, for each intensity of the applied field.
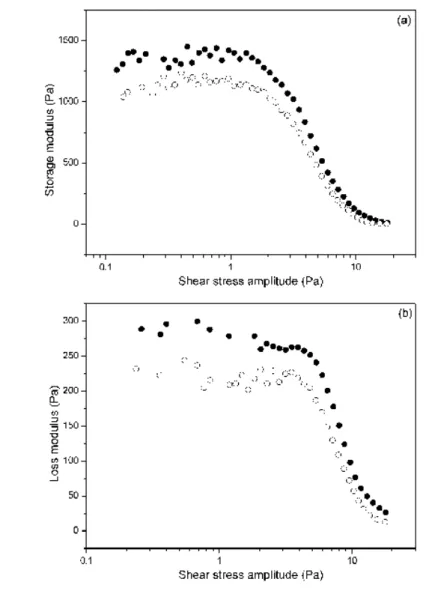
Some results of measurements of the storage and loss modulus vs. the imposed shear stress amplitudes are shown in Figure 8.
Figure 8. Storage (a) and loss (b) modules as a function of the shear stress amplitude of oscillatory tests at the fixed stress frequency 1 Hz, for suspensions containing 10 vol.% of the iron
open symbols correspond respectively to centrifuged and non-centrifuged ferrofluids. The applied magnetic field strength is 25 kA/m in all cases.
Similar trends have been obtained for other strengths of magnetic field, not shown here for brevity. In all cases some pseudoplateaus are observed at low and medium shear stress amplitude. These plateaus correspond to the linear viscoelastic region (LVR) of the suspension reaction on the imposed shear stress. Then, at higher shear stress amplitude, a sharp falls of the modulus are observed. This result is associated with the nonlinear viscoelastic behavior of the system. By comparing the values of the modulus, shown in parts (a) and (b) of Figure 8, one can see that the suspensions are clearly more elastic than viscous (G’ > G’’). This is typical for MR suspensions placed in strong enough magnetic field. Let us compare now the results obtained for the suspensions with centrifuged and non centrifuged ferrofluids. The same, as for the steady shear viscosity, tendency takes place for the modules G’ and G’’: experiments demonstrate quite pronounced increase of magnitudes of these rheological characteristics for the centrifuged ferrofluid as compared with the non-centrifuged one.
The samples also have been subjected to frequency sweeps at a fixed value of the shear stress amplitude (0.2 Pa). This stress is inside the LVR for all intensities of the applied field under study. As an example, Figure 9 demonstrates the dependences of the storage modules on the frequency of the shear stress for two bidisperse MR suspensions, with centrifuged and non-centrifuged ferrofluids.
Figure 9. Storage modulus plotted as a function of the frequency of the shear stress in oscillatory tests at a fixed amplitude of 0.2 Pa, for suspensions containing 10 vol.% of iron microparticles in 5
vol.% ferrofluids. Full and open symbols correspond respectively to centrifuged and non-centrifuged ferrofluids. Squares and circles stand for applied field intensities of 6 and 31kA/m, respectively
These results indicate a slight increase of the storage modules (i.e. the suspensions behave more elastically) with the stress frequency. This tendency becomes more marked at frequencies higher than 25 Hz. It is also clear from this figure that the storage modules increase with the applied field strength. One needs to note that the storage modulus increase after centrifugation of the ferrofluid. . This result is in agreement with the previous discussion.
In order to better compare the elastic response of the different bidisperse MR suspensions, we have measured dependences of the storage modulus on the applied magnetic field. The shear stress amplitude corresponded to the LVR (i.e. to the initial plateaus of the curves shown in Figure 9) for the oscillatory measurements at 1 Hz of frequency. The results are shown in Figure 10; data for a suspension of the iron microparticles (10 vol.%) in pure kerosene are also included for comparison.
Figure 10. Storage modulus as a function of the applied magnetic field strength for bidisperse MR fluids. Ferrofluid nanoparticle concentration is 5 vol.%. Results for a conventional MR fluid are also included for comparison. The applied stress frequency is
Similarly to the steady shear viscosity (Figure 7), the storage modulus (i.e. the elasticity) of the bidisperse MR fluid increases when the carrier ferrofluid is centrifuged. For the MR suspension with the pure kerosene the modulus is much higher than those for the bidisperse MR, which use the ferrofluids as the carrier liquids.
This is explained by the high sensitivity of the storage modulus to the contact attraction forces between microparticles. The ferrofluid nanoparicles suppress the tendency for the microparticles to be in contact, thus the presence of the nanoparticles leads to the large drop of the storage modulus.
As a conclusion of the rheological measurements, it can be said that all these results suggest that the repulsion between magnetizable microparticles is mainly induced by the concentration of the largest FF nanoparticles (tail of the size distribution, see Figure 1) and, therefore, dilution or centrifugation of the carrier ferrofluid leads to significant reduction of the stationary gap between the microparticles.
III. THEORETICAL MODEL
We now wish to identify the physical mechanisms responsible for the existence of this magnetic potential barrier between the microparticles. A complete theoretical description of this system, taking into account the dense ferrofluid clouds surrounding the particles, is very complicated due to the correlated spatial dependence of the phase separation, the magnetic permeability of the dense zone, and the field amplitude. Here we just want to demonstrate on a simplified model how this repulsive barrier can arise. Interaction between two microsized particles is a sum of magnetic interactions between them and osmotic forces, which are provided by the ferrofluid nanoparticles surrounding the magnetizable microparticle. Figures 3b and 5b show quite sharp boundaries between dense domains and the surrounding ferrofluid. It is well known (see, for example, refs. [19-25]), that magnetic field stimulates the phase condensation in ferrofluids but only the biggest particles of the polydisperse ferrofluids interact strongly enough to undergo this phase condensation.
Since the local magnetic field is especially strong near the poles of the magnetizable microparticles, ferrofluid condenses mainly near these poles. In order to reproduce the shape of the dense zone, we will consider monodisperse model of the ferrofluid. We assume that it consists only of the biggest nanoparticles, which are able to condense into dense phases under the action of high enough magnetic fields. We adapt the size of the nanoparticles and
their concentration in accordance with Figure 1, but also in such a way that the applied magnetic field H0 will not provide a phase condensation of the nanoparticles in the absence
of the microparticles. In this situation the ferrofluid condensation is possible only near the poles of the magnetizable microparticles where the magnetic field is high enough (see Figure 3), but not in the bulk of the ferrofluid. Actually increase of the magnetic field can induce the condensation in the bulk of the ferrofluid that we can visualize in the shape of the needle like dense zones. Nevertheless, in a first approximation, we only consider intermediate fields for which the condensation can only occur near the microparticle poles.
In a first step, let us ignore the condensation near the microparticles and consider them as immersed in a homogeneous monodisperse ferrofluid. By using the classical results of magnetostatics [26], one can determine the field H(r) around the particles as the field, created by a spherical particles with the magnetic M each. This moment can be calculated as:
M=VH0, where is the magnetic contrast factor, V the microparticle volume, and H0 is the
magnetic field in ferrofluid far from the microparticle. In the dipolar approximation, one can determine the local magnetic field distribution near the particle. It is well known that the chemical potential of the ferrofluid nanoparticles depends on the local magnetic field
H(r) (see, for example, [19]). In the thermodynamically equilibrium suspension, the
potential of the nanoparticles near the magnetizable microparticles must be equal to the potential of the nanoparticles far from the microparticles, i.e. in the main part of the suspension. This condition allows us to estimate the density of the nanoparticles near the microparticles. The shape of the ferrofluid dense cloud can be determined as a surface which separates the region, where the chemical potential inside the dense cloud can be equal to the potential at the infinite distance from the microparticle, and the region where equality of these potentials is impossible.
Here, for calculations, we will use the mathematical form of the chemical potential, which corresponds to the statistical model [19] of a ferrofluid:
2 2 3 2 3 1 8 1 3 9 8 ln L sh kT (2) , ) ( ) ( 0 kT mH r r
d s
kT m 3 2 0 2 4 thickness of the surfactant layer on the nanoparticle. Parameter is the dimensionless energy of interaction between the nanoparticle and the local magnetic field , is the dimensionless parameter that characterizes the dipolar energy of interaction between the nanoparticles. The equilibrium concentration (r) inside the dense domain was determined from the condition
r ,H( )r
0,H0
0, where is the volume concentration of ferrofluid 0 nanoparticles far from the microparticle. The value of /T vs. , for an initial volume fraction = 0.25% and a diameter of the nanoparticle d=16.5nm, 0 corresponding to the tail of the size distribution (Figure 1), is plotted in Figure 11 for two values of magnetic fields. The first one, H0=22kA/m is, approximately, the critical field Hcfor the nanoparticle phase condensation; the second field, H0=25kA/m, produces the phase
separation with the volume fraction of the particles in the dense phase about 0.38.
Figure 11. Illustration of the solution of the equation = ( ,H)- ( 0,H0)=0, with nanoparticle
diameter d=16.5 nm and volume concentration of nanoparticles in the ferrofluid 0=0.25%; Red line
1 corresponds to the field H=22kA/m; green line 2 – H=25kA/m.
Then, for a given distance between the two microparticles equal to 3a in our example (a is radius of the microparticle), it is possible to calculate the shape of the ferrofluid dense phase domain as the region where the local field (obtained in the dipolar interaction) is larger
than 22kA/m. This domain is shown by squares in Figure 12 and looks quite similar to the experimental one, presented in photos of Figure 3.
Figure 12. Distribution of magnetic field near two magnetizable nickel microparticles. Dots delimitate the condensed phase obtained in the dipolar approximation (first step of iteration). The map of magnetic field was obtained with FEMM taking into account the dense zone with a permeability d=3.75 instead of f=1.25 for the dilute ferrofluid and p=10 for the nickel particles of
particle radius a=5 m. The external field was H0=22kA/m.
In a second step, we take into account modifications of the local field distribution due to the fact that the magnetic permeability f in the dense phase is higher than that in the
surrounding dilute ferrofluid. For both, dense and dilute, phases of the ferrofluid the relative permeability f have been estimated according to [19] as
1 8 1 ) ( 24 1 f L L . Its magnitudes are respectively 1.25 for the diluted phase and about 3.75 for the dense phase. By using the program package FEMM we have recalculated the field distribution near the magnetizable particles and the result is presented in Figure 12. The region of magnetic field H>Hc≈22kA/m (marked yellow), providing the
Let us introduce a spherical coordinate system with the origin in the center of the upper particle, the Oz axis along the applied field, radius vector r and angle between r and this polar axis Oz. Near the particle surface, we find that the field H exceeds Hc when
0.35<cos <1 and -1<cos <-0.36. The force F acting on the upper microparticle, shown in Figure 12, can be calculated as follows:
0
2 cos sin sin
2 a p d
F rr r (3)
Here p is osmotic pressure of the gas of ferrofluid particles, rr and r are components of the
Maxwell stress tensor. To estimate p we use the result of [19]:
2 2 2 3 3 2 3 1 4 1 1 v L kT p (4)Here, v is the hydrodynamic volume of the ferrofluid particle. Inside the dense region (0.35<cos <1 and -1<cos <-0.36) the nanoparticle volume concentration can be estimated by using the equality
r ,H(r)
0,H0
. Outside of this region the concentration is nearly equal to the concentration 0 in the main part of the ferrofluid.The Maxwell stress tensor components are: rr 0
fHr2 0.5H2
,r f r HH
0 [26]. Because of the above mentioned reasons, we used the following estimates for the susceptibility of the ferrofluid: f 3.75 when either 0.35<cos <1
or -1<cos <-0.36 , and f1.25 otherwise. Our calculations demonstrate that for the case shown in Figure 13, the force, acting on the upper particle, is actually a repulsive one F=1.42 10-8N. Contrary to our expectation it is the magnetic contribution which gives rise to the
repulsive barrier Fm=2.96 10-8N, whereas the osmotic force is attractive: Fosm = -1.54 10-8N:
The physical reason of this repulsion is the demagnetizing field of the dense region which tends to push apart the two microparticles. In other words the magnetic field on the side facing the gap between microparticles (=180°) is lower than on the opposite side (=0°); since the magnetic force on the microparticle is directed towards the higher field, we see that this configuration generates a repulsive force. It also explains that the osmotic force is attractive since the volume fraction of nanoparticles is higher where the field is higher. On the other hand, when the particles are far enough, the dense clouds of the ferrofluid, surrounding the microparticles, do not interpenetrate and this effect disappears, giving rise to the usual attractive dipolar force.
IV. CONCLUSIONS
We have experimentally found that the magnetic dipolar force between two microparticles immersed in a nanodisperse ferrofluid is inverted and passes from attractive to repulsive when the separation between their surfaces is about one particle diameter or even more, depending on the size of the ferrofluid nanoparticles. We have explained the origin of this magnetic repulsive force by the condensation of the ferrofluid in the zone situated between the two particles. This zone of concentrated ferrofluid tends to elongate in order to decrease the demagnetizing field and thus generates a repulsive force. This magnetic barrier keeps the micron-sized particles far apart in the presence of an applied magnetic field, which completely modifies the field induced structures. As a consequence, the MR properties of the bidisperse MR fluids (suspensions of magnetizable microparticles in the ferrofluids) are considerably affected by the presence of the ferrofluid magnetic nanoparticles. In particular, we have found that the MR response (both in steady state and oscillatory regimes) decreases when the size of the ferrofluid nanoparticles is increased.
As a final conclusion, we can state that the repulsion between magnetizable microparticles is mainly induced by the concentration of the largest ferrofluid nanoparticles, which are able to undergo condensation under the local magnetic field in the proximity of the poles of the magnetizable microparticles.
ACKNOWLEDGEMENTS
This work has been supported by the Biomag project (Conseil Régional PACA, France), projects P08-FQM-3993 and P09-FQM-4787 (Junta de Andalucía, Spain), project FIS2009-07321 (MICINN, Spain), grants of Russian Fund of Fundamental investigations, 12-01-00132 and 13-02-91052; by the Federal Goal Program of Russian Federation, agreement 14.A18.21.0867, and the program of Ministry of Education of Russian Federation, project 2.1267.2011. M.T.L.-L. also acknowledges financial support by the University of Granada (Spain).
REFERENCES
[1] B. J. Park, F. F. Fang, and H. J. Choi, Soft Matter 6, 5246 (2010).
[2] G. Bossis, O. Volkova, S. Lacis, and A. Meunier, in Lecture Notes in Physics, Edited S.Odenbach, Springer, Berlin, (2002), p.p.186-230
[4] J. M. Ginder, L. D. Elie, and L. C. Davis, USA patent US5549837 (1996).
[5] M. T. López-López, J. de Vicente, G. Bossis, F. González-Caballero, and J.D.G. Durán, J. Mater. Res. 20, 874 (2005).
[6] N. M. Wereley, A. Chaudhuri, J. H. Yoo, S. John, S. Kotha, A. Suggs, R. Radhakrishnan, B. J. Love, and T. S. Sudarshan, J. Intell. Mater. Syst. Struct. 17, 393 (2006).
[7] E. F. Burguera, B. J. Love, R. Sahul, G. T. Ngatu, and N. M. Wereley, J. Intell. Mater. Syst. Struct. 19, 1361 (2008).
[8] M. T. López-López, P. Kuzhir, S. Lacis, G. Bossis, F. González-Caballero, and J. D. G. Durán, J. Phys.-Condes. Matter , 18, S2803 (2006).
[9] G. T. Ngatu and N. M. Wereley, IEEE Trans. Magn., 43, 2474 (2007). [10] G. T. Ngatu and N. M. Wereley, Int. J. Mod. Phys. B 21, 4922 (2007). [11] R. Patel and B. Chudasama, Phys. Rev. E , 80, 012401 (2009).
[12] J. L. Viota, F. González-Caballero, J. D. G. Durán, and A. V. Delgado, J. Colloid Interface Sci. 309, 135 (2007).
[13] J. L. Viota, J. D. G. Durán, F. González-Caballero, and A. V. Delgado, J. Magn. Magn. Mater. 314, 80 (2007).
[14] J. L. Viota, J. D. G. Durán, and A. V. Delgado, Eur. Phys. J. E., 29, 87 (2009). [15] M. T. López-López, A.Yu. Zubarev, and G. Bossis, Soft Matter, 6, 4346 (2010).
[16] M. T. López-López, J. D. G. Durán, A. V. Delgado, F. González-Caballero, J. Colloid Interface Sci. 291, 144 (2005).
[17] Y. Grasselli, G. Bossis, and E. Lemaire, J. Phys. II , 4, 253 (1994).
[18] M. T. López-López, P. Kuzhir, G. Bossis, and P. Mingalyov, Rheol. Acta, 47, 787 (2008).
[19] A. Yu. Buyevich and A. O. Ivanov, Physica A , 193, 221 (1993). [20] C. F. Hayers, J. Colloid Interface Sci., 52, 239 (1975).
[21] E. A. Peterson and A. A. Krueger, J. Colloid Interface Sci. , 62, 24 (1977). [22] J. C. Bacri and D. Salin, J. Magn. Magn. Mater. , 9, 48 (1983).
[23] A. F. Pshenichnikov, J. Magn. Magn. Mater. 145, 139 (1995).
[24] M. F. Islam, K. H. Lin, D. Lacoste, T. C. Lubenski, and A. G. Yodh, Phys. Rev. E, 67, 021402 (2003).
[25] L. Yu. Iskakova, G. A. Smelchakova, and A. Yu. Zubarev, Phys. Rev. E., 79, 011401 (2009).
[26] L. D. Landau and E. M. Lifshits, Electrodynamics of Continuous Media, Pergamon Press, Oxford, (1984).
FIGURE CAPTIONS
Figure 1. Particle size distribution for the initial (non-centrifuged) ferrofluid (dashed line) and for the 3-hour/20000g centrifuged ferrofluid (continuous line).
Figure 2. Magnetization curve at low field for the initial (non-centrifuged) ferrofluid (full circles) and for the 3-hour/20000g centrifuged ferrofluid (open squares).
Figure 3. Snapshots of the collision of two nickel particles dispersed in the 3-hour/20000g centrifuged ferrofluid, upon application of a magnetic field of 22kA/m. Direction of the field is indicated. Ferrofluid solid concentration was 5 vol.%. Snapshot (a) was taken during the approach. Snapshot (b) was taken in the stationary state.
Figure 4. High-luminance photo of two nickel microparticles dispersed in the centrifuged ferrofluid, upon application of a magnetic field of a 17kA/m. Ferrofluid solid concentration was 5 vol.%.
Figure 5. Same as Figure 2, but for nickel particles dispersed in a non-centrifuged ferrofluid.
Figure 6. Flow curves of suspensions containing 10 vol.% of iron microparticles dispersed in ferrofluids. Ferrofluid nanoparticle concentration was 5 vol.%. Full and open symbols correspond respectively to centrifuged and non-centrifuged ferrofluids. Applied magnetic field strength: 0kA/m (a); 31kA/m (b).
Figure 7. Viscosity at a shear rate of 200 s-1 as a function of the internal magnetic field strength for bidisperse MR fluids. Results for a conventional MR fluid are also included for comparison.
Figure 8. Storage (a) and loss (b) moduli as a function of the shear stress amplitude of oscillatory tests at a fixed frequency of 1 Hz, for suspensions containing 10 vol.% of iron microparticles dispersed in ferrofluids. Ferrofluid nanoparticle concentration was 5 vol.%. Full and open symbols correspond respectively to centrifuged and non-centrifuged ferrofluids. The applied magnetic field strength was 25kA/m in all cases.
Figure 9. Storage modulus plotted as a function of the frequency of the shear stress in oscillatory tests at a fixed amplitude of 0.2 Pa, for suspensions containing 10 vol.% of iron microparticles in 5 vol.% ferrofluids. Full and open symbols correspond respectively to centrifuged and non-centrifuged ferrofluids. Squares and circles stand for applied field intensities of 6 and 31kA/m, respectively.
Figure 10. Storage modulus as a function of the applied magnetic field strength for bidisperse MR fluids. Ferrofluid nanoparticle concentration was 5 vol.%. Results for a conventional MR fluid are also included for comparison.
Figure 11. Illustration of the solution of the equation = ( ,H)- ( 0,H0)=0, with
nanoparticle diameter d=16.5 nm and volume concentration of nanoparticles in the ferrofluid
0=0.25%; Red line 1 corresponds to the field H=22kA/m; green line 2 – H=25kA/m.
Figure 12. Distribution of magnetic field near two magnetizable nickel microparticles. Dots delimitate the condensed phase obtained in the dipolar approximation (first step of iteration). The map of magnetic field was obtained with FEMM taking into account the dense zone with a permeability d=3.75 instead of f=1.25 for the dilute ferrofluid and p=10
Figure 1. Particle size distribution for the initial (non-centrifuged) ferrofluid (dashed line) and for the 3-hour/20000g centrifuged ferrofluid (continuous line).
Figure 2. Magnetization curve at low field for the initial (non-centrifuged) ferrofluid (full circles) and for the 3-hour/20000g centrifuged ferrofluid (open squares).
Figure 3. Snapshots of the collision of two nickel particles dispersed in the 3-hour/20000g centrifuged ferrofluid, upon application of a magnetic field of 22kA/m. Direction of the field is indicated. Ferrofluid solid concentration was 5 vol.%. Snapshot (a) was taken during the approach. Snapshot (b) was taken in the stationary state.
Figure 4. High-luminance photo of two nickel microparticles dispersed in the centrifuged ferrofluid, upon application of a magnetic field of a 17kA/m. Ferrofluid solid concentration was 5 vol.%.
Figure 5. Same as Figure 2, but for nickel particles dispersed in a non-centrifuged ferrofluid.
Figure 6. Flow curves of suspensions containing 10 vol.% of iron microparticles dispersed in ferrofluids. Ferrofluid nanoparticle concentration was 5 vol.%. Full and open symbols correspond respectively to centrifuged and non-centrifuged ferrofluids. Applied magnetic field strength: 0kA/m (a); 31kA/m (b).
Figure 7. Viscosity at a shear rate of 200 s-1 as a function of the internal magnetic field strength for bidisperse MR fluids. Results for a conventional MR fluid are also included for comparison.
Figure 8. Storage (a) and loss (b) moduli as a function of the shear stress amplitude of oscillatory tests at a fixed frequency of 1 Hz, for suspensions containing 10 vol.% of iron microparticles dispersed in ferrofluids. Ferrofluid nanoparticle concentration was 5 vol.%. Full and open symbols correspond respectively to centrifuged and non-centrifuged ferrofluids. The applied magnetic field strength was 25kA/m in all cases.
Figure 9. Storage modulus plotted as a function of the frequency of the shear stress in oscillatory tests at a fixed amplitude of 0.2 Pa, for suspensions containing 10 vol.% of iron microparticles in 5 vol.% ferrofluids. Full and open symbols correspond respectively to centrifuged and non-centrifuged ferrofluids. Squares and circles stand for applied field intensities of 6 and 31kA/m, respectively.
Figure 10. Storage modulus as a function of the applied magnetic field strength for bidisperse MR fluids. Ferrofluid nanoparticle concentration was 5 vol.%. Results for a conventional MR fluid are also included for comparison.
Figure 12. Illustration of the solution of the equation = ( ,H)- ( 0,H0)=0, with
nanoparticle diameter d=16.5 nm and volume concentration of nanoparticles in the ferrofluid 0=0.25%; Red line 1 corresponds to the field H=22kA/m; green line 2 –
Figure 12. Distribution of magnetic field near two magnetizable nickel microparticles. Dots delimitate the condensed phase obtained in the dipolar approximation (first step of iteration). The map of magnetic field was obtained with FEMM taking into account the dense zone with a permeability d=3.75 instead of f=1.25 for the dilute ferrofluid and p=10