HAL Id: hal-02749133
https://hal.inrae.fr/hal-02749133
Submitted on 3 Jun 2020
HAL is a multi-disciplinary open access
archive for the deposit and dissemination of sci-entific research documents, whether they are pub-lished or not. The documents may come from teaching and research institutions in France or abroad, or from public or private research centers.
L’archive ouverte pluridisciplinaire HAL, est destinée au dépôt et à la diffusion de documents scientifiques de niveau recherche, publiés ou non, émanant des établissements d’enseignement et de recherche français ou étrangers, des laboratoires publics ou privés.
The adoption of IPM practices by small scale producers:
the case of greenhouse tomato growers in Turkey
Magali Aubert, Jean Marie Codron, Sylvain Rousset, Murat Yercan
To cite this version:
Magali Aubert, Jean Marie Codron, Sylvain Rousset, Murat Yercan. The adoption of IPM practices by small scale producers: the case of greenhouse tomato growers in Turkey. 7. Journées de Recherches en Sciences Sociales, Société Française d’Economie Rurale (SFER). FRA.; European Association of Agricultural Economists (EAAE). INT., Dec 2013, Angers, France. 26 p. �hal-02749133�
The adoption of IPM practices by small scale producers: the case
of greenhouse tomato growers in Turkey
Magali Aubert *
Jean-Marie Codron*
Sylvain Rousset **
Murat Yercan ***
* UMR 1110 MOISA, INRA-‐Montpellier Supagro 2 place Viala, 34060 Montpellier Cedex 2, France Tél : +33 4 99 61 24 11 – Fax : +33 4 67 54 58 05 aubert@supagro.inra.fr
codron@supagro.inra.fr
** Irstea, UR ADBX
50 avenue de Verdun, 33612 Cestas cedex, France Tél: + 33 5 57 89 08 00 – Fax: + 33 5 57 89 08 01 sylvain.rousset@irstea.fr
*** Faculty of Agriculture, Department of Agricultural Economics, Ege University 35100 Bornova-‐Izmir, Turkey murat.yercan@ege.edu.tr
Les 7
èmesjournées de recherche en sciences sociales INRA SFER CIRAD
Abstract:
In most competitive fresh fruit and vegetables chains, growers are faced with the need to comply with the requirements of increasingly safety demanding customers. Integrated Pest Management (IPM) practices have become a true solution for small scale growers that could not afford the cost of a GAP certificate. While literature on farmer adoption of IPM practices focuses on farmer and farm characteristics, only a few authors underline the importance of technology, marketing and pesticides safety control. Moreover, only a few papers have studied IPM adoption in developing or emerging countries. Our paper aims to fill this gap by focusing on Turkey, an emerging country with dominant small scale growers, where diffusion of IPM is still in its infancy. It also takes into account factors that go beyond the farmers and farm characteristics that are usually addressed by literature. 186 tomato growers have been surveyed in the province of Antalya, a region of Turkey supplying 85% of the national production of tomato grown under greenhouse. IPM adoption has been represented by two indicators : a counter of the eleven most salient IPM practices and a three-tier level of intensity of adoption (high, medium, low). Our analysis confirms most of our predictions and highlights the role of innovative factors such as technology, farming system characteristics, marketing and safety control.
1. INTRODUCTION
Pesticide use and more precisely its evolution over time has been assessed by the way of considering their impact. In the 1940’s in Europe pesticides were widely used to answer both the increasing food demand and the need to mitigate the adverse effect of pests and diseases on yield and quality. Since the early 1980’s, the counterpart of such intensive use, in terms of environment and human health, was taken into account. Nowadays, it can be considered that the use of pesticides corresponds to equilibrium between their utility and their negative externalities.
Pesticide use is generalized among economic sectors but agriculture has been identified to be the most concerned (Sattler et al., 2007). Citizen sensitiveness to environmental issues coupled with recent sanitary outbreaks have weakened consumers’ confidence. To restore their confidence, both public authorities and the private sector have implemented product and production requirements. Public authorities adopted a protection and control strategy, insisting on traceability, which became in 2005 a legal requirement in the European Union (regulation 178/2002). More precisely, traceability corresponds to “the ability to trace or
follow a food, feed, food producing animal or substance intended to be, or expected to be, incorporated onto a food, a feed, through all stages of production, and distribution“ (article
3). Hence, this traceability, which is defined for the food chain, aims to put only safe products on the market. The private sector goes beyond by implementing standards that are more constraining than regulations imposed by public authorities (Caswell and Modjuska, 1996; Fulponi, 2006; Souza-Monteiro and Caswell, 2009). These standards aim to restore consumers’ confidence and reinforce articulations between actors along the food chain.
Farmers are directly concerned by these evolutions and they have to adapt their production patterns in order to answer these requirements.
Integrated Pest Management (IPM) practices allows for keeping the pest level under an economic injury level. A huge literature focuses on the determinants of the implementation of such practices (Burton et al., 2003; Dörr and Grote, 2009; Mc Namara et al., 1991; Fernandez-Cornejo, 1996). While almost all studies focus on farmer and farm characteristics, only a few ones underline the importance of technology, marketing and pesticides safety control. Moreover, only a few papers have studied IPM adoption in developing or emerging countries. Our paper aims to fill this gap by focusing on Turkey, an emerging country where diffusion of IPM is still in its infancy and by taking into account factors that go beyond the
farmers and farm characteristics that are usually addressed by literature1. Turkish farmers under scrutiny are farmers growing tomato under plastic greenhouses in the Mediterranean Region, the most important tomato region of Turkey. Tomato is highly concerned with pesticides, which allow for complying with shelf life, organoleptic and cosmetic market requirements. Moreover, it is one of the fresh produce with highest level of production and international trade in Turkey and in the world. Turkey is a relevant case for our study since it ranks among the first world tomato producers (Turkey was positioned at the fourth place in 2009 according to FAO statistics) and has become a major exporter to safety demanding countries, with recent membership in the European Union and Russia, which has significantly upgraded its safety requirements in the last few years. To understand how Turkish growers implement IPM practices to comply with such requirements, a survey was conducted among 186 growers in the three major counties of the Antalya province (Mediterranean region). Our article is structured as follow. In the first section, we analyze the determinants of integrated pest management (IMP). In the second section, we present the Turkish context and the database used. In the third section, we coupled the information present in the database and the bibliography. In the fourth section, we present the results, before we conclude.
1 Our paper draws from the work that has been done within the work package 5, task 4 of the
Sustainmed European project FP- KBBE-2009-3 : Sustainable agri-food systems and rural development in the Mediterranean Partner Countries. Task 4 was addressing the pesticide safety risk management issues in high value chains. A final report of this task was published (Codron and al, 2012a).
2. Analytical framework
To keep pest production below an economic injury level, farmers can implement integrated pest management, denoted IPM (Kogan, 1998; Fernandez-Cornejo, 1996). According to the USDA (United States Department of Agriculture) “IPM is a management approach that
encourages natural control of pest population by anticipating pest problems and preventing pest from reaching economically damaging level. All appropriate techniques are used such as enhancing natural enemies, planting pest-resistant crops, adopting cultural management and using pesticides judiciously” (Fernandez-Cornejo, 1996).
A huge literature has tried to identify factors leading to the implementation of such technics. The richness of this literature comes from the diversity of approaches. Almost all authors consider the implementation of IPM practices in a dichotomous way, focusing on the adoption, or not, to a certification. The adoption of a certification, such as Global Gap certification, is widely considered in the literature (Burton et al., 2003; Dörr and Grote, 2009; Mc Namara et al., 1991). Some authors also consider a gradual indicator of the implementation of IPM (Zhou et al., 2001). Others consider a counter corresponding to the number of practices implemented (Fernandez-Cornejo, 1996; Shennan et al., 2001). This methodology is quite debated due to the possible dependence of the technics implemented. As a matter of fact, such a counter can be considered only when the implementation of one technic does not require, or prevent, the implementation of another one.
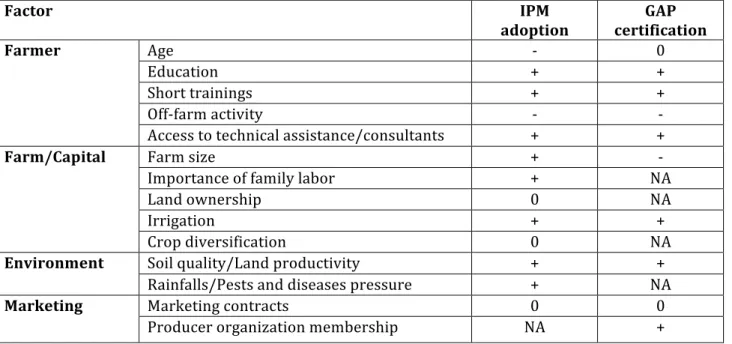
Whatever the IPM indicator considered, almost all authors underline the importance of individual and structural characteristics (Fernangez-Cornejo, 1996; Dörr and Grote, 2009; Mc Namara et al., 1991). Combined to these characteristics, some authors highlight the need to take into account other key factors such as the production techniques implemented (Dörr and Grote, 2009), marketing strategy (Souza and Caswell, 2009) or control by a third party (Zhou et al., 2011). The innovative contribution of our study is to take into account, at the same time, all these factors. Regardless the nature of the endogenous variable (qualitative or continuous), our reading of these studies will be interpreted in the way of a “better” way to manage pest risk. Codron et al. (2012b) made a synthesis of the theoretical framework. They propose a synthetic table of each factor considered (Table 1).
Table 1. Determinants of the adoption of sustainable farming practices: summary.
Factor IPM
adoption certificationGAP
Farmer Age -‐ 0
Education + +
Short trainings + +
Off-‐farm activity -‐ -‐
Access to technical assistance/consultants
aassistance/consultants + +
Farm/Capital Farm size + -‐
Importance of family labor + NA
Land ownership 0 NA
Irrigation + +
Crop diversification
0 NA
Environment Soil quality/Land productivity + + Rainfalls/Pests and diseases pressure + NA
Marketing Marketing contracts 0 0
Producer organization membership NA +
+: in most studies, increases the probability of adoption/the speed of diffusion. -: in most studies, decreases the probability of adoption/the speed of diffusion. 0: mixed results.
NA: variable not included in studies surveyed.
2.1. Farmer characteristics
The vast majority of the literature focuses on objective farmers’ characteristics such as level of education, experience, off-farm activity while fewer also take into account subjective ones such as risk aversion.
The main farmer’s characteristics that explain the implementation of IPM are level of education and experience. The age of the farmer is rarely considered because of its closed link with the level of education. Authors support the idea that the higher the level of education and the more the farmer is likely to implement such practices (Fernandez and Ferraioli, 1999; Dörr and Grote, 2009; Mc Namara et al., 1991). The effect of this characteristic seems to be not only unanimous but also validated in all studies mentioned.
The degree of experience is more debatable. While Fernandez-Cornejo (1996) emphasizes the negative impact of this variable in the implementation of IPM, Dörr and Grote (2009) demonstrate the contrary. We assume that the more a farmer has experience, the more his practices are based on routines and the less he’s likely to implement IPM practices since these practices require to be applied depending observations and adjustments.
H2: The more the farmer is experienced and the less he is likely to implement IPM practices
Beyond these characteristics, authors agree to emphasize the role of off-farm activity. Farmers who have another activity, in addition to their farm activity, are less likely to implement IPM practices (Dörr and Grote, 2009). However, for almost all studies this off-farm activity is highlighted to be relevant but not significant (Fernandez-Cornejo, 1996; Fernandez et al., 1994; Mc Namara et al., 1991).
H3: The more the farmer has an off-farm activity and the less he is likely to implement IPM practices
Another factor considered, even if non-significant, is workforce in the farm. Galt (2008) takes into account this variable to validate that a farmer is less likely to use pesticides in an intensive way when his activity needs a lot of labor, considering to some extent that employment is substitutable to pesticides.
H4: A farmer is more likely to implement IPM practices if its activity is based on more labor
Last, we consider that farmer membership in a group has a positive impact on the implementation of IPM practices since such membership results in more information and access to new opportunities.
H5: Membership in a group increases the probability to implement IPM practices
In addition to these objective individual characteristics, some studies underline the importance of some subjective indicators. The hypothesis done is that a farmer who takes deliberately risks is more likely to implement IPM practices (Ervin and Ervin, 1982; Lynne et al., 1995; Baumgart et al., 2012). All farmers do not have the same attitudes, perceptions and do not
have the same behavior even though they face the same context and have the same characteristics.
H6: The higher farmer risk awareness, the more the farmer is likely to implement IPM practices
Beyond these individual characteristics, almost all authors incorporate farm structural characteristics. In others words, the implementation of IPM practices depends not only on the farmers’ characteristics but also on farms’ characteristics.
2.2. Farm characteristics
The utilized agricultural area (UAA) is a criterion widely discussed in the literature. Dörr and Grote (2009) demonstrate that farmers who are less likely to implement IPM practices hold biggest farms. Burton et al. (2003) demonstrate the opposite effect while Mc Namara et al. (1991) demonstrate the non-significance of the utilized agricultural area. We can note that all these authors highlight the importance of such factor to understand farmers’ practices. We assume that implement IPM practices on largest farms are facilitated because of economy of scale.
H7: The more the farm of the grower is large and the more le’s likely to implement IPM practices
Some authors consider not only the physical size of the farm but also its degree of specialization (Dörr and Grote, 2009). The degree of specialization seems to be even higher on farms that implement IPM practices.
H8: The more a farm is specialized and the more the farmer is likely to implement IPM practices
Similarly, the economic size measured through the income is considered as a degree of dependence towards pesticides for the farmer. Hence, this dependence is supposed to have a positive impact on the way producer implement IPM practices (Mc Namara et al., 1991; Pampel and Vanes, 1977; Ervin and Ervin, 1982; Korsching et al., 1983).
H9: The more the economic size of the farm’s grower and the more he is likely to implement IPM practices
Beyond these characteristics, the type of ownership has to be taken into account. Depending the degree of the area that is under property, the producer will be more or less inclined to implement IPM practices. More precisely, the more the area is under property and the more the farmer will implement such practices (Fernandez-Cornejo, 1996).
H10: Ownership of the farm leads to higher implementation of IPM practices
2.3. Technology and farming system
Technology or farming systems can be more or less sophisticated. Dörr and Grote (2009) underline that the more the system used is advanced and the more the farmer is likely to implement IPM practices. Technology refers to the type of materials used. The most commonly cited in the literature is the mode of irrigation, for instance through the use of sprinklers. The farming system refers to cropping techniques or technical itineraries, for instance crop rotation or the use of heating systems.
H11: The more the grower has a sophisticated system and the more he is likely to implement IPM practices
2.4. Marketing
The marketing strategy is another aspect influencing the way producer chooses to implement IPM practices. This aspect refers essentially to the price paid, the method of payment (cash, with advance…) and the destination of the production (Souza and Caswell, 2009).
H12: The more the farmer develops a specific and appropriated marketing strategy and the more he is likely to implement IPM practices
2.5. Safety control
The way farmers implement control for quality or safety compliance reveals their ability to implement IPM practices. Two indicators are especially considered: the fact that the control is made by a third party (Fernandez-Cornejo, 1996) and the fact that the farmer implements a residues control plan (RCP) (Galt, 2008).
H13: Farmers who control safety through a third party are more likely to implement IPM practices
H14: Farmers who implement a RCP are more likely to implement IPM practices
2.6. Climatic conditions
Climatic conditions are one of the most important factors considered to explain the use of pesticides (Houmy, 1994; Aubert and Enjolras, 2012). Climatic constraints are assessed or measured through rainfall, temperatures or even the location when theses variables are not available (Fernandez-Cornejo, 1996; Galt, 2008; Sharma et al., 2011). In our case, no difference in terms of pest and disease pressure has been detected between the three counties under scrutiny in the Antalya province. Therefore, the climatic factor is dismissed from our analysis.
3. THE TURKISH CONTEXT 3.1. CONTEXT
3.1.1. The importance of tomato’s production in Turkey
The fresh fruits and vegetables sector is a key sector in Turkey. FFV production represents around 55% of the agricultural value in 2009, whereas Turkey ranks among major world exporters just after the United States and the European Union.
Turkey is specialized in particular in tomato production and is the fourth country producer in the world. In 2010, Turkish fresh tomato exports were more than 540 kT (Ministry of Agriculture, 2010).
Turkish farms growing FFV are characterized by small economical and physical size. According to Turkstat, in 2006, more than 90.7% of these farms had less than 13.000 TRY, including 65.9% that have less than 4.000 TRY (Turkish currency is Türk lira).
Turkish tomato production is concentrated in Antalya province. This province includes 77% of all Turkish farms producing tomato, 40% of the national tomato area while 50% of the tomato production of this province is exported (Ministry of Agriculture, 2010).
Tomato production in Antalya province is realized by small-scale farms that have on average 0.7 ha. Despite such a small size, Turkey is a key actor on the tomato international market. This position is all the more surprising that almost 80% of the tomato production is domestic market oriented.
Initially oriented to MENA (Middle East and North African) countries, Turkey progressively changed its exportation strategy by diversifying and upgrading its country portfolio. The next section highlights the impact of such a shift in export strategy on sanitary and phytosanitary management issues.
3.1.2. Diversification of tomato exports destinations and implications in terms of requirements imposed by importers’ countries
Initially, Turkish fresh fruit and vegetables exports were mainly oriented to the Russian market, and to a lesser extent to the MENA markets. Most destination countries were low safety demanding. The rejection of a pepper's shipment at the boarder of Germany has initiated a trend towards a significant upgrade of average requirements. Major increases in safety requirements have taken place in Russia and the Eastern European countries with recent membership in the European Union.
The customer portfolio diversification has been in favor of the most demanding countries in particular Russia and the Eastern part of the European Union and seems to coincide with the pre-accession of Turkey to the European Community. In the agricultural sector, there is an ongoing process of de facto harmonization with EU regulation, in particular regarding sanitary and phytosanitary standards. It is worth mentioning that, from the perspective of the
accession of the Turkey to this Community, one of the four pillars of the National Rural Development Strategy is food safety.
Until 1996, Turkey benefited from preferential treatments with the European market, in particular from subsidies to fertilizers. The 2007-2013 IPARD (Rural Development Program working as an instrument of pre-accession), in accordance with the 9th development Turkish plan, defines as a priority the upgrading of food safety. Such a priority was included in the axis 1 “Improvement of market efficiency and implementation of Community standards” (73% of the global budget) and within this axis, in the theme “restructuration and adoption to standards” (76% of the axis 1 budget) and in the theme “support for the establishment of producers groups” (7% of the axis 1 budget).
Since 2001, and the project of agricultural reform, Turkey has been anticipating the need to harmonize his legislation with the European one. A key point of this harmonization in the agricultural domain was the implementation of traceability at the production level. In 2004, the Turkish GAP (Good Agricultural Practices) was created. Like GlobalGap, this GAP standard allows for certifying that, from upstream to downstream, good practices have been implemented all along the production process and fits with some safety legal rules. In 2012, the Ministry of Agriculture imposed, to all fresh produce growers, to create for each crop and destination (domestic or export) a file with in particular the following information: grower identity, type of product, production area, volumes on sale (regulation 5957-2012). Another safety regulation aim to control the chemical input buying process at the grower level (Yasarikinsi, 2009). Since 2009, growers must be formally prescribed by a public or certified private agent to buy pesticides.
Private actors have been part of this safety upgrading process as well. In particular, considering that the public system of laboratories was not sufficient, they have made significant investments in the creation of private laboratories. In 2000, 50 laboratories specialized on pesticides residues were identified (OCDE/OMS, 2011).
The threat of consumer/citizen NGOs’ claims over sanitary issues has led some Turkish retailers to be more careful with their suppliers. Part of their efforts was channeled through the implementation of private GAP standards at the grower level (Global GAP, TNC) and to a lesser extent at the packer level (BRC).
The change in the Turkish foreign customer portfolio translates into more market safety requirements and therefore more constraints for growers to comply with such requirements. To understand to what extend how Turkish farmers implement IPM practices, a survey was performed among 186 growers.
3.2. THE DATABASE
The production of tomatoes in Turkey is concentrated in the province of Antalya, which produces 85% of total Turkish tomato grown under greenhouse. Antalya province is located in the Mediterranean region and composed by 13 districts including Kumlunca, Serik and Aksu. These three districts represent about 50% of the number of tomato producers, of the province tomato area and of the province tomato production. Given their dominant weight, surveys were limited to this area.
Given the geographical proximity of the three districts, climatic conditions and pest and disease pressure are quite similar; similary organizations and institutions do not significantly differ. Hence, we did not realize stratification based on producers’ location. Nevertheless, to take into account that the number of producers varies depending on the district, the number of producers under survey in a district has been chosen proportional to the total number of producers located in it.
Within each district, producers were randomly selected on a list provided by the Sub-Directorial Ministry of Agricultural of each district. Because of difficulties to survey producers, we did not realize a stratified sampling based on the agricultural area. Interviews were realized face-to-face with 186 growers in spring 2011. Producers were asked about the implementation of IPM practices. To understand their behavior they were also surveyed on farm structures, farmer characteristics, technology used and farming system, marketing and safety control. Information collected allows us to have a comprehensive view of the determinants of IPM practices.
4. RESULTS
4.1. Indicators of IPM practices 4.1.1. Scoring IPM practices
The implementation of IPM practices can be considered in terms of intensity (Sharma et al., 2010; Fernandez et al., 1994). In Turkey, regarding tomato production, the following eleven items are concerned by IPM practices: harvest and cropping equipment cleaning, greenhouse walls washing and spraying entrance of the greenhouse, existence of footbaths at each entrance of the greenhouse, water in excess control in soil, weeding in and outside the greenhouse, yellow sticky traps, elimination of first contaminated plants, use of biological auxiliaries, rotation, curtain for doors, automat climatic conditions and bombus bees.
Using a 1-5 Lickert scale, producers revealed the degree of implementation for each practice. A practice is considered as implemented since the grower declares it “mostly” or “all the time”. The IPM score calculated corresponds to the number of practices implemented, which can vary from 0 to 11. This indicator considers identically all practices. In others words, the score was calculated with the same weighting for all practices. The relevance of such an indicator is based on the assumption that the implementation of each practice is independent from the implementation of another one.
4.1.2. Clustering IPM practices into three levels of adoption
Another indicator is calculated. It is defined considering three levels of adoption: high, intermediate and low. For each practice, an average score of the eleven practices was calculated for growers having adopted the practice and those who did not. Average scores for the two groups were compared to the average score for all growers and classified respectively as positive or negative if exceeding by 1.5 more or less the average score for all growers. Practices associated to a positive score are relative to pheromones, footbaths and biological auxiliaries why practices associated to a negative score are relative to yellow traps, elimination of contaminated plants, curtain for doors, resistant varieties, weeding and equipment cleaning.
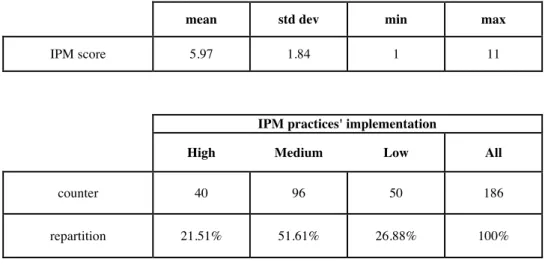
The “high” level of IPM practices’ implementation, called “high IPM”, corresponds to growers with no negative score and at least one positive; the “lower IPM” corresponds to growers with no positive and at least one negative score. In others words, growers with “high IPM” are those who implement most IPM practices while growers with “low IPM” are those who implement a few number of these practices. Producers with a “high IPM” represent 21.51% of all producers, while producers with “low IPM” represent 26.88% of our sample (Table 2).
4.2. Descriptive statistics
Farmer characteristics
Three levels of education have been considered for growers: primary, low secondary and high secondary/university. We observe that farmers with “high IPM” are more educated and have less experience than farmers with “low IPM”. Farmers with “high IPM” are 47.5% to have a high level of education and less than 15 years of experience. Farmers with “low IPM are 20% to have a high level of education and 30% to have less than 15 years of experience (Table 3). Farmers with “high IPM” have a lower off-farm activity than other farmers and less membership in a cooperative. Considering the amount of labor used on the farm, farmers with “high IPM” declare on average the equivalent of 9.3 full-time workers while farmers with “low IPM” declare on average the equivalent of 4.4 full-time workers. At last, we observe that farmers with “high IPM” declare to have a lower pest and disease’s pressure than farmers with a “low IPM”. Farmers were surveyed for seven pests2 and ten diseases3 and asked to assess for each of them, a degree of pressure than can vary from 0 (no pressure) to 10 (very high pressure). Average degrees of pressure were calculated for each pest and disease and for each of the three groups of IPM adoption. High correlation has been observed between average pest and average disease indicators.
Farm characteristics
Farm size can be represented by total agricultural area or total greenhouse area. Because these two variables are correlated and because our study focuses on tomato, mainly cultivated under greenhouse, we consider only the greenhouse size. We observe that farmers with “high IPM”
2 mites, white flies, cut worms, aplids, tarnished plant bugs, thrips and tuta absoluta
3 alternaria, anthracnosis, bacteriosis, botrytis, cladosporiosis, fusariosis, mildiou, mycosphaerella, oidium, rust
have largest farms than farmers with “low IPM”. The degree of tomato specialization can be considered through different indicators: the share of income obtained from tomato production, the share of greenhouse with tomato on total greenhouse area and the share of greenhouse area on agricultural area. Farmers with “high IPM” feature higher indicators of specialization whatever the indicator considered. Finally, farmers with “high IPM” are more diversified in terms of the number of species cultivated under greenhouse: first they are more likely to diversified their tomato production and second they more often than others use, under the same greenhouse, a system of double plantation, thus giving room for changing specie during the same year.
Technology and farming system
Growers with “high IPM” have a more intensive farming system than others. They are the only ones to implement a soilless production. Moreover, they have less plastic and more glass greenhouses. At last, they use more roof sprinklers.
Marketing
Growers with “high IPM” have more frequently than others a sorting activity, thus obtaining better prices for their loose production. They are also more likely to be paid cash, sell more frequently through alternative channels and less frequently than others through the City Hall, which is the standard channel for marketing tomato in Turkey.
Safety control
Producers who most frequently implement safety control are “high IPM” producers. They are respectively 43% and 26% to use an external audit and to implement a residue control plan, while they are respectively 5% and 9% for farmers with “low IPM”.
4.3. Econometric models
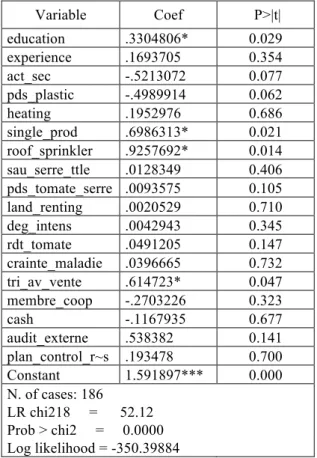
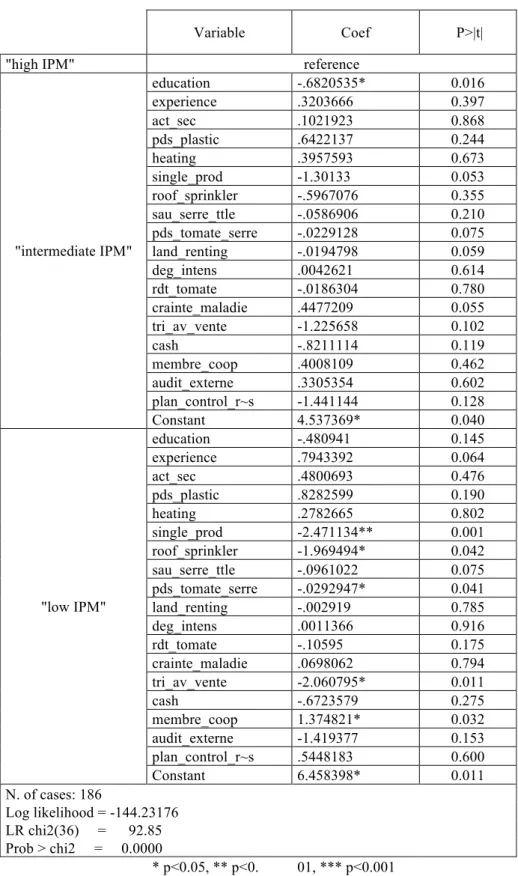
The first model performed is a Tobit model to explain the number of IPM practices’ implemented (Table 4). The second one is a multinomial model to understand the degree of IPM implementation, assuming that there is no progressive behavior for growers from “low IPM” to “intermediate IPM” and to “high IPM” (Table 5).
The results highlight the significant impact of farmer and farm characteristics on these two indicators. The more the grower is educated and the more he implements IPM practices. In the same way, more practices are implemented for producers who have no other activity than the agricultural activity. These characteristics have no impact on the probability to be qualified as “high IPM” or “low IPM”. The distinction between these two types comes rather from grower experience and membership in a cooperative; for instance growers with “high IPM” practices are less educated and less likely to have membership in a cooperative.
Tomato specialization when produced under greenhouse influences both the number of IPM practices and the probability to be “high IPM”. Farmers who are more specialized implement more practices and are more likely to be “high IPM” rather than to be “low IPM”. Large-scale growers will be more likely to be “high IPM” qualified as well.
Considering technology and the farming system characteristics, we observe that the number of IPM practices is even more higher that producers have a glass greenhouse, a single production and use a roof sprinkler; in others words it is even more higher that the production system is sophisticated. Such characteristics also lead more frequently to “high IPM” rather than “low IPM”.
The marketing strategy has a positive impact on the two indicators. Sorting the production before selling translates into the implementation of a higher number of IPM practices and into more likeliness for a grower to be qualified as “high IPM”.
At last, the implementation of an external audit is the only item in the domain of safety control to have a significant impact. This impact is positive on the probability to be “high IPM” rather than to be “low IPM.
5. Conclusion
Since the early 1980’s, the use of pesticides is increasingly regulated and market requirements are increasingly more stringent. Yet, the agricultural sector and more precisely the fresh fruit and vegetables (FFV) one keep using high quantities of pesticides.
Our analysis focuses on how Turkish tomato producers, who increasingly export their production to safety demanding markets, are progressively implementing IPM practices to comply with pesticides safety requirements and which factors influence the adoption of these practices. The relevancy of such a case study is from an economic and social point of view quite high since i) Turkey is a top producer and exporter of tomato in the world; ii) Turkey has still a long way to be able to comply with the requirements of the most safety demanding countries in the world, in particular the European Union which could be in the long term, one of his major customers. As a result, there are huge stakes for a large-scale implementation of IPM practices at the production level in Turkey.
From an academic point of view, this paper draws on the vast empirical literature that has developed during the last two decades on the adoption of GAP certificates and IPM practices. However, while almost all authors take into account farmer and farm characteristics, other aspects like technology, farming system characteristics, marketing and safety control are much less studied. Our paper contributes in an original way to the existing literature since it uses a more extensive list of factors and above all, it considers an emerging country where IPM practices are still in their infancy.
To that purpose, 186 producers have been surveyed in the province of Antalya, which is the main region with tomato production in Turkey. Thanks to this survey, we defined two indicators of IPM practices: a counter of practices and a scale of IMP intensity practices. Two econometric models were performed: a Tobit regression and a multinomial regression. Both underline the importance of considering simultaneously all items defined previously and confirm most of the literature findings.
More precisely, the implementation of IPM practices depends on the farmer and farm characteristics. Growers with higher level of education, higher experience and no extra-agricultural activity are more likely to be qualified “high IPM” than others and to implement high number of IPM practices. The producers’ decision of adoption is also conditioned by the characteristics of the farming system: the more it is intensive or sophisticated and the more the farmer is likely to be qualified as “high IPM” or to implement a higher number of practices than the other farmers.
Our results demonstrate that a marketing strategy like sorting production to sell with higher value is a key factor leading to more practices implemented and to a higher probability to be “high IPM” rather than to be “low IPM”.
At last, our results underline that farmers that implement external audits lead to a higher probability to be “high IPM” rather than to be “low IPM” while it has no impact on the number of practices implemented.
Two main limits can therefore be formulated. The first one is linked to the first indicator, the counter of practices implemented. We made the hypothesis that the implementation of each practice is independent to the implementation of other one. We also considered practices that seem to be independent.
The second limit is the fact that our results cannot be extrapolated at the province’s scale. Because of difficulties to meet producers, no stratification could be possible. Hence, the scope of our results is only valid for the sample considered. Any way, our sample is composed of 186 producers that represent a dominant share of the production of the province of Antalya. Hence, our results seem to be relevant at this scale, even though not completely representative.
A perspective to our study is to widen our sample size and to introduce financial aspects that could better explain the decision of adoption.
Annexes:
Table 2: IPM practices’ implementation indicators
mean std dev min max
IPM score 5.97 1.84 1 11
IPM practices' implementation
High Medium Low All
counter 40 96 50 186 repartition 21.51% 51.61% 26.88% 100%
Table 3:
IPM practices' implementation
High Medium Low All
40 96 50 186
Individual characteristics
Education (% high second/univ) 47.5 17.7 20 25 Experience (% less than 15 years) 47.5 35.4 30 37
Off-farm activity (%) 23 20 33 24.7
Amount of labour 9.3 4.6 4.4 5.4
Coop membership (%) 29 50 53 46.8
disease pressure perception 1.91 2.63 2.45 2.44 pest pressure perception 2.06 2.99 2.52 2.67
Farm characteristics
total area (da) 54.6 14.8 18.2 24.3
greenhouse area (da) 13.0 6.3 4.8 7.1
Specialized on tomato production 80 91 95 88
Specialized on greenhouse 50 59 48 54
Total income (k€) 315 59 47 103
Share of income linked to tomato income 83 80 73 79
sharecropping (% total area) 3 7 2 5
land renting (% total area) 12 6 7 7.3
Tomato diversification (% loose) 80 93 94 90 Degree of intensification (%of single production) 79.67 92.56 94 90.18 tomato yield (loose. kg/m2) 11.9 10.9 10.3 11.3
Production system
plastic greenhouse area (% total) 54 49 64 55
Heating system (%) 94 93 91 93
The use of roof sprinkler (%) 26 14 5 13
Soiless (%) 14 0 0 3
Marketing strategy
Share of tomato sorted (%) 91 82 72 81
City Hall (% total first T) 90 97 92 94
Type of payment (% cash) 43 23 26 27
Price (loose tomato) 0.89 0.79 0.78 0.81
Third party control
External audit (%) 43 15 5 17
Table 4. Tobit model Variable Coef P>|t| education .3304806* 0.029 experience .1693705 0.354 act_sec -.5213072 0.077 pds_plastic -.4989914 0.062 heating .1952976 0.686 single_prod .6986313* 0.021 roof_sprinkler .9257692* 0.014 sau_serre_ttle .0128349 0.406 pds_tomate_serre .0093575 0.105 land_renting .0020529 0.710 deg_intens .0042943 0.345 rdt_tomate .0491205 0.147 crainte_maladie .0396665 0.732 tri_av_vente .614723* 0.047 membre_coop -.2703226 0.323 cash -.1167935 0.677 audit_externe .538382 0.141 plan_control_r~s .193478 0.700 Constant 1.591897*** 0.000 N. of cases: 186 LR chi218 = 52.12 Prob > chi2 = 0.0000 Log likelihood = -350.39884
Table 5. Multinomial model
Variable Coef P>|t| "high IPM" reference
"intermediate IPM" education -.6820535* 0.016 experience .3203666 0.397 act_sec .1021923 0.868 pds_plastic .6422137 0.244 heating .3957593 0.673 single_prod -1.30133 0.053 roof_sprinkler -.5967076 0.355 sau_serre_ttle -.0586906 0.210 pds_tomate_serre -.0229128 0.075 land_renting -.0194798 0.059 deg_intens .0042621 0.614 rdt_tomate -.0186304 0.780 crainte_maladie .4477209 0.055 tri_av_vente -1.225658 0.102 cash -.8211114 0.119 membre_coop .4008109 0.462 audit_externe .3305354 0.602 plan_control_r~s -1.441144 0.128 Constant 4.537369* 0.040 "low IPM" education -.480941 0.145 experience .7943392 0.064 act_sec .4800693 0.476 pds_plastic .8282599 0.190 heating .2782665 0.802 single_prod -2.471134** 0.001 roof_sprinkler -1.969494* 0.042 sau_serre_ttle -.0961022 0.075 pds_tomate_serre -.0292947* 0.041 land_renting -.002919 0.785 deg_intens .0011366 0.916 rdt_tomate -.10595 0.175 crainte_maladie .0698062 0.794 tri_av_vente -2.060795* 0.011 cash -.6723579 0.275 membre_coop 1.374821* 0.032 audit_externe -1.419377 0.153 plan_control_r~s .5448183 0.600 Constant 6.458398* 0.011 N. of cases: 186 Log likelihood = -144.23176 LR chi2(36) = 92.85 Prob > chi2 = 0.0000 * p<0.05, ** p<0. 01, *** p<0.001
References:
Aubert, M. and Enjolras, G. (2012). “Entre dose homologuée et dose réellement appliquée : diagnostic des exploitations viticoles françaises”. Séminaire Economie de la production, Montpellier, France. 18-19 September 2012.
Baumgart-Getz, A. ; Stalker Prokopy, L. and Floress, K. (2012) « Why farmers adopt best management practice in the United States: A meta-analysis of the adoption literature ». Journal of Environmental Management, 96, 17-25.
Burton, M.; Rigby, D. and Young, T. (2003) “Modelling the adoption of organic horticultural technology in the UK using duration analysis”. The Australian Journal of Agricultural and Resource Economics, 47: 1, 29-54.
Caswell, A. J. and Mojduszka; E. M. (1996): “Using Informational Labeling to Influence the Market for Quality in Food Products”. American Journal of Agricultural Economics, v.78, n.5, p.1248-1253.
Codron, J. M. ; Hadanacioglu, H. ; Aubert, M. ; Bouhsina, Z. ; El Mekki, A. A. ; Rousset, S. ; Tozanli, S. ; Yercan, M. (2012a). « Public and private regulation of sanitary risks in fresh produce marketing chains: the case of Morocco and Turkey ». 133 EAAE Seminar : Developing integrated and reliable modeling tools for agricultural and environmental policy analysis.
Codron, J. M. ; Adanacioglu, H. ; Aubert, M. ; Bouhsina, Z. ; El Mekki, A. A. ; Rousset, S. ; Tozanli, S. ; Yercan, M. (2012b). « Pesticide safety risk management in high value chains: the case of Turkey and Morocco ». Commission Européenne, 146p.
Ervin, C.A. and D.E. Ervin, (1982). “Factors Affecting the Use of Soil Conservation Practices: Hypotheses, Evidence, and Policy Implications.” Land Economics 58: 277–292. Fulponi, L. (2006). « Private voluntary standards in the food system: The perspective of major food retailers in OECD countries ». Food Policy 31(1):1-13.
FAOSTAT, September 2010
Fernandez-Cornejo, J. (1996). "The microeconomic impact of IPM adoption: theory and application." Agricultural and resources economics review: 149-160.
Fernandez-Cornejo, J. and Ferraioli, J. (1999). "The environmental effects of adopting IPM techniques: The case of peach producers." Journal of agricultural and applied economics 31: 551-564.
Fernandez-Cornejo. J. Douglas Beach, E. and Wen-Yuan Huang (1994). « The Adoption of 1PM Techniques By Vegetable Growers in Florida, Michigan and Texas ». Journal of Agricultural and Applied Economics. 26 (1), 158-172
Galt, R. E. (2008). "Toward an Integrated understanding of pesticide use Intensity in Costa Rican vegetable farming." Human Ecology 36: 655-677.
Grote, A. C and Grote, U. (2009). "Impact of certification on fruit producers in the Sao Francisco Valley in Brazil." Economics and applied informatics: 5-16.
Houmy K. (1994), "Importance des conditions climatiques dans l'application des produits phytosanitaires", Revue ANAFIDE, 97: 34-‐40.
M. Kogan (1998). Integrated Pest Management: Historical Perspectives and Contemporary Developments Annual Review of Entomology.
Korsching, P. F., C. W. Stofferahn, P.J. Nowak, and D. Wagener. (1983). "Adoption Characteristics and Adoption Patterns of Minimum Tillage: Implications for Soil Conservation Programs." Journal of Soil and Water Conservation 38:428-430.
Lynne, G.D.; Casey, C.F.; Hodges, A. and Rahmani, M. (1995); “Conservation technology adoption decisions and the theory of planned behaviour”. Journal of Economic Psychology. Vol 16, issue4, pp. 581–598.
McNamara, M. E. W. and G. Keith Douce (1991). "Factors affecting peanut producer adoption of integrated pest management." Agricultural & applied economics association 13: 129-139.
OCDE/OMS (2011). “Evaluation des réformes de la politique agricole en Turquie”. Editions OCDE. http://dx.doi.org/10.1787/9789264113244-fr
Pampel, F., Jr., and J.C. van Es. (1977). "Environmental Quality and Issues of Adoption Research." Rural Sociology 42:57- 71.
Sattler, C.; Harald, K. and Verch; G. (2007). “Assessing the intensity of pesticide use in agriculture”. Agriculture, Ecosystems and Environment 119. 299–304
Shennan, C. ; Cecchettini, CL. ; Goldman, GB. and FG Zalon (2001). « Profiles of California farmers by degree of IPM use as indicated by self-descriptions in a phone survey ». Agriculture ecosystems & environment, vol 84 p. 267-275
Souza Monteiro, D. and J. A. C. (2009). "Traceability adoption at the farm level: An empirical analysis of the Portuguse pear industry." Food policy 34: 94-101.
Yasarakinci, N. (2009). ‘IPM in Turkiye’. http://www.scribd.com/doc/16191931/IPM-.‐in-.‐ Turkey.
J. Zhou, J. H. Helen and J. Liang (2011). Implementation of food safety and quality standards : a case study of vegetable processing industry in Zhejiang, China – The social